

Key Insights
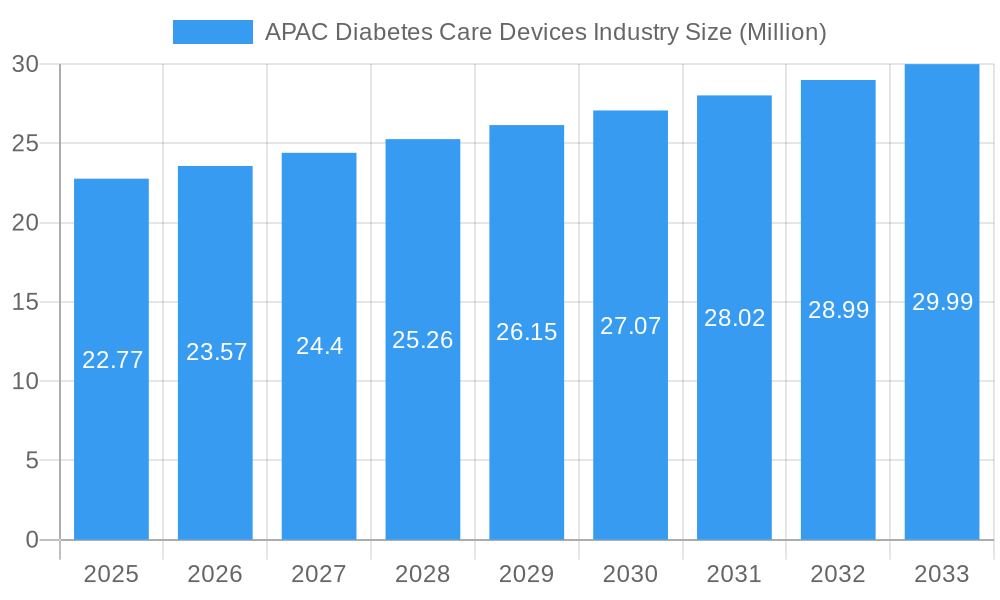
The APAC Diabetes Care Devices market is poised for substantial growth, projected to reach an estimated USD 22.77 million by 2025, with a robust Compound Annual Growth Rate (CAGR) of 3.50% anticipated to continue through 2033. This expansion is fueled by a confluence of factors, including the rising prevalence of diabetes across the region, increasing healthcare expenditure, and a growing awareness among both patients and healthcare providers regarding the critical importance of effective diabetes management. Technological advancements in both insulin delivery systems, such as sophisticated insulin pumps and advanced insulin pens, and blood glucose monitoring devices, including continuous glucose monitoring (CGM) systems, are playing a pivotal role. These innovations are enhancing patient convenience, accuracy, and overall treatment efficacy, driving demand for these advanced solutions. Furthermore, the increasing adoption of home-based self-monitoring and management solutions, supported by favorable government initiatives and a growing disposable income in key APAC economies, is also a significant growth driver.
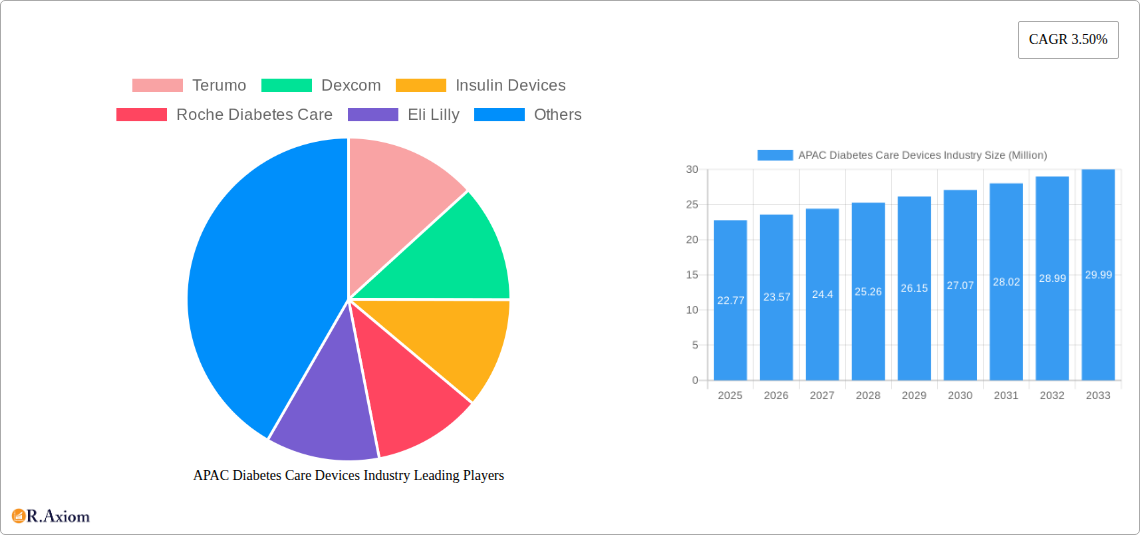
APAC Diabetes Care Devices Industry Market Size (In Million)
The market segmentation reveals distinct areas of opportunity. Within management devices, insulin pumps, particularly tubeless and tethered variants, are gaining traction due to their user-friendliness and improved glycemic control. Insulin pens, encompassing both reusable and disposable options, also hold a significant share. Monitoring devices are witnessing accelerated adoption, with continuous glucose monitoring systems, comprising advanced sensors and durable receivers, emerging as a key area of innovation and market demand. Self-monitoring blood glucose devices, including glucometers and test strips, remain essential, especially in regions with limited access to advanced technologies. The end-user landscape is characterized by a dual demand from hospitals/clinics and home/personal settings, reflecting the shift towards decentralized and patient-centric diabetes care. Key players like Abbott Diabetes Care, Dexcom, Medtronic, and Novo Nordisk A/S are strategically investing in research and development and expanding their presence across the diverse APAC markets, contributing to market dynamism and competitive landscape.
APAC Diabetes Care Devices Industry Company Market Share
This in-depth report provides a thorough analysis of the APAC Diabetes Care Devices Industry, encompassing market size, trends, growth drivers, challenges, and competitive landscapes. Spanning the Historical Period (2019–2024), Base Year (2025), Estimated Year (2025), and an extensive Forecast Period (2025–2033), this study offers unparalleled insights for industry stakeholders, investors, and decision-makers navigating this dynamic sector. Leveraging high-traffic keywords such as "APAC diabetes devices market," "continuous glucose monitoring APAC," "insulin pump market Asia Pacific," and "diabetes management devices," this report aims to optimize search visibility and engage a broad audience of industry professionals.
APAC Diabetes Care Devices Industry Market Concentration & Innovation
The APAC Diabetes Care Devices Industry is characterized by a moderate to high level of market concentration, with key players like Terumo, Dexcom, Roche Diabetes Care, Abbott Diabetes Care, and Medtronic holding significant market shares. Innovation is a primary driver of growth, fueled by advancements in sensor technology, artificial intelligence for predictive analytics, and user-friendly interface design. Regulatory frameworks across APAC countries, while evolving, present a complex landscape impacting product approvals and market entry. The threat of product substitutes is present, particularly from less technologically advanced but more affordable alternatives in emerging economies. End-user trends are shifting towards home-based monitoring and automated insulin delivery systems, driven by convenience and improved patient outcomes. Merger and acquisition (M&A) activities are expected to intensify as larger companies seek to consolidate market presence and acquire innovative technologies. Recent M&A deals have seen valuations in the range of hundreds of millions of dollars as strategic acquisitions become more prevalent.
- Key Innovation Drivers: Miniaturization of devices, enhanced data connectivity, improved accuracy of glucose readings, personalized treatment algorithms.
- Regulatory Landscape: Diverse approval pathways, varying reimbursement policies, data privacy regulations.
- End-User Preferences: Demand for non-invasive or minimally invasive solutions, wearable technology, seamless integration with digital health platforms.
- M&A Trends: Focus on acquiring innovative CGM and insulin delivery technologies, expansion into underpenetrated markets.
APAC Diabetes Care Devices Industry Industry Trends & Insights
The APAC Diabetes Care Devices Industry is poised for substantial growth, projected at a Compound Annual Growth Rate (CAGR) of approximately 8.5% over the forecast period. This expansion is primarily driven by the escalating prevalence of diabetes across the region, attributed to lifestyle changes, aging populations, and increasing rates of obesity. Technological advancements, particularly in continuous glucose monitoring (CGM) and smart insulin pens, are revolutionizing diabetes management, offering greater accuracy, convenience, and improved patient outcomes. The increasing awareness among patients and healthcare professionals regarding the benefits of proactive diabetes management is also a significant growth catalyst. Furthermore, supportive government initiatives and reimbursement policies in several key APAC economies are fostering wider adoption of advanced diabetes care devices. Consumer preferences are increasingly leaning towards integrated digital health solutions that offer real-time data insights and personalized feedback, enabling a more proactive and self-managed approach to diabetes. The competitive landscape is dynamic, with established players investing heavily in research and development to maintain their market positions, while new entrants are emerging, particularly from China and South Korea, with innovative solutions. Market penetration for advanced diabetes devices, while still relatively low in some developing nations, is rapidly increasing, creating significant opportunities for growth.
- Market Growth Drivers: Rising diabetes incidence, technological innovations, increasing healthcare expenditure, growing health consciousness.
- Technological Disruptions: Evolution of CGM sensors, development of closed-loop insulin delivery systems, integration of AI and machine learning.
- Consumer Preferences: Demand for user-friendly, connected, and personalized diabetes management tools.
- Competitive Dynamics: Strategic partnerships, R&D investments, market expansion strategies by leading companies.
Dominant Markets & Segments in APAC Diabetes Care Devices Industry
The APAC Diabetes Care Devices Industry is dominated by Continuous Glucose Monitoring (CGM) devices, driven by their superior accuracy and real-time data capabilities compared to traditional self-monitoring blood glucose (SMBG) methods. Within CGM, Sensors represent the largest sub-segment by market share, followed closely by Durables (Receivers and Transmitters). The Home/Personal end-user segment holds a commanding position, reflecting the increasing trend of self-management of diabetes and the convenience offered by these devices for daily use.
Leading Regions and Countries:
- China is a dominant market, propelled by its large population, rising diabetes rates, and significant government investment in healthcare technology.
- Japan and South Korea are key markets due to their high adoption rates of advanced medical devices and sophisticated healthcare infrastructure.
- India presents a rapidly growing market, driven by increasing diabetes prevalence and a burgeoning middle class with rising disposable incomes.
Dominant Device Segments:
- Continuous Glucose Monitoring (CGM):
- Sensors: This sub-segment is characterized by continuous innovation, with a focus on longer wear times, improved accuracy, and reduced calibration needs. The market is driven by the demand for real-time glucose insights and trend data.
- Durables (Receivers and Transmitters): These components are crucial for data transmission and display, with a growing emphasis on seamless connectivity to smartphones and cloud-based platforms.
- Insulin Pumps:
- Tubeless Insulin Pumps: This technology is gaining traction due to its discreetness and ease of use, offering improved patient comfort and mobility.
- Insulin Pump Reservoir: A critical component, demand is driven by the increasing adoption of insulin pump therapy.
- Infusion Set: Essential for the delivery of insulin, continuous innovation focuses on comfort and longevity.
- Self-Monitoring Blood Glucose (SMBG):
- Glucometer Devices: While facing competition from CGMs, SMBG remains a significant segment, especially in price-sensitive markets.
- Blood Glucose Test Strips: A recurring revenue stream for manufacturers, demand is directly linked to glucometer usage.
Key Drivers of Dominance:
- Economic Policies: Favorable reimbursement policies and government incentives for advanced diabetes care technologies.
- Infrastructure: Well-developed healthcare infrastructure in leading countries supports the adoption and effective utilization of sophisticated devices.
- Technological Adoption: High receptivity to new technologies and digital health solutions among the population and healthcare providers.
- Diabetes Burden: High and increasing prevalence of diabetes necessitates effective and advanced management solutions.
APAC Diabetes Care Devices Industry Product Developments
Recent product developments in the APAC Diabetes Care Devices Industry highlight a strong focus on enhanced usability, data connectivity, and extended wear times. The Sibionics GS1 CGM system, receiving a CE Mark in November 2023, exemplifies this trend with its 14-day wear time and effortless data transmission to mobile devices, eliminating frequent calibration. Similarly, Ypsomed's August 2022 launch of smartphone-controlled bolus delivery for the mylife YpsoPump demonstrates a commitment to discreet and convenient insulin administration. These innovations underscore the industry's drive towards creating seamless, patient-centric solutions that integrate advanced technology for improved diabetes management.
Report Scope & Segmentation Analysis
This report comprehensively segments the APAC Diabetes Care Devices Industry across key product categories and end-user demographics. The Management Devices segment includes a granular breakdown of Insulin Pumps, further divided into Tethered Insulin Pump and Tubeless Insulin Pump technologies, and their critical components: Insulin Pump Device, Insulin Pump Reservoir, and Infusion Set. The Insulin Pens sub-segment covers Cartridges in Reusable Pens and Insulin Disposable Pens, alongside Insulin Syringes and Jet Injectors. The Monitoring Devices segment encompasses Self-monitoring Blood Glucose (SMBG), with sub-categories of Glucometer Devices, Blood Glucose Test Strips, and Lancets. A significant focus is placed on Continuous Glucose Monitoring (CGM), detailed by Sensors and Durables (Receivers and Transmitters). The End User segmentation analyzes the market across Hospital/Clinics and Home/Personal settings. Growth projections for each segment indicate robust expansion, with CGM and advanced insulin delivery systems expected to lead the market in terms of revenue and adoption rates.
Key Drivers of APAC Diabetes Care Devices Industry Growth
The APAC Diabetes Care Devices Industry is propelled by several critical drivers. The alarmingly high and increasing prevalence of diabetes across the region, fueled by lifestyle shifts and an aging population, creates a vast and growing patient pool. Technological innovations, particularly in continuous glucose monitoring (CGM) and smart insulin delivery systems, offer superior management solutions. Growing healthcare expenditure and supportive government initiatives, including reimbursement policies for advanced devices, are enhancing accessibility. Furthermore, increased patient awareness and demand for proactive self-management tools are significant growth catalysts.
- Rising Diabetes Prevalence: The sheer volume of undiagnosed and diagnosed diabetic patients.
- Technological Advancements: Development of user-friendly, accurate, and connected devices.
- Government Support: Favorable policies and reimbursement schemes boosting adoption.
- Consumer Awareness: Growing demand for personalized and convenient diabetes management.
Challenges in the APAC Diabetes Care Devices Industry Sector
Despite its promising growth, the APAC Diabetes Care Devices Industry faces several challenges. Regulatory complexities and variations across different countries can hinder market entry and product approvals. The high cost of advanced devices, especially CGMs and insulin pumps, remains a significant barrier for a large portion of the population in emerging economies, leading to market segmentation based on affordability. Supply chain disruptions, exacerbated by geopolitical factors and the COVID-19 pandemic, can impact product availability. Intense competition from both global players and emerging local manufacturers also puts pressure on pricing and profit margins.
- Regulatory Hurdles: Divergent approval processes and stringent standards.
- Cost of Devices: Affordability remains a critical concern for widespread adoption.
- Supply Chain Vulnerabilities: Disruptions impacting manufacturing and distribution.
- Intense Competition: Price wars and the need for continuous innovation.
Emerging Opportunities in APAC Diabetes Care Devices Industry
The APAC Diabetes Care Devices Industry presents numerous emerging opportunities. The increasing adoption of digital health platforms and wearable technology opens avenues for integrated diabetes management ecosystems, including remote patient monitoring and telehealth services. The growing focus on personalized medicine and data analytics allows for tailored treatment approaches and predictive insights. Expansion into underserved rural and semi-urban areas within emerging economies offers significant untapped market potential. Furthermore, strategic partnerships between device manufacturers, pharmaceutical companies, and healthcare providers can foster innovation and expand market reach.
- Digital Health Integration: Connected devices and cloud-based platforms.
- Personalized Medicine: Data-driven treatment strategies.
- Untapped Markets: Rural and semi-urban areas in developing nations.
- Strategic Collaborations: Partnerships for innovation and market expansion.
Leading Players in the APAC Diabetes Care Devices Industry Market
- Terumo
- Dexcom
- Roche Diabetes Care
- Eli Lilly
- Sanofi
- Abbott Diabetes Care
- Medtronic
- LifeScan (Johnson & Johnson)
- Becton Dickinson
- Novo Nordisk A/S
- Arkray
Key Developments in APAC Diabetes Care Devices Industry Industry
- November 2023: Sibionics, a Chinese company, received a CE Mark for its GS1 continuous glucose monitoring system (CGM). This innovative wearable device utilizes an under-the-skin sensor to accurately measure glucose levels in real-time. The collected data is then seamlessly transmitted to a connected handset or mobile phone. The GS1 CGM provides users with a remarkable 14-day continuous glucose monitoring experience, eliminating the need for frequent calibration. Additionally, it empowers users to effortlessly transmit their glucose data to monitoring devices or mobile apps, enabling them to generate comprehensive and insightful professional reports.
- August 2022: Ypsomed launched bolus delivery from the smartphone on the mylife YpsoPump via the mylife App. This new feature enables mylife YpsoPump users to deliver the bolus insulin conveniently and discreetly via their smartphone without interacting with the pump.
Strategic Outlook for APAC Diabetes Care Devices Industry Market
The strategic outlook for the APAC Diabetes Care Devices Industry is exceptionally positive, driven by a confluence of escalating diabetes rates, rapid technological advancements, and a growing emphasis on proactive health management. The industry is set to witness sustained growth, fueled by innovations in CGM, insulin delivery systems, and digital health integration. Key strategic imperatives for market players will include expanding into high-growth emerging markets, investing in R&D for next-generation devices, and forging strategic alliances to enhance market penetration and product offerings. The future success of the industry hinges on addressing affordability concerns and navigating evolving regulatory landscapes, ultimately aiming to provide accessible and effective diabetes management solutions across the diverse APAC region.
APAC Diabetes Care Devices Industry Segmentation
-
1. Management Devices
-
1.1. Insulin Pump
-
1.1.1. Technology
- 1.1.1.1. Tethered Insulin Pump
- 1.1.1.2. Tubeless Insulin Pump
-
1.1.2. Component
- 1.1.2.1. Insulin Pump Device
- 1.1.2.2. Insulin Pump Reservoir
- 1.1.2.3. Infusion Set
-
1.1.1. Technology
-
1.2. Insulin pens
- 1.2.1. Cartridges in Reusable Pens
- 1.2.2. Insulin Disposable Pens
- 1.3. Insulin Syringes
- 1.4. Jet Injectors
-
1.1. Insulin Pump
-
2. Monitoring Devices
-
2.1. Self-monitoring Blood Glucose
- 2.1.1. Glucometer Devices
- 2.1.2. Blood Glucose Test Strips
- 2.1.3. Lancets
-
2.2. Continuous Glucose Monitoring
- 2.2.1. Sensors
- 2.2.2. Durables (Receivers and Transmitters)
-
2.1. Self-monitoring Blood Glucose
-
3. End User
- 3.1. Hospital/Clinics
- 3.2. Home/Personal
APAC Diabetes Care Devices Industry Segmentation By Geography
-
1. North America
- 1.1. United States
- 1.2. Canada
- 1.3. Mexico
-
2. South America
- 2.1. Brazil
- 2.2. Argentina
- 2.3. Rest of South America
-
3. Europe
- 3.1. United Kingdom
- 3.2. Germany
- 3.3. France
- 3.4. Italy
- 3.5. Spain
- 3.6. Russia
- 3.7. Benelux
- 3.8. Nordics
- 3.9. Rest of Europe
-
4. Middle East & Africa
- 4.1. Turkey
- 4.2. Israel
- 4.3. GCC
- 4.4. North Africa
- 4.5. South Africa
- 4.6. Rest of Middle East & Africa
-
5. Asia Pacific
- 5.1. China
- 5.2. India
- 5.3. Japan
- 5.4. South Korea
- 5.5. ASEAN
- 5.6. Oceania
- 5.7. Rest of Asia Pacific

APAC Diabetes Care Devices Industry Regional Market Share
Geographic Coverage of APAC Diabetes Care Devices Industry
APAC Diabetes Care Devices Industry REPORT HIGHLIGHTS
| Aspects | Details |
|---|---|
| Study Period | 2020-2034 |
| Base Year | 2025 |
| Estimated Year | 2026 |
| Forecast Period | 2026-2034 |
| Historical Period | 2020-2025 |
| Growth Rate | CAGR of 3.50% from 2020-2034 |
| Segmentation |
|
Table of Contents
- 1. Introduction
- 1.1. Research Scope
- 1.2. Market Segmentation
- 1.3. Research Objective
- 1.4. Definitions and Assumptions
- 2. Executive Summary
- 2.1. Market Snapshot
- 3. Market Dynamics
- 3.1. Market Drivers
- 3.2. Market Restrains
- 3.3. Market Trends
- 3.4. Market Opportunities
- 4. Market Factor Analysis
- 4.1. Porters Five Forces
- 4.1.1. Bargaining Power of Suppliers
- 4.1.2. Bargaining Power of Buyers
- 4.1.3. Threat of New Entrants
- 4.1.4. Threat of Substitutes
- 4.1.5. Competitive Rivalry
- 4.2. PESTEL analysis
- 4.3. BCG Analysis
- 4.3.1. Stars (High Growth, High Market Share)
- 4.3.2. Cash Cows (Low Growth, High Market Share)
- 4.3.3. Question Mark (High Growth, Low Market Share)
- 4.3.4. Dogs (Low Growth, Low Market Share)
- 4.4. Ansoff Matrix Analysis
- 4.5. Supply Chain Analysis
- 4.6. Regulatory Landscape
- 4.7. Current Market Potential and Opportunity Assessment (TAM–SAM–SOM Framework)
- 4.8. RAX Analyst Note
- 4.1. Porters Five Forces
- 5. Market Analysis, Insights and Forecast 2021-2033
- 5.1. Market Analysis, Insights and Forecast - by Management Devices
- 5.1.1. Insulin Pump
- 5.1.1.1. Technology
- 5.1.1.1.1. Tethered Insulin Pump
- 5.1.1.1.2. Tubeless Insulin Pump
- 5.1.1.2. Component
- 5.1.1.2.1. Insulin Pump Device
- 5.1.1.2.2. Insulin Pump Reservoir
- 5.1.1.2.3. Infusion Set
- 5.1.1.1. Technology
- 5.1.2. Insulin pens
- 5.1.2.1. Cartridges in Reusable Pens
- 5.1.2.2. Insulin Disposable Pens
- 5.1.3. Insulin Syringes
- 5.1.4. Jet Injectors
- 5.1.1. Insulin Pump
- 5.2. Market Analysis, Insights and Forecast - by Monitoring Devices
- 5.2.1. Self-monitoring Blood Glucose
- 5.2.1.1. Glucometer Devices
- 5.2.1.2. Blood Glucose Test Strips
- 5.2.1.3. Lancets
- 5.2.2. Continuous Glucose Monitoring
- 5.2.2.1. Sensors
- 5.2.2.2. Durables (Receivers and Transmitters)
- 5.2.1. Self-monitoring Blood Glucose
- 5.3. Market Analysis, Insights and Forecast - by End User
- 5.3.1. Hospital/Clinics
- 5.3.2. Home/Personal
- 5.4. Market Analysis, Insights and Forecast - by Region
- 5.4.1. North America
- 5.4.2. South America
- 5.4.3. Europe
- 5.4.4. Middle East & Africa
- 5.4.5. Asia Pacific
- 5.1. Market Analysis, Insights and Forecast - by Management Devices
- 6. Global APAC Diabetes Care Devices Industry Analysis, Insights and Forecast, 2021-2033
- 6.1. Market Analysis, Insights and Forecast - by Management Devices
- 6.1.1. Insulin Pump
- 6.1.1.1. Technology
- 6.1.1.1.1. Tethered Insulin Pump
- 6.1.1.1.2. Tubeless Insulin Pump
- 6.1.1.2. Component
- 6.1.1.2.1. Insulin Pump Device
- 6.1.1.2.2. Insulin Pump Reservoir
- 6.1.1.2.3. Infusion Set
- 6.1.1.1. Technology
- 6.1.2. Insulin pens
- 6.1.2.1. Cartridges in Reusable Pens
- 6.1.2.2. Insulin Disposable Pens
- 6.1.3. Insulin Syringes
- 6.1.4. Jet Injectors
- 6.1.1. Insulin Pump
- 6.2. Market Analysis, Insights and Forecast - by Monitoring Devices
- 6.2.1. Self-monitoring Blood Glucose
- 6.2.1.1. Glucometer Devices
- 6.2.1.2. Blood Glucose Test Strips
- 6.2.1.3. Lancets
- 6.2.2. Continuous Glucose Monitoring
- 6.2.2.1. Sensors
- 6.2.2.2. Durables (Receivers and Transmitters)
- 6.2.1. Self-monitoring Blood Glucose
- 6.3. Market Analysis, Insights and Forecast - by End User
- 6.3.1. Hospital/Clinics
- 6.3.2. Home/Personal
- 6.1. Market Analysis, Insights and Forecast - by Management Devices
- 7. North America APAC Diabetes Care Devices Industry Analysis, Insights and Forecast, 2020-2032
- 7.1. Market Analysis, Insights and Forecast - by Management Devices
- 7.1.1. Insulin Pump
- 7.1.1.1. Technology
- 7.1.1.1.1. Tethered Insulin Pump
- 7.1.1.1.2. Tubeless Insulin Pump
- 7.1.1.2. Component
- 7.1.1.2.1. Insulin Pump Device
- 7.1.1.2.2. Insulin Pump Reservoir
- 7.1.1.2.3. Infusion Set
- 7.1.1.1. Technology
- 7.1.2. Insulin pens
- 7.1.2.1. Cartridges in Reusable Pens
- 7.1.2.2. Insulin Disposable Pens
- 7.1.3. Insulin Syringes
- 7.1.4. Jet Injectors
- 7.1.1. Insulin Pump
- 7.2. Market Analysis, Insights and Forecast - by Monitoring Devices
- 7.2.1. Self-monitoring Blood Glucose
- 7.2.1.1. Glucometer Devices
- 7.2.1.2. Blood Glucose Test Strips
- 7.2.1.3. Lancets
- 7.2.2. Continuous Glucose Monitoring
- 7.2.2.1. Sensors
- 7.2.2.2. Durables (Receivers and Transmitters)
- 7.2.1. Self-monitoring Blood Glucose
- 7.3. Market Analysis, Insights and Forecast - by End User
- 7.3.1. Hospital/Clinics
- 7.3.2. Home/Personal
- 7.1. Market Analysis, Insights and Forecast - by Management Devices
- 8. South America APAC Diabetes Care Devices Industry Analysis, Insights and Forecast, 2020-2032
- 8.1. Market Analysis, Insights and Forecast - by Management Devices
- 8.1.1. Insulin Pump
- 8.1.1.1. Technology
- 8.1.1.1.1. Tethered Insulin Pump
- 8.1.1.1.2. Tubeless Insulin Pump
- 8.1.1.2. Component
- 8.1.1.2.1. Insulin Pump Device
- 8.1.1.2.2. Insulin Pump Reservoir
- 8.1.1.2.3. Infusion Set
- 8.1.1.1. Technology
- 8.1.2. Insulin pens
- 8.1.2.1. Cartridges in Reusable Pens
- 8.1.2.2. Insulin Disposable Pens
- 8.1.3. Insulin Syringes
- 8.1.4. Jet Injectors
- 8.1.1. Insulin Pump
- 8.2. Market Analysis, Insights and Forecast - by Monitoring Devices
- 8.2.1. Self-monitoring Blood Glucose
- 8.2.1.1. Glucometer Devices
- 8.2.1.2. Blood Glucose Test Strips
- 8.2.1.3. Lancets
- 8.2.2. Continuous Glucose Monitoring
- 8.2.2.1. Sensors
- 8.2.2.2. Durables (Receivers and Transmitters)
- 8.2.1. Self-monitoring Blood Glucose
- 8.3. Market Analysis, Insights and Forecast - by End User
- 8.3.1. Hospital/Clinics
- 8.3.2. Home/Personal
- 8.1. Market Analysis, Insights and Forecast - by Management Devices
- 9. Europe APAC Diabetes Care Devices Industry Analysis, Insights and Forecast, 2020-2032
- 9.1. Market Analysis, Insights and Forecast - by Management Devices
- 9.1.1. Insulin Pump
- 9.1.1.1. Technology
- 9.1.1.1.1. Tethered Insulin Pump
- 9.1.1.1.2. Tubeless Insulin Pump
- 9.1.1.2. Component
- 9.1.1.2.1. Insulin Pump Device
- 9.1.1.2.2. Insulin Pump Reservoir
- 9.1.1.2.3. Infusion Set
- 9.1.1.1. Technology
- 9.1.2. Insulin pens
- 9.1.2.1. Cartridges in Reusable Pens
- 9.1.2.2. Insulin Disposable Pens
- 9.1.3. Insulin Syringes
- 9.1.4. Jet Injectors
- 9.1.1. Insulin Pump
- 9.2. Market Analysis, Insights and Forecast - by Monitoring Devices
- 9.2.1. Self-monitoring Blood Glucose
- 9.2.1.1. Glucometer Devices
- 9.2.1.2. Blood Glucose Test Strips
- 9.2.1.3. Lancets
- 9.2.2. Continuous Glucose Monitoring
- 9.2.2.1. Sensors
- 9.2.2.2. Durables (Receivers and Transmitters)
- 9.2.1. Self-monitoring Blood Glucose
- 9.3. Market Analysis, Insights and Forecast - by End User
- 9.3.1. Hospital/Clinics
- 9.3.2. Home/Personal
- 9.1. Market Analysis, Insights and Forecast - by Management Devices
- 10. Middle East & Africa APAC Diabetes Care Devices Industry Analysis, Insights and Forecast, 2020-2032
- 10.1. Market Analysis, Insights and Forecast - by Management Devices
- 10.1.1. Insulin Pump
- 10.1.1.1. Technology
- 10.1.1.1.1. Tethered Insulin Pump
- 10.1.1.1.2. Tubeless Insulin Pump
- 10.1.1.2. Component
- 10.1.1.2.1. Insulin Pump Device
- 10.1.1.2.2. Insulin Pump Reservoir
- 10.1.1.2.3. Infusion Set
- 10.1.1.1. Technology
- 10.1.2. Insulin pens
- 10.1.2.1. Cartridges in Reusable Pens
- 10.1.2.2. Insulin Disposable Pens
- 10.1.3. Insulin Syringes
- 10.1.4. Jet Injectors
- 10.1.1. Insulin Pump
- 10.2. Market Analysis, Insights and Forecast - by Monitoring Devices
- 10.2.1. Self-monitoring Blood Glucose
- 10.2.1.1. Glucometer Devices
- 10.2.1.2. Blood Glucose Test Strips
- 10.2.1.3. Lancets
- 10.2.2. Continuous Glucose Monitoring
- 10.2.2.1. Sensors
- 10.2.2.2. Durables (Receivers and Transmitters)
- 10.2.1. Self-monitoring Blood Glucose
- 10.3. Market Analysis, Insights and Forecast - by End User
- 10.3.1. Hospital/Clinics
- 10.3.2. Home/Personal
- 10.1. Market Analysis, Insights and Forecast - by Management Devices
- 11. Asia Pacific APAC Diabetes Care Devices Industry Analysis, Insights and Forecast, 2020-2032
- 11.1. Market Analysis, Insights and Forecast - by Management Devices
- 11.1.1. Insulin Pump
- 11.1.1.1. Technology
- 11.1.1.1.1. Tethered Insulin Pump
- 11.1.1.1.2. Tubeless Insulin Pump
- 11.1.1.2. Component
- 11.1.1.2.1. Insulin Pump Device
- 11.1.1.2.2. Insulin Pump Reservoir
- 11.1.1.2.3. Infusion Set
- 11.1.1.1. Technology
- 11.1.2. Insulin pens
- 11.1.2.1. Cartridges in Reusable Pens
- 11.1.2.2. Insulin Disposable Pens
- 11.1.3. Insulin Syringes
- 11.1.4. Jet Injectors
- 11.1.1. Insulin Pump
- 11.2. Market Analysis, Insights and Forecast - by Monitoring Devices
- 11.2.1. Self-monitoring Blood Glucose
- 11.2.1.1. Glucometer Devices
- 11.2.1.2. Blood Glucose Test Strips
- 11.2.1.3. Lancets
- 11.2.2. Continuous Glucose Monitoring
- 11.2.2.1. Sensors
- 11.2.2.2. Durables (Receivers and Transmitters)
- 11.2.1. Self-monitoring Blood Glucose
- 11.3. Market Analysis, Insights and Forecast - by End User
- 11.3.1. Hospital/Clinics
- 11.3.2. Home/Personal
- 11.1. Market Analysis, Insights and Forecast - by Management Devices
- 12. Competitive Analysis
- 12.1. Company Profiles
- 12.1.1 Terumo
- 12.1.1.1. Company Overview
- 12.1.1.2. Products
- 12.1.1.3. Company Financials
- 12.1.1.4. SWOT Analysis
- 12.1.2 Dexcom
- 12.1.2.1. Company Overview
- 12.1.2.2. Products
- 12.1.2.3. Company Financials
- 12.1.2.4. SWOT Analysis
- 12.1.3 Insulin Devices
- 12.1.3.1. Company Overview
- 12.1.3.2. Products
- 12.1.3.3. Company Financials
- 12.1.3.4. SWOT Analysis
- 12.1.4 Roche Diabetes Care
- 12.1.4.1. Company Overview
- 12.1.4.2. Products
- 12.1.4.3. Company Financials
- 12.1.4.4. SWOT Analysis
- 12.1.5 Eli Lilly
- 12.1.5.1. Company Overview
- 12.1.5.2. Products
- 12.1.5.3. Company Financials
- 12.1.5.4. SWOT Analysis
- 12.1.6 Sanofi
- 12.1.6.1. Company Overview
- 12.1.6.2. Products
- 12.1.6.3. Company Financials
- 12.1.6.4. SWOT Analysis
- 12.1.7 Abbott Diabetes Care
- 12.1.7.1. Company Overview
- 12.1.7.2. Products
- 12.1.7.3. Company Financials
- 12.1.7.4. SWOT Analysis
- 12.1.8 Medtronic
- 12.1.8.1. Company Overview
- 12.1.8.2. Products
- 12.1.8.3. Company Financials
- 12.1.8.4. SWOT Analysis
- 12.1.9 LifeScan (Johnson & Johnson)
- 12.1.9.1. Company Overview
- 12.1.9.2. Products
- 12.1.9.3. Company Financials
- 12.1.9.4. SWOT Analysis
- 12.1.10 Becton Dickinson
- 12.1.10.1. Company Overview
- 12.1.10.2. Products
- 12.1.10.3. Company Financials
- 12.1.10.4. SWOT Analysis
- 12.1.11 Novo Nordisk A/S
- 12.1.11.1. Company Overview
- 12.1.11.2. Products
- 12.1.11.3. Company Financials
- 12.1.11.4. SWOT Analysis
- 12.1.12 Arkray
- 12.1.12.1. Company Overview
- 12.1.12.2. Products
- 12.1.12.3. Company Financials
- 12.1.12.4. SWOT Analysis
- 12.1.1 Terumo
- 12.2. Market Entropy
- 12.2.1 Company's Key Areas Served
- 12.2.2 Recent Developments
- 12.3. Company Market Share Analysis 2025
- 12.3.1 Top 5 Companies Market Share Analysis
- 12.3.2 Top 3 Companies Market Share Analysis
- 12.4. List of Potential Customers
- 13. Research Methodology
List of Figures
- Figure 1: Global APAC Diabetes Care Devices Industry Revenue Breakdown (Million, %) by Region 2025 & 2033
- Figure 2: Global APAC Diabetes Care Devices Industry Volume Breakdown (K Unit, %) by Region 2025 & 2033
- Figure 3: North America APAC Diabetes Care Devices Industry Revenue (Million), by Management Devices 2025 & 2033
- Figure 4: North America APAC Diabetes Care Devices Industry Volume (K Unit), by Management Devices 2025 & 2033
- Figure 5: North America APAC Diabetes Care Devices Industry Revenue Share (%), by Management Devices 2025 & 2033
- Figure 6: North America APAC Diabetes Care Devices Industry Volume Share (%), by Management Devices 2025 & 2033
- Figure 7: North America APAC Diabetes Care Devices Industry Revenue (Million), by Monitoring Devices 2025 & 2033
- Figure 8: North America APAC Diabetes Care Devices Industry Volume (K Unit), by Monitoring Devices 2025 & 2033
- Figure 9: North America APAC Diabetes Care Devices Industry Revenue Share (%), by Monitoring Devices 2025 & 2033
- Figure 10: North America APAC Diabetes Care Devices Industry Volume Share (%), by Monitoring Devices 2025 & 2033
- Figure 11: North America APAC Diabetes Care Devices Industry Revenue (Million), by End User 2025 & 2033
- Figure 12: North America APAC Diabetes Care Devices Industry Volume (K Unit), by End User 2025 & 2033
- Figure 13: North America APAC Diabetes Care Devices Industry Revenue Share (%), by End User 2025 & 2033
- Figure 14: North America APAC Diabetes Care Devices Industry Volume Share (%), by End User 2025 & 2033
- Figure 15: North America APAC Diabetes Care Devices Industry Revenue (Million), by Country 2025 & 2033
- Figure 16: North America APAC Diabetes Care Devices Industry Volume (K Unit), by Country 2025 & 2033
- Figure 17: North America APAC Diabetes Care Devices Industry Revenue Share (%), by Country 2025 & 2033
- Figure 18: North America APAC Diabetes Care Devices Industry Volume Share (%), by Country 2025 & 2033
- Figure 19: South America APAC Diabetes Care Devices Industry Revenue (Million), by Management Devices 2025 & 2033
- Figure 20: South America APAC Diabetes Care Devices Industry Volume (K Unit), by Management Devices 2025 & 2033
- Figure 21: South America APAC Diabetes Care Devices Industry Revenue Share (%), by Management Devices 2025 & 2033
- Figure 22: South America APAC Diabetes Care Devices Industry Volume Share (%), by Management Devices 2025 & 2033
- Figure 23: South America APAC Diabetes Care Devices Industry Revenue (Million), by Monitoring Devices 2025 & 2033
- Figure 24: South America APAC Diabetes Care Devices Industry Volume (K Unit), by Monitoring Devices 2025 & 2033
- Figure 25: South America APAC Diabetes Care Devices Industry Revenue Share (%), by Monitoring Devices 2025 & 2033
- Figure 26: South America APAC Diabetes Care Devices Industry Volume Share (%), by Monitoring Devices 2025 & 2033
- Figure 27: South America APAC Diabetes Care Devices Industry Revenue (Million), by End User 2025 & 2033
- Figure 28: South America APAC Diabetes Care Devices Industry Volume (K Unit), by End User 2025 & 2033
- Figure 29: South America APAC Diabetes Care Devices Industry Revenue Share (%), by End User 2025 & 2033
- Figure 30: South America APAC Diabetes Care Devices Industry Volume Share (%), by End User 2025 & 2033
- Figure 31: South America APAC Diabetes Care Devices Industry Revenue (Million), by Country 2025 & 2033
- Figure 32: South America APAC Diabetes Care Devices Industry Volume (K Unit), by Country 2025 & 2033
- Figure 33: South America APAC Diabetes Care Devices Industry Revenue Share (%), by Country 2025 & 2033
- Figure 34: South America APAC Diabetes Care Devices Industry Volume Share (%), by Country 2025 & 2033
- Figure 35: Europe APAC Diabetes Care Devices Industry Revenue (Million), by Management Devices 2025 & 2033
- Figure 36: Europe APAC Diabetes Care Devices Industry Volume (K Unit), by Management Devices 2025 & 2033
- Figure 37: Europe APAC Diabetes Care Devices Industry Revenue Share (%), by Management Devices 2025 & 2033
- Figure 38: Europe APAC Diabetes Care Devices Industry Volume Share (%), by Management Devices 2025 & 2033
- Figure 39: Europe APAC Diabetes Care Devices Industry Revenue (Million), by Monitoring Devices 2025 & 2033
- Figure 40: Europe APAC Diabetes Care Devices Industry Volume (K Unit), by Monitoring Devices 2025 & 2033
- Figure 41: Europe APAC Diabetes Care Devices Industry Revenue Share (%), by Monitoring Devices 2025 & 2033
- Figure 42: Europe APAC Diabetes Care Devices Industry Volume Share (%), by Monitoring Devices 2025 & 2033
- Figure 43: Europe APAC Diabetes Care Devices Industry Revenue (Million), by End User 2025 & 2033
- Figure 44: Europe APAC Diabetes Care Devices Industry Volume (K Unit), by End User 2025 & 2033
- Figure 45: Europe APAC Diabetes Care Devices Industry Revenue Share (%), by End User 2025 & 2033
- Figure 46: Europe APAC Diabetes Care Devices Industry Volume Share (%), by End User 2025 & 2033
- Figure 47: Europe APAC Diabetes Care Devices Industry Revenue (Million), by Country 2025 & 2033
- Figure 48: Europe APAC Diabetes Care Devices Industry Volume (K Unit), by Country 2025 & 2033
- Figure 49: Europe APAC Diabetes Care Devices Industry Revenue Share (%), by Country 2025 & 2033
- Figure 50: Europe APAC Diabetes Care Devices Industry Volume Share (%), by Country 2025 & 2033
- Figure 51: Middle East & Africa APAC Diabetes Care Devices Industry Revenue (Million), by Management Devices 2025 & 2033
- Figure 52: Middle East & Africa APAC Diabetes Care Devices Industry Volume (K Unit), by Management Devices 2025 & 2033
- Figure 53: Middle East & Africa APAC Diabetes Care Devices Industry Revenue Share (%), by Management Devices 2025 & 2033
- Figure 54: Middle East & Africa APAC Diabetes Care Devices Industry Volume Share (%), by Management Devices 2025 & 2033
- Figure 55: Middle East & Africa APAC Diabetes Care Devices Industry Revenue (Million), by Monitoring Devices 2025 & 2033
- Figure 56: Middle East & Africa APAC Diabetes Care Devices Industry Volume (K Unit), by Monitoring Devices 2025 & 2033
- Figure 57: Middle East & Africa APAC Diabetes Care Devices Industry Revenue Share (%), by Monitoring Devices 2025 & 2033
- Figure 58: Middle East & Africa APAC Diabetes Care Devices Industry Volume Share (%), by Monitoring Devices 2025 & 2033
- Figure 59: Middle East & Africa APAC Diabetes Care Devices Industry Revenue (Million), by End User 2025 & 2033
- Figure 60: Middle East & Africa APAC Diabetes Care Devices Industry Volume (K Unit), by End User 2025 & 2033
- Figure 61: Middle East & Africa APAC Diabetes Care Devices Industry Revenue Share (%), by End User 2025 & 2033
- Figure 62: Middle East & Africa APAC Diabetes Care Devices Industry Volume Share (%), by End User 2025 & 2033
- Figure 63: Middle East & Africa APAC Diabetes Care Devices Industry Revenue (Million), by Country 2025 & 2033
- Figure 64: Middle East & Africa APAC Diabetes Care Devices Industry Volume (K Unit), by Country 2025 & 2033
- Figure 65: Middle East & Africa APAC Diabetes Care Devices Industry Revenue Share (%), by Country 2025 & 2033
- Figure 66: Middle East & Africa APAC Diabetes Care Devices Industry Volume Share (%), by Country 2025 & 2033
- Figure 67: Asia Pacific APAC Diabetes Care Devices Industry Revenue (Million), by Management Devices 2025 & 2033
- Figure 68: Asia Pacific APAC Diabetes Care Devices Industry Volume (K Unit), by Management Devices 2025 & 2033
- Figure 69: Asia Pacific APAC Diabetes Care Devices Industry Revenue Share (%), by Management Devices 2025 & 2033
- Figure 70: Asia Pacific APAC Diabetes Care Devices Industry Volume Share (%), by Management Devices 2025 & 2033
- Figure 71: Asia Pacific APAC Diabetes Care Devices Industry Revenue (Million), by Monitoring Devices 2025 & 2033
- Figure 72: Asia Pacific APAC Diabetes Care Devices Industry Volume (K Unit), by Monitoring Devices 2025 & 2033
- Figure 73: Asia Pacific APAC Diabetes Care Devices Industry Revenue Share (%), by Monitoring Devices 2025 & 2033
- Figure 74: Asia Pacific APAC Diabetes Care Devices Industry Volume Share (%), by Monitoring Devices 2025 & 2033
- Figure 75: Asia Pacific APAC Diabetes Care Devices Industry Revenue (Million), by End User 2025 & 2033
- Figure 76: Asia Pacific APAC Diabetes Care Devices Industry Volume (K Unit), by End User 2025 & 2033
- Figure 77: Asia Pacific APAC Diabetes Care Devices Industry Revenue Share (%), by End User 2025 & 2033
- Figure 78: Asia Pacific APAC Diabetes Care Devices Industry Volume Share (%), by End User 2025 & 2033
- Figure 79: Asia Pacific APAC Diabetes Care Devices Industry Revenue (Million), by Country 2025 & 2033
- Figure 80: Asia Pacific APAC Diabetes Care Devices Industry Volume (K Unit), by Country 2025 & 2033
- Figure 81: Asia Pacific APAC Diabetes Care Devices Industry Revenue Share (%), by Country 2025 & 2033
- Figure 82: Asia Pacific APAC Diabetes Care Devices Industry Volume Share (%), by Country 2025 & 2033
List of Tables
- Table 1: Global APAC Diabetes Care Devices Industry Revenue Million Forecast, by Management Devices 2020 & 2033
- Table 2: Global APAC Diabetes Care Devices Industry Volume K Unit Forecast, by Management Devices 2020 & 2033
- Table 3: Global APAC Diabetes Care Devices Industry Revenue Million Forecast, by Monitoring Devices 2020 & 2033
- Table 4: Global APAC Diabetes Care Devices Industry Volume K Unit Forecast, by Monitoring Devices 2020 & 2033
- Table 5: Global APAC Diabetes Care Devices Industry Revenue Million Forecast, by End User 2020 & 2033
- Table 6: Global APAC Diabetes Care Devices Industry Volume K Unit Forecast, by End User 2020 & 2033
- Table 7: Global APAC Diabetes Care Devices Industry Revenue Million Forecast, by Region 2020 & 2033
- Table 8: Global APAC Diabetes Care Devices Industry Volume K Unit Forecast, by Region 2020 & 2033
- Table 9: Global APAC Diabetes Care Devices Industry Revenue Million Forecast, by Management Devices 2020 & 2033
- Table 10: Global APAC Diabetes Care Devices Industry Volume K Unit Forecast, by Management Devices 2020 & 2033
- Table 11: Global APAC Diabetes Care Devices Industry Revenue Million Forecast, by Monitoring Devices 2020 & 2033
- Table 12: Global APAC Diabetes Care Devices Industry Volume K Unit Forecast, by Monitoring Devices 2020 & 2033
- Table 13: Global APAC Diabetes Care Devices Industry Revenue Million Forecast, by End User 2020 & 2033
- Table 14: Global APAC Diabetes Care Devices Industry Volume K Unit Forecast, by End User 2020 & 2033
- Table 15: Global APAC Diabetes Care Devices Industry Revenue Million Forecast, by Country 2020 & 2033
- Table 16: Global APAC Diabetes Care Devices Industry Volume K Unit Forecast, by Country 2020 & 2033
- Table 17: United States APAC Diabetes Care Devices Industry Revenue (Million) Forecast, by Application 2020 & 2033
- Table 18: United States APAC Diabetes Care Devices Industry Volume (K Unit) Forecast, by Application 2020 & 2033
- Table 19: Canada APAC Diabetes Care Devices Industry Revenue (Million) Forecast, by Application 2020 & 2033
- Table 20: Canada APAC Diabetes Care Devices Industry Volume (K Unit) Forecast, by Application 2020 & 2033
- Table 21: Mexico APAC Diabetes Care Devices Industry Revenue (Million) Forecast, by Application 2020 & 2033
- Table 22: Mexico APAC Diabetes Care Devices Industry Volume (K Unit) Forecast, by Application 2020 & 2033
- Table 23: Global APAC Diabetes Care Devices Industry Revenue Million Forecast, by Management Devices 2020 & 2033
- Table 24: Global APAC Diabetes Care Devices Industry Volume K Unit Forecast, by Management Devices 2020 & 2033
- Table 25: Global APAC Diabetes Care Devices Industry Revenue Million Forecast, by Monitoring Devices 2020 & 2033
- Table 26: Global APAC Diabetes Care Devices Industry Volume K Unit Forecast, by Monitoring Devices 2020 & 2033
- Table 27: Global APAC Diabetes Care Devices Industry Revenue Million Forecast, by End User 2020 & 2033
- Table 28: Global APAC Diabetes Care Devices Industry Volume K Unit Forecast, by End User 2020 & 2033
- Table 29: Global APAC Diabetes Care Devices Industry Revenue Million Forecast, by Country 2020 & 2033
- Table 30: Global APAC Diabetes Care Devices Industry Volume K Unit Forecast, by Country 2020 & 2033
- Table 31: Brazil APAC Diabetes Care Devices Industry Revenue (Million) Forecast, by Application 2020 & 2033
- Table 32: Brazil APAC Diabetes Care Devices Industry Volume (K Unit) Forecast, by Application 2020 & 2033
- Table 33: Argentina APAC Diabetes Care Devices Industry Revenue (Million) Forecast, by Application 2020 & 2033
- Table 34: Argentina APAC Diabetes Care Devices Industry Volume (K Unit) Forecast, by Application 2020 & 2033
- Table 35: Rest of South America APAC Diabetes Care Devices Industry Revenue (Million) Forecast, by Application 2020 & 2033
- Table 36: Rest of South America APAC Diabetes Care Devices Industry Volume (K Unit) Forecast, by Application 2020 & 2033
- Table 37: Global APAC Diabetes Care Devices Industry Revenue Million Forecast, by Management Devices 2020 & 2033
- Table 38: Global APAC Diabetes Care Devices Industry Volume K Unit Forecast, by Management Devices 2020 & 2033
- Table 39: Global APAC Diabetes Care Devices Industry Revenue Million Forecast, by Monitoring Devices 2020 & 2033
- Table 40: Global APAC Diabetes Care Devices Industry Volume K Unit Forecast, by Monitoring Devices 2020 & 2033
- Table 41: Global APAC Diabetes Care Devices Industry Revenue Million Forecast, by End User 2020 & 2033
- Table 42: Global APAC Diabetes Care Devices Industry Volume K Unit Forecast, by End User 2020 & 2033
- Table 43: Global APAC Diabetes Care Devices Industry Revenue Million Forecast, by Country 2020 & 2033
- Table 44: Global APAC Diabetes Care Devices Industry Volume K Unit Forecast, by Country 2020 & 2033
- Table 45: United Kingdom APAC Diabetes Care Devices Industry Revenue (Million) Forecast, by Application 2020 & 2033
- Table 46: United Kingdom APAC Diabetes Care Devices Industry Volume (K Unit) Forecast, by Application 2020 & 2033
- Table 47: Germany APAC Diabetes Care Devices Industry Revenue (Million) Forecast, by Application 2020 & 2033
- Table 48: Germany APAC Diabetes Care Devices Industry Volume (K Unit) Forecast, by Application 2020 & 2033
- Table 49: France APAC Diabetes Care Devices Industry Revenue (Million) Forecast, by Application 2020 & 2033
- Table 50: France APAC Diabetes Care Devices Industry Volume (K Unit) Forecast, by Application 2020 & 2033
- Table 51: Italy APAC Diabetes Care Devices Industry Revenue (Million) Forecast, by Application 2020 & 2033
- Table 52: Italy APAC Diabetes Care Devices Industry Volume (K Unit) Forecast, by Application 2020 & 2033
- Table 53: Spain APAC Diabetes Care Devices Industry Revenue (Million) Forecast, by Application 2020 & 2033
- Table 54: Spain APAC Diabetes Care Devices Industry Volume (K Unit) Forecast, by Application 2020 & 2033
- Table 55: Russia APAC Diabetes Care Devices Industry Revenue (Million) Forecast, by Application 2020 & 2033
- Table 56: Russia APAC Diabetes Care Devices Industry Volume (K Unit) Forecast, by Application 2020 & 2033
- Table 57: Benelux APAC Diabetes Care Devices Industry Revenue (Million) Forecast, by Application 2020 & 2033
- Table 58: Benelux APAC Diabetes Care Devices Industry Volume (K Unit) Forecast, by Application 2020 & 2033
- Table 59: Nordics APAC Diabetes Care Devices Industry Revenue (Million) Forecast, by Application 2020 & 2033
- Table 60: Nordics APAC Diabetes Care Devices Industry Volume (K Unit) Forecast, by Application 2020 & 2033
- Table 61: Rest of Europe APAC Diabetes Care Devices Industry Revenue (Million) Forecast, by Application 2020 & 2033
- Table 62: Rest of Europe APAC Diabetes Care Devices Industry Volume (K Unit) Forecast, by Application 2020 & 2033
- Table 63: Global APAC Diabetes Care Devices Industry Revenue Million Forecast, by Management Devices 2020 & 2033
- Table 64: Global APAC Diabetes Care Devices Industry Volume K Unit Forecast, by Management Devices 2020 & 2033
- Table 65: Global APAC Diabetes Care Devices Industry Revenue Million Forecast, by Monitoring Devices 2020 & 2033
- Table 66: Global APAC Diabetes Care Devices Industry Volume K Unit Forecast, by Monitoring Devices 2020 & 2033
- Table 67: Global APAC Diabetes Care Devices Industry Revenue Million Forecast, by End User 2020 & 2033
- Table 68: Global APAC Diabetes Care Devices Industry Volume K Unit Forecast, by End User 2020 & 2033
- Table 69: Global APAC Diabetes Care Devices Industry Revenue Million Forecast, by Country 2020 & 2033
- Table 70: Global APAC Diabetes Care Devices Industry Volume K Unit Forecast, by Country 2020 & 2033
- Table 71: Turkey APAC Diabetes Care Devices Industry Revenue (Million) Forecast, by Application 2020 & 2033
- Table 72: Turkey APAC Diabetes Care Devices Industry Volume (K Unit) Forecast, by Application 2020 & 2033
- Table 73: Israel APAC Diabetes Care Devices Industry Revenue (Million) Forecast, by Application 2020 & 2033
- Table 74: Israel APAC Diabetes Care Devices Industry Volume (K Unit) Forecast, by Application 2020 & 2033
- Table 75: GCC APAC Diabetes Care Devices Industry Revenue (Million) Forecast, by Application 2020 & 2033
- Table 76: GCC APAC Diabetes Care Devices Industry Volume (K Unit) Forecast, by Application 2020 & 2033
- Table 77: North Africa APAC Diabetes Care Devices Industry Revenue (Million) Forecast, by Application 2020 & 2033
- Table 78: North Africa APAC Diabetes Care Devices Industry Volume (K Unit) Forecast, by Application 2020 & 2033
- Table 79: South Africa APAC Diabetes Care Devices Industry Revenue (Million) Forecast, by Application 2020 & 2033
- Table 80: South Africa APAC Diabetes Care Devices Industry Volume (K Unit) Forecast, by Application 2020 & 2033
- Table 81: Rest of Middle East & Africa APAC Diabetes Care Devices Industry Revenue (Million) Forecast, by Application 2020 & 2033
- Table 82: Rest of Middle East & Africa APAC Diabetes Care Devices Industry Volume (K Unit) Forecast, by Application 2020 & 2033
- Table 83: Global APAC Diabetes Care Devices Industry Revenue Million Forecast, by Management Devices 2020 & 2033
- Table 84: Global APAC Diabetes Care Devices Industry Volume K Unit Forecast, by Management Devices 2020 & 2033
- Table 85: Global APAC Diabetes Care Devices Industry Revenue Million Forecast, by Monitoring Devices 2020 & 2033
- Table 86: Global APAC Diabetes Care Devices Industry Volume K Unit Forecast, by Monitoring Devices 2020 & 2033
- Table 87: Global APAC Diabetes Care Devices Industry Revenue Million Forecast, by End User 2020 & 2033
- Table 88: Global APAC Diabetes Care Devices Industry Volume K Unit Forecast, by End User 2020 & 2033
- Table 89: Global APAC Diabetes Care Devices Industry Revenue Million Forecast, by Country 2020 & 2033
- Table 90: Global APAC Diabetes Care Devices Industry Volume K Unit Forecast, by Country 2020 & 2033
- Table 91: China APAC Diabetes Care Devices Industry Revenue (Million) Forecast, by Application 2020 & 2033
- Table 92: China APAC Diabetes Care Devices Industry Volume (K Unit) Forecast, by Application 2020 & 2033
- Table 93: India APAC Diabetes Care Devices Industry Revenue (Million) Forecast, by Application 2020 & 2033
- Table 94: India APAC Diabetes Care Devices Industry Volume (K Unit) Forecast, by Application 2020 & 2033
- Table 95: Japan APAC Diabetes Care Devices Industry Revenue (Million) Forecast, by Application 2020 & 2033
- Table 96: Japan APAC Diabetes Care Devices Industry Volume (K Unit) Forecast, by Application 2020 & 2033
- Table 97: South Korea APAC Diabetes Care Devices Industry Revenue (Million) Forecast, by Application 2020 & 2033
- Table 98: South Korea APAC Diabetes Care Devices Industry Volume (K Unit) Forecast, by Application 2020 & 2033
- Table 99: ASEAN APAC Diabetes Care Devices Industry Revenue (Million) Forecast, by Application 2020 & 2033
- Table 100: ASEAN APAC Diabetes Care Devices Industry Volume (K Unit) Forecast, by Application 2020 & 2033
- Table 101: Oceania APAC Diabetes Care Devices Industry Revenue (Million) Forecast, by Application 2020 & 2033
- Table 102: Oceania APAC Diabetes Care Devices Industry Volume (K Unit) Forecast, by Application 2020 & 2033
- Table 103: Rest of Asia Pacific APAC Diabetes Care Devices Industry Revenue (Million) Forecast, by Application 2020 & 2033
- Table 104: Rest of Asia Pacific APAC Diabetes Care Devices Industry Volume (K Unit) Forecast, by Application 2020 & 2033
Frequently Asked Questions
1. What is the projected Compound Annual Growth Rate (CAGR) of the APAC Diabetes Care Devices Industry?
The projected CAGR is approximately 3.50%.
2. Which companies are prominent players in the APAC Diabetes Care Devices Industry?
Key companies in the market include Terumo, Dexcom, Insulin Devices, Roche Diabetes Care, Eli Lilly, Sanofi, Abbott Diabetes Care, Medtronic, LifeScan (Johnson & Johnson), Becton Dickinson, Novo Nordisk A/S, Arkray.
3. What are the main segments of the APAC Diabetes Care Devices Industry?
The market segments include Management Devices, Monitoring Devices, End User.
4. Can you provide details about the market size?
The market size is estimated to be USD 22.77 Million as of 2022.
5. What are some drivers contributing to market growth?
Rising Prevalence of Cancer Worldwide; Technological Advancements in Diagnostic Testing; Increasing Demand for Point-of-care Treatment.
6. What are the notable trends driving market growth?
The continuous glucose monitoring segment is expected to witness a healthy growth rate over the forecast period.
7. Are there any restraints impacting market growth?
High Cost of Molecular Diagnostic Tests; Lack of Skilled Workforce and Stringent Regulatory Framework.
8. Can you provide examples of recent developments in the market?
November 2023: Sibionics, a Chinese company, has recently received a CE Mark for its GS1 continuous glucose monitoring system (CGM). This innovative wearable device utilizes an under-the-skin sensor to accurately measure glucose levels in real-time. The collected data is then seamlessly transmitted to a connected handset or mobile phone. The GS1 CGM provides users with a remarkable 14-day continuous glucose monitoring experience, eliminating the need for frequent calibration. Additionally, it empowers users to effortlessly transmit their glucose data to monitoring devices or mobile apps, enabling them to generate comprehensive and insightful professional reports.
9. What pricing options are available for accessing the report?
Pricing options include single-user, multi-user, and enterprise licenses priced at USD 4750, USD 5250, and USD 8750 respectively.
10. Is the market size provided in terms of value or volume?
The market size is provided in terms of value, measured in Million and volume, measured in K Unit.
11. Are there any specific market keywords associated with the report?
Yes, the market keyword associated with the report is "APAC Diabetes Care Devices Industry," which aids in identifying and referencing the specific market segment covered.
12. How do I determine which pricing option suits my needs best?
The pricing options vary based on user requirements and access needs. Individual users may opt for single-user licenses, while businesses requiring broader access may choose multi-user or enterprise licenses for cost-effective access to the report.
13. Are there any additional resources or data provided in the APAC Diabetes Care Devices Industry report?
While the report offers comprehensive insights, it's advisable to review the specific contents or supplementary materials provided to ascertain if additional resources or data are available.
14. How can I stay updated on further developments or reports in the APAC Diabetes Care Devices Industry?
To stay informed about further developments, trends, and reports in the APAC Diabetes Care Devices Industry, consider subscribing to industry newsletters, following relevant companies and organizations, or regularly checking reputable industry news sources and publications.
Methodology
Step 1 - Identification of Relevant Samples Size from Population Database


Step 2 - Approaches for Defining Global Market Size (Value, Volume* & Price*)

Note*: In applicable scenarios
Step 3 - Data Sources
Primary Research
- Web Analytics
- Survey Reports
- Research Institute
- Latest Research Reports
- Opinion Leaders
Secondary Research
- Annual Reports
- White Paper
- Latest Press Release
- Industry Association
- Paid Database
- Investor Presentations

Step 4 - Data Triangulation
Involves using different sources of information in order to increase the validity of a study
These sources are likely to be stakeholders in a program - participants, other researchers, program staff, other community members, and so on.
Then we put all data in single framework & apply various statistical tools to find out the dynamic on the market.
During the analysis stage, feedback from the stakeholder groups would be compared to determine areas of agreement as well as areas of divergence