Key Insights
The Asia-Pacific (APAC) diesel generator market is poised for significant expansion, driven by rapid urbanization, industrial growth, and escalating electricity demands across key sectors. The region's robust economic development, particularly in China, India, and Southeast Asia, necessitates consistent and reliable backup power solutions. This demand is further amplified by infrastructure needs and the imperative for uninterrupted power in critical facilities such as healthcare and data centers. The market is segmented by capacity (below 75 kVA, 75-350 kVA, above 350 kVA), end-user (residential, commercial, industrial), and application (standby, prime/continuous, peak shaving). While the residential sector is a substantial contributor, the industrial segment is projected to exhibit the fastest growth due to large-scale projects and infrastructure development. Leading market players, including Kohler, Doosan, Mahindra Powerol, Caterpillar, and Cummins, are actively expanding their regional presence and product offerings. Technological advancements, such as emission control and fuel efficiency improvements, are also key market influencers. However, stringent environmental regulations and fluctuating fuel costs present challenges. The market is projected to achieve a CAGR of 8.1% from a market size of 39.3 billion in the base year 2025, indicating sustained growth fueled by accelerating infrastructure and industrial activity in emerging economies.
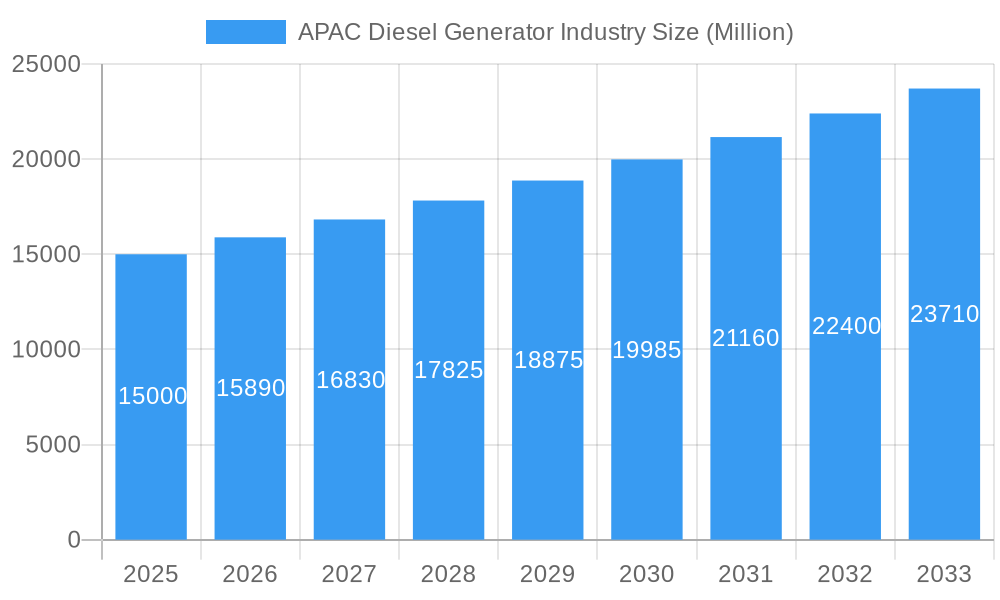
APAC Diesel Generator Industry Market Size (In Billion)
The future trajectory of the APAC diesel generator market is shaped by several factors. While government initiatives supporting renewable energy may present some constraints, the persistent need for reliable backup power amidst potential grid instability and fluctuating renewable energy output will continue to drive demand. Further growth is anticipated from the expansion of telecommunication networks, data centers, and smart city development, all requiring continuous and robust power supplies. The market will likely see intensified competition among manufacturers focused on innovative solutions that enhance efficiency, reduce emissions, and cater to diverse end-user needs. A strategic focus on customized solutions for specific applications and energy requirements will foster industry partnerships and collaborations, leading to the development of more efficient and environmentally conscious diesel generator solutions.
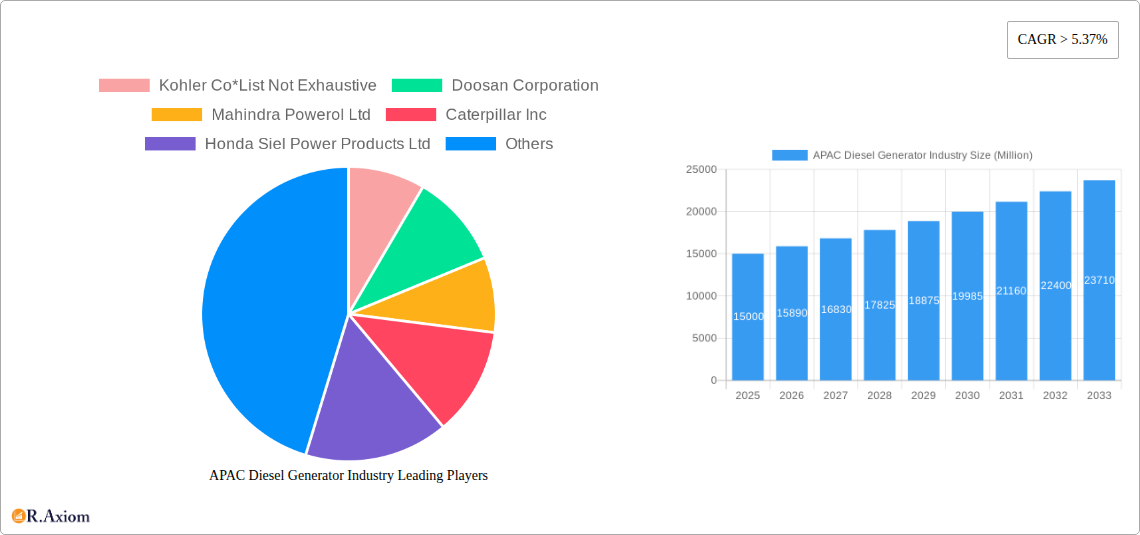
APAC Diesel Generator Industry Company Market Share
APAC Diesel Generator Industry: A Comprehensive Market Report (2019-2033)
This in-depth report provides a comprehensive analysis of the Asia-Pacific (APAC) diesel generator industry, covering market size, growth trends, competitive landscape, and future outlook from 2019 to 2033. The study incorporates detailed segmentation by capacity (Below 75 kVA, 75-350 kVA, Above 350 kVA), end-user (Residential, Commercial, Industrial), and application (Standby Backup Power, Prime/Continuous Power, Peak Shaving Power). The report leverages extensive primary and secondary research, including interviews with industry experts, company financials, and government data, to provide actionable insights for stakeholders. The base year for this analysis is 2025, with a forecast period extending to 2033 and a historical period covering 2019-2024. Market values are expressed in Millions.
APAC Diesel Generator Industry Market Concentration & Innovation
The APAC diesel generator market exhibits a moderately concentrated structure, with several multinational corporations holding significant market share. Leading players include Kohler Co, Doosan Corporation, Mahindra Powerol Ltd, Caterpillar Inc, Honda Siel Power Products Ltd, Cummins Inc, Mitsubishi Heavy Industries Engine & Turbocharger Ltd, Yanmar Holdings co Ltd, and Generac Power Systems. However, a large number of smaller regional players also contribute significantly, particularly in rapidly developing economies. Market share data for 2024 suggests that the top five players account for approximately xx% of the total market revenue, while smaller players control the remaining share.
Innovation in the sector is driven by increasing demand for fuel-efficient, environmentally friendly, and technologically advanced gensets. Stringent emission regulations in various APAC countries are prompting manufacturers to invest in cleaner technologies. Moreover, the rising adoption of smart technologies, such as remote monitoring and control systems, is enhancing the efficiency and reliability of diesel generators. Mergers and acquisitions (M&A) activity in this sector has been moderate over the past few years, with deal values averaging approximately $xx Million annually, driven primarily by companies seeking to expand their market reach and product portfolios.
- Key Market Concentration Metrics: Top 5 players hold xx% market share (2024).
- Innovation Drivers: Emission regulations, demand for fuel efficiency, smart technologies.
- M&A Activity: Average annual deal value approximately $xx Million (2019-2024).
APAC Diesel Generator Industry Industry Trends & Insights
The APAC diesel generator market is experiencing robust growth, driven by the rapid expansion of infrastructure, urbanization, and industrialization across the region. The increasing demand for reliable power backup solutions, particularly in regions with unstable grid infrastructure, is further propelling market expansion. Technological advancements, such as the development of more efficient and environmentally friendly engines, are contributing to market growth. The market exhibits a Compound Annual Growth Rate (CAGR) of xx% during the historical period (2019-2024) and is projected to continue growing at a CAGR of xx% during the forecast period (2025-2033). Market penetration in key segments, such as the industrial sector, is expected to increase significantly due to the growing demand for uninterrupted power supply in manufacturing and data centers. Competitive dynamics are characterized by intense price competition, particularly in the lower-capacity segments, and a focus on product differentiation through technological innovation and enhanced customer service.
Dominant Markets & Segments in APAC Diesel Generator Industry
Within the APAC region, China, India, and other Southeast Asian nations represent the most dominant markets. The industrial sector consistently dominates end-user segments due to the high demand for reliable power in manufacturing, construction, and other industrial activities. In terms of capacity, the 75-350 kVA segment holds the largest market share, driven by the significant demand from commercial and industrial applications.
Key Drivers for Dominant Markets: Rapid economic growth, urbanization, industrialization.
Key Drivers for Dominant Segments: Demand from commercial and industrial facilities, reliable power requirements.
China: Strong industrial growth, extensive infrastructure projects drive significant demand across all capacity segments.
India: Rapid urbanization, rising power demands, and increasing industrial activity fuel substantial growth.
Southeast Asia: Expanding economies, infrastructure development, and rising energy consumption contribute to market expansion.
75-350 kVA Segment: Caters to a large segment of commercial and industrial end-users.
Industrial End-User: High dependency on reliable power supply fuels consistent growth.
APAP Diesel Generator Industry Product Developments
Recent product innovations focus on enhancing fuel efficiency, reducing emissions, and improving operational reliability. Manufacturers are incorporating advanced technologies, such as electronic control systems and smart monitoring capabilities, into their diesel generators to meet the evolving needs of consumers. The introduction of quieter gensets and improved after-sales services are further enhancing market competitiveness. These advancements cater to the growing demand for environmentally friendly and user-friendly diesel generator solutions.
Report Scope & Segmentation Analysis
This report segments the APAC diesel generator market based on capacity (Below 75 kVA, 75-350 kVA, Above 350 kVA), end-user (Residential, Commercial, Industrial), and application (Standby Backup Power, Prime/Continuous Power, Peak Shaving Power). Each segment is analyzed in detail, providing growth projections, market size estimates, and competitive dynamics. The 75-350 kVA segment is projected to witness the highest growth due to increasing industrial and commercial demands. The industrial end-user segment is expected to continue its dominance, driven by the need for reliable power in manufacturing facilities.
Key Drivers of APAC Diesel Generator Industry Growth
Several factors drive the growth of the APAC diesel generator market. These include rapid economic expansion in many APAC countries, leading to increased industrial activity and infrastructure development. The expanding urbanization and rising population are creating higher electricity demands, while unreliable power grids in some regions increase the need for backup power solutions. Government initiatives aimed at improving power infrastructure also play a significant role.
Challenges in the APAC Diesel Generator Industry Sector
The APAC diesel generator industry faces several challenges. Stringent emission regulations necessitate investments in cleaner technologies, potentially increasing production costs. Fluctuations in fuel prices can negatively impact profitability. The industry also encounters intense competition from renewable energy sources and faces supply chain disruptions impacting the availability of components. The cumulative impact of these challenges estimates to reduce overall market growth by approximately xx% by 2033.
Emerging Opportunities in APAC Diesel Generator Industry
Emerging opportunities lie in the growing demand for hybrid power systems combining diesel generators with renewable energy sources. The increasing adoption of smart technologies, including remote monitoring and predictive maintenance, also presents growth opportunities. Expanding into underserved rural markets and catering to the rising demand for smaller, more efficient gensets offer significant potential for market expansion.
Leading Players in the APAC Diesel Generator Industry Market
- Kohler Co
- Doosan Corporation
- Mahindra Powerol Ltd
- Caterpillar Inc
- Honda Siel Power Products Ltd
- Cummins Inc
- Mitsubishi Heavy Industries Engine & Turbocharger Ltd
- Yanmar Holdings co Ltd
- Generac Power Systems
Key Developments in APAC Diesel Generator Industry Industry
- June 2022: Kirloskar Group launched Kirloskar iGreen Version 2.0, featuring fuel-efficient gensets powered by the R550 series engines. This launch significantly impacts the market by offering a competitive, environmentally conscious product.
Strategic Outlook for APAC Diesel Generator Industry Market
The APAC diesel generator market is poised for continued growth, driven by sustained economic expansion, infrastructure development, and the ongoing need for reliable backup power solutions. The strategic focus should be on technological innovation, particularly in areas such as fuel efficiency and emission reduction, to meet evolving regulatory requirements. Expanding into new markets and developing innovative business models will be crucial for success in this dynamic and competitive industry.
APAC Diesel Generator Industry Segmentation
-
1. Capacity
- 1.1. Below 75 kVA
- 1.2. 75-350 kVA
- 1.3. Above 350 kVA
-
2. End-User
- 2.1. Residential
- 2.2. Commercial
- 2.3. Industrial
-
3. Application
- 3.1. Standby Backup Power
- 3.2. Prime/Continuous Power
- 3.3. Peak Shaving Power
-
4. Geography
- 4.1. China
- 4.2. India
- 4.3. Japan
- 4.4. South Korea
- 4.5. Rest of Asia-Pacific
APAC Diesel Generator Industry Segmentation By Geography
- 1. China
- 2. India
- 3. Japan
- 4. South Korea
- 5. Rest of Asia Pacific
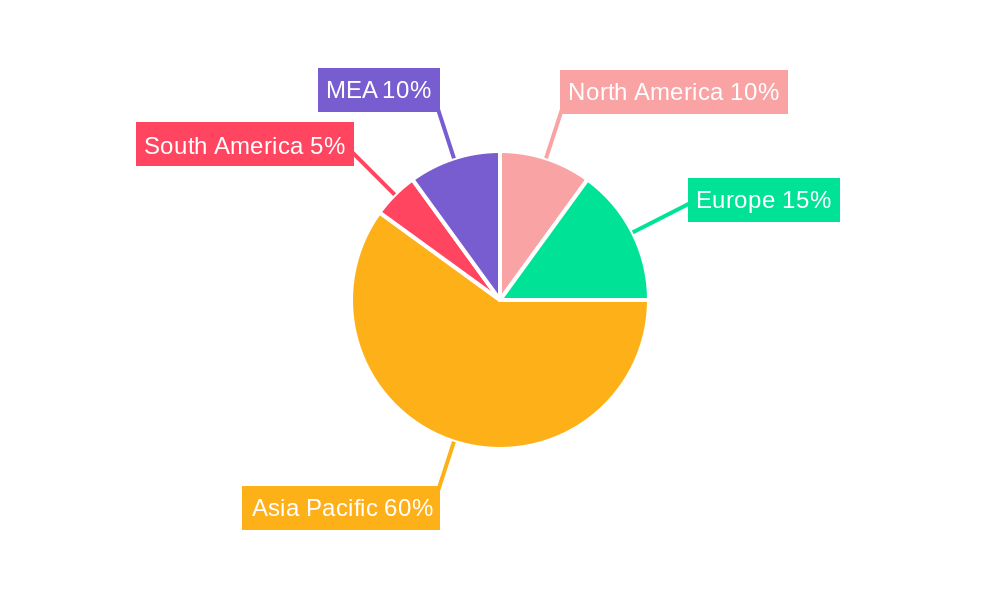
APAC Diesel Generator Industry Regional Market Share
Geographic Coverage of APAC Diesel Generator Industry
APAC Diesel Generator Industry REPORT HIGHLIGHTS
| Aspects | Details |
|---|---|
| Study Period | 2020-2034 |
| Base Year | 2025 |
| Estimated Year | 2026 |
| Forecast Period | 2026-2034 |
| Historical Period | 2020-2025 |
| Growth Rate | CAGR of 8.1% from 2020-2034 |
| Segmentation |
|
Table of Contents
- 1. Introduction
- 1.1. Research Scope
- 1.2. Market Segmentation
- 1.3. Research Objective
- 1.4. Definitions and Assumptions
- 2. Executive Summary
- 2.1. Market Snapshot
- 3. Market Dynamics
- 3.1. Market Drivers
- 3.2. Market Restrains
- 3.3. Market Trends
- 3.4. Market Opportunities
- 4. Market Factor Analysis
- 4.1. Porters Five Forces
- 4.1.1. Bargaining Power of Suppliers
- 4.1.2. Bargaining Power of Buyers
- 4.1.3. Threat of New Entrants
- 4.1.4. Threat of Substitutes
- 4.1.5. Competitive Rivalry
- 4.2. PESTEL analysis
- 4.3. BCG Analysis
- 4.3.1. Stars (High Growth, High Market Share)
- 4.3.2. Cash Cows (Low Growth, High Market Share)
- 4.3.3. Question Mark (High Growth, Low Market Share)
- 4.3.4. Dogs (Low Growth, Low Market Share)
- 4.4. Ansoff Matrix Analysis
- 4.5. Supply Chain Analysis
- 4.6. Regulatory Landscape
- 4.7. Current Market Potential and Opportunity Assessment (TAM–SAM–SOM Framework)
- 4.8. RAX Analyst Note
- 4.1. Porters Five Forces
- 5. Market Analysis, Insights and Forecast 2021-2033
- 5.1. Market Analysis, Insights and Forecast - by Capacity
- 5.1.1. Below 75 kVA
- 5.1.2. 75-350 kVA
- 5.1.3. Above 350 kVA
- 5.2. Market Analysis, Insights and Forecast - by End-User
- 5.2.1. Residential
- 5.2.2. Commercial
- 5.2.3. Industrial
- 5.3. Market Analysis, Insights and Forecast - by Application
- 5.3.1. Standby Backup Power
- 5.3.2. Prime/Continuous Power
- 5.3.3. Peak Shaving Power
- 5.4. Market Analysis, Insights and Forecast - by Geography
- 5.4.1. China
- 5.4.2. India
- 5.4.3. Japan
- 5.4.4. South Korea
- 5.4.5. Rest of Asia-Pacific
- 5.5. Market Analysis, Insights and Forecast - by Region
- 5.5.1. China
- 5.5.2. India
- 5.5.3. Japan
- 5.5.4. South Korea
- 5.5.5. Rest of Asia Pacific
- 5.1. Market Analysis, Insights and Forecast - by Capacity
- 6. Global APAC Diesel Generator Industry Analysis, Insights and Forecast, 2021-2033
- 6.1. Market Analysis, Insights and Forecast - by Capacity
- 6.1.1. Below 75 kVA
- 6.1.2. 75-350 kVA
- 6.1.3. Above 350 kVA
- 6.2. Market Analysis, Insights and Forecast - by End-User
- 6.2.1. Residential
- 6.2.2. Commercial
- 6.2.3. Industrial
- 6.3. Market Analysis, Insights and Forecast - by Application
- 6.3.1. Standby Backup Power
- 6.3.2. Prime/Continuous Power
- 6.3.3. Peak Shaving Power
- 6.4. Market Analysis, Insights and Forecast - by Geography
- 6.4.1. China
- 6.4.2. India
- 6.4.3. Japan
- 6.4.4. South Korea
- 6.4.5. Rest of Asia-Pacific
- 6.1. Market Analysis, Insights and Forecast - by Capacity
- 7. China APAC Diesel Generator Industry Analysis, Insights and Forecast, 2020-2032
- 7.1. Market Analysis, Insights and Forecast - by Capacity
- 7.1.1. Below 75 kVA
- 7.1.2. 75-350 kVA
- 7.1.3. Above 350 kVA
- 7.2. Market Analysis, Insights and Forecast - by End-User
- 7.2.1. Residential
- 7.2.2. Commercial
- 7.2.3. Industrial
- 7.3. Market Analysis, Insights and Forecast - by Application
- 7.3.1. Standby Backup Power
- 7.3.2. Prime/Continuous Power
- 7.3.3. Peak Shaving Power
- 7.4. Market Analysis, Insights and Forecast - by Geography
- 7.4.1. China
- 7.4.2. India
- 7.4.3. Japan
- 7.4.4. South Korea
- 7.4.5. Rest of Asia-Pacific
- 7.1. Market Analysis, Insights and Forecast - by Capacity
- 8. India APAC Diesel Generator Industry Analysis, Insights and Forecast, 2020-2032
- 8.1. Market Analysis, Insights and Forecast - by Capacity
- 8.1.1. Below 75 kVA
- 8.1.2. 75-350 kVA
- 8.1.3. Above 350 kVA
- 8.2. Market Analysis, Insights and Forecast - by End-User
- 8.2.1. Residential
- 8.2.2. Commercial
- 8.2.3. Industrial
- 8.3. Market Analysis, Insights and Forecast - by Application
- 8.3.1. Standby Backup Power
- 8.3.2. Prime/Continuous Power
- 8.3.3. Peak Shaving Power
- 8.4. Market Analysis, Insights and Forecast - by Geography
- 8.4.1. China
- 8.4.2. India
- 8.4.3. Japan
- 8.4.4. South Korea
- 8.4.5. Rest of Asia-Pacific
- 8.1. Market Analysis, Insights and Forecast - by Capacity
- 9. Japan APAC Diesel Generator Industry Analysis, Insights and Forecast, 2020-2032
- 9.1. Market Analysis, Insights and Forecast - by Capacity
- 9.1.1. Below 75 kVA
- 9.1.2. 75-350 kVA
- 9.1.3. Above 350 kVA
- 9.2. Market Analysis, Insights and Forecast - by End-User
- 9.2.1. Residential
- 9.2.2. Commercial
- 9.2.3. Industrial
- 9.3. Market Analysis, Insights and Forecast - by Application
- 9.3.1. Standby Backup Power
- 9.3.2. Prime/Continuous Power
- 9.3.3. Peak Shaving Power
- 9.4. Market Analysis, Insights and Forecast - by Geography
- 9.4.1. China
- 9.4.2. India
- 9.4.3. Japan
- 9.4.4. South Korea
- 9.4.5. Rest of Asia-Pacific
- 9.1. Market Analysis, Insights and Forecast - by Capacity
- 10. South Korea APAC Diesel Generator Industry Analysis, Insights and Forecast, 2020-2032
- 10.1. Market Analysis, Insights and Forecast - by Capacity
- 10.1.1. Below 75 kVA
- 10.1.2. 75-350 kVA
- 10.1.3. Above 350 kVA
- 10.2. Market Analysis, Insights and Forecast - by End-User
- 10.2.1. Residential
- 10.2.2. Commercial
- 10.2.3. Industrial
- 10.3. Market Analysis, Insights and Forecast - by Application
- 10.3.1. Standby Backup Power
- 10.3.2. Prime/Continuous Power
- 10.3.3. Peak Shaving Power
- 10.4. Market Analysis, Insights and Forecast - by Geography
- 10.4.1. China
- 10.4.2. India
- 10.4.3. Japan
- 10.4.4. South Korea
- 10.4.5. Rest of Asia-Pacific
- 10.1. Market Analysis, Insights and Forecast - by Capacity
- 11. Rest of Asia Pacific APAC Diesel Generator Industry Analysis, Insights and Forecast, 2020-2032
- 11.1. Market Analysis, Insights and Forecast - by Capacity
- 11.1.1. Below 75 kVA
- 11.1.2. 75-350 kVA
- 11.1.3. Above 350 kVA
- 11.2. Market Analysis, Insights and Forecast - by End-User
- 11.2.1. Residential
- 11.2.2. Commercial
- 11.2.3. Industrial
- 11.3. Market Analysis, Insights and Forecast - by Application
- 11.3.1. Standby Backup Power
- 11.3.2. Prime/Continuous Power
- 11.3.3. Peak Shaving Power
- 11.4. Market Analysis, Insights and Forecast - by Geography
- 11.4.1. China
- 11.4.2. India
- 11.4.3. Japan
- 11.4.4. South Korea
- 11.4.5. Rest of Asia-Pacific
- 11.1. Market Analysis, Insights and Forecast - by Capacity
- 12. Competitive Analysis
- 12.1. Company Profiles
- 12.1.1 Kohler Co*List Not Exhaustive
- 12.1.1.1. Company Overview
- 12.1.1.2. Products
- 12.1.1.3. Company Financials
- 12.1.1.4. SWOT Analysis
- 12.1.2 Doosan Corporation
- 12.1.2.1. Company Overview
- 12.1.2.2. Products
- 12.1.2.3. Company Financials
- 12.1.2.4. SWOT Analysis
- 12.1.3 Mahindra Powerol Ltd
- 12.1.3.1. Company Overview
- 12.1.3.2. Products
- 12.1.3.3. Company Financials
- 12.1.3.4. SWOT Analysis
- 12.1.4 Caterpillar Inc
- 12.1.4.1. Company Overview
- 12.1.4.2. Products
- 12.1.4.3. Company Financials
- 12.1.4.4. SWOT Analysis
- 12.1.5 Honda Siel Power Products Ltd
- 12.1.5.1. Company Overview
- 12.1.5.2. Products
- 12.1.5.3. Company Financials
- 12.1.5.4. SWOT Analysis
- 12.1.6 Cummins Inc
- 12.1.6.1. Company Overview
- 12.1.6.2. Products
- 12.1.6.3. Company Financials
- 12.1.6.4. SWOT Analysis
- 12.1.7 Mitsubishi Heavy Industries Engine & Turbocharger Ltd
- 12.1.7.1. Company Overview
- 12.1.7.2. Products
- 12.1.7.3. Company Financials
- 12.1.7.4. SWOT Analysis
- 12.1.8 Yanmar Holdings co Ltd
- 12.1.8.1. Company Overview
- 12.1.8.2. Products
- 12.1.8.3. Company Financials
- 12.1.8.4. SWOT Analysis
- 12.1.9 Generac Power Systems
- 12.1.9.1. Company Overview
- 12.1.9.2. Products
- 12.1.9.3. Company Financials
- 12.1.9.4. SWOT Analysis
- 12.1.1 Kohler Co*List Not Exhaustive
- 12.2. Market Entropy
- 12.2.1 Company's Key Areas Served
- 12.2.2 Recent Developments
- 12.3. Company Market Share Analysis 2025
- 12.3.1 Top 5 Companies Market Share Analysis
- 12.3.2 Top 3 Companies Market Share Analysis
- 12.4. List of Potential Customers
- 13. Research Methodology
List of Figures
- Figure 1: Global APAC Diesel Generator Industry Revenue Breakdown (billion, %) by Region 2025 & 2033
- Figure 2: Global APAC Diesel Generator Industry Volume Breakdown (K Unit, %) by Region 2025 & 2033
- Figure 3: China APAC Diesel Generator Industry Revenue (billion), by Capacity 2025 & 2033
- Figure 4: China APAC Diesel Generator Industry Volume (K Unit), by Capacity 2025 & 2033
- Figure 5: China APAC Diesel Generator Industry Revenue Share (%), by Capacity 2025 & 2033
- Figure 6: China APAC Diesel Generator Industry Volume Share (%), by Capacity 2025 & 2033
- Figure 7: China APAC Diesel Generator Industry Revenue (billion), by End-User 2025 & 2033
- Figure 8: China APAC Diesel Generator Industry Volume (K Unit), by End-User 2025 & 2033
- Figure 9: China APAC Diesel Generator Industry Revenue Share (%), by End-User 2025 & 2033
- Figure 10: China APAC Diesel Generator Industry Volume Share (%), by End-User 2025 & 2033
- Figure 11: China APAC Diesel Generator Industry Revenue (billion), by Application 2025 & 2033
- Figure 12: China APAC Diesel Generator Industry Volume (K Unit), by Application 2025 & 2033
- Figure 13: China APAC Diesel Generator Industry Revenue Share (%), by Application 2025 & 2033
- Figure 14: China APAC Diesel Generator Industry Volume Share (%), by Application 2025 & 2033
- Figure 15: China APAC Diesel Generator Industry Revenue (billion), by Geography 2025 & 2033
- Figure 16: China APAC Diesel Generator Industry Volume (K Unit), by Geography 2025 & 2033
- Figure 17: China APAC Diesel Generator Industry Revenue Share (%), by Geography 2025 & 2033
- Figure 18: China APAC Diesel Generator Industry Volume Share (%), by Geography 2025 & 2033
- Figure 19: China APAC Diesel Generator Industry Revenue (billion), by Country 2025 & 2033
- Figure 20: China APAC Diesel Generator Industry Volume (K Unit), by Country 2025 & 2033
- Figure 21: China APAC Diesel Generator Industry Revenue Share (%), by Country 2025 & 2033
- Figure 22: China APAC Diesel Generator Industry Volume Share (%), by Country 2025 & 2033
- Figure 23: India APAC Diesel Generator Industry Revenue (billion), by Capacity 2025 & 2033
- Figure 24: India APAC Diesel Generator Industry Volume (K Unit), by Capacity 2025 & 2033
- Figure 25: India APAC Diesel Generator Industry Revenue Share (%), by Capacity 2025 & 2033
- Figure 26: India APAC Diesel Generator Industry Volume Share (%), by Capacity 2025 & 2033
- Figure 27: India APAC Diesel Generator Industry Revenue (billion), by End-User 2025 & 2033
- Figure 28: India APAC Diesel Generator Industry Volume (K Unit), by End-User 2025 & 2033
- Figure 29: India APAC Diesel Generator Industry Revenue Share (%), by End-User 2025 & 2033
- Figure 30: India APAC Diesel Generator Industry Volume Share (%), by End-User 2025 & 2033
- Figure 31: India APAC Diesel Generator Industry Revenue (billion), by Application 2025 & 2033
- Figure 32: India APAC Diesel Generator Industry Volume (K Unit), by Application 2025 & 2033
- Figure 33: India APAC Diesel Generator Industry Revenue Share (%), by Application 2025 & 2033
- Figure 34: India APAC Diesel Generator Industry Volume Share (%), by Application 2025 & 2033
- Figure 35: India APAC Diesel Generator Industry Revenue (billion), by Geography 2025 & 2033
- Figure 36: India APAC Diesel Generator Industry Volume (K Unit), by Geography 2025 & 2033
- Figure 37: India APAC Diesel Generator Industry Revenue Share (%), by Geography 2025 & 2033
- Figure 38: India APAC Diesel Generator Industry Volume Share (%), by Geography 2025 & 2033
- Figure 39: India APAC Diesel Generator Industry Revenue (billion), by Country 2025 & 2033
- Figure 40: India APAC Diesel Generator Industry Volume (K Unit), by Country 2025 & 2033
- Figure 41: India APAC Diesel Generator Industry Revenue Share (%), by Country 2025 & 2033
- Figure 42: India APAC Diesel Generator Industry Volume Share (%), by Country 2025 & 2033
- Figure 43: Japan APAC Diesel Generator Industry Revenue (billion), by Capacity 2025 & 2033
- Figure 44: Japan APAC Diesel Generator Industry Volume (K Unit), by Capacity 2025 & 2033
- Figure 45: Japan APAC Diesel Generator Industry Revenue Share (%), by Capacity 2025 & 2033
- Figure 46: Japan APAC Diesel Generator Industry Volume Share (%), by Capacity 2025 & 2033
- Figure 47: Japan APAC Diesel Generator Industry Revenue (billion), by End-User 2025 & 2033
- Figure 48: Japan APAC Diesel Generator Industry Volume (K Unit), by End-User 2025 & 2033
- Figure 49: Japan APAC Diesel Generator Industry Revenue Share (%), by End-User 2025 & 2033
- Figure 50: Japan APAC Diesel Generator Industry Volume Share (%), by End-User 2025 & 2033
- Figure 51: Japan APAC Diesel Generator Industry Revenue (billion), by Application 2025 & 2033
- Figure 52: Japan APAC Diesel Generator Industry Volume (K Unit), by Application 2025 & 2033
- Figure 53: Japan APAC Diesel Generator Industry Revenue Share (%), by Application 2025 & 2033
- Figure 54: Japan APAC Diesel Generator Industry Volume Share (%), by Application 2025 & 2033
- Figure 55: Japan APAC Diesel Generator Industry Revenue (billion), by Geography 2025 & 2033
- Figure 56: Japan APAC Diesel Generator Industry Volume (K Unit), by Geography 2025 & 2033
- Figure 57: Japan APAC Diesel Generator Industry Revenue Share (%), by Geography 2025 & 2033
- Figure 58: Japan APAC Diesel Generator Industry Volume Share (%), by Geography 2025 & 2033
- Figure 59: Japan APAC Diesel Generator Industry Revenue (billion), by Country 2025 & 2033
- Figure 60: Japan APAC Diesel Generator Industry Volume (K Unit), by Country 2025 & 2033
- Figure 61: Japan APAC Diesel Generator Industry Revenue Share (%), by Country 2025 & 2033
- Figure 62: Japan APAC Diesel Generator Industry Volume Share (%), by Country 2025 & 2033
- Figure 63: South Korea APAC Diesel Generator Industry Revenue (billion), by Capacity 2025 & 2033
- Figure 64: South Korea APAC Diesel Generator Industry Volume (K Unit), by Capacity 2025 & 2033
- Figure 65: South Korea APAC Diesel Generator Industry Revenue Share (%), by Capacity 2025 & 2033
- Figure 66: South Korea APAC Diesel Generator Industry Volume Share (%), by Capacity 2025 & 2033
- Figure 67: South Korea APAC Diesel Generator Industry Revenue (billion), by End-User 2025 & 2033
- Figure 68: South Korea APAC Diesel Generator Industry Volume (K Unit), by End-User 2025 & 2033
- Figure 69: South Korea APAC Diesel Generator Industry Revenue Share (%), by End-User 2025 & 2033
- Figure 70: South Korea APAC Diesel Generator Industry Volume Share (%), by End-User 2025 & 2033
- Figure 71: South Korea APAC Diesel Generator Industry Revenue (billion), by Application 2025 & 2033
- Figure 72: South Korea APAC Diesel Generator Industry Volume (K Unit), by Application 2025 & 2033
- Figure 73: South Korea APAC Diesel Generator Industry Revenue Share (%), by Application 2025 & 2033
- Figure 74: South Korea APAC Diesel Generator Industry Volume Share (%), by Application 2025 & 2033
- Figure 75: South Korea APAC Diesel Generator Industry Revenue (billion), by Geography 2025 & 2033
- Figure 76: South Korea APAC Diesel Generator Industry Volume (K Unit), by Geography 2025 & 2033
- Figure 77: South Korea APAC Diesel Generator Industry Revenue Share (%), by Geography 2025 & 2033
- Figure 78: South Korea APAC Diesel Generator Industry Volume Share (%), by Geography 2025 & 2033
- Figure 79: South Korea APAC Diesel Generator Industry Revenue (billion), by Country 2025 & 2033
- Figure 80: South Korea APAC Diesel Generator Industry Volume (K Unit), by Country 2025 & 2033
- Figure 81: South Korea APAC Diesel Generator Industry Revenue Share (%), by Country 2025 & 2033
- Figure 82: South Korea APAC Diesel Generator Industry Volume Share (%), by Country 2025 & 2033
- Figure 83: Rest of Asia Pacific APAC Diesel Generator Industry Revenue (billion), by Capacity 2025 & 2033
- Figure 84: Rest of Asia Pacific APAC Diesel Generator Industry Volume (K Unit), by Capacity 2025 & 2033
- Figure 85: Rest of Asia Pacific APAC Diesel Generator Industry Revenue Share (%), by Capacity 2025 & 2033
- Figure 86: Rest of Asia Pacific APAC Diesel Generator Industry Volume Share (%), by Capacity 2025 & 2033
- Figure 87: Rest of Asia Pacific APAC Diesel Generator Industry Revenue (billion), by End-User 2025 & 2033
- Figure 88: Rest of Asia Pacific APAC Diesel Generator Industry Volume (K Unit), by End-User 2025 & 2033
- Figure 89: Rest of Asia Pacific APAC Diesel Generator Industry Revenue Share (%), by End-User 2025 & 2033
- Figure 90: Rest of Asia Pacific APAC Diesel Generator Industry Volume Share (%), by End-User 2025 & 2033
- Figure 91: Rest of Asia Pacific APAC Diesel Generator Industry Revenue (billion), by Application 2025 & 2033
- Figure 92: Rest of Asia Pacific APAC Diesel Generator Industry Volume (K Unit), by Application 2025 & 2033
- Figure 93: Rest of Asia Pacific APAC Diesel Generator Industry Revenue Share (%), by Application 2025 & 2033
- Figure 94: Rest of Asia Pacific APAC Diesel Generator Industry Volume Share (%), by Application 2025 & 2033
- Figure 95: Rest of Asia Pacific APAC Diesel Generator Industry Revenue (billion), by Geography 2025 & 2033
- Figure 96: Rest of Asia Pacific APAC Diesel Generator Industry Volume (K Unit), by Geography 2025 & 2033
- Figure 97: Rest of Asia Pacific APAC Diesel Generator Industry Revenue Share (%), by Geography 2025 & 2033
- Figure 98: Rest of Asia Pacific APAC Diesel Generator Industry Volume Share (%), by Geography 2025 & 2033
- Figure 99: Rest of Asia Pacific APAC Diesel Generator Industry Revenue (billion), by Country 2025 & 2033
- Figure 100: Rest of Asia Pacific APAC Diesel Generator Industry Volume (K Unit), by Country 2025 & 2033
- Figure 101: Rest of Asia Pacific APAC Diesel Generator Industry Revenue Share (%), by Country 2025 & 2033
- Figure 102: Rest of Asia Pacific APAC Diesel Generator Industry Volume Share (%), by Country 2025 & 2033
List of Tables
- Table 1: Global APAC Diesel Generator Industry Revenue billion Forecast, by Capacity 2020 & 2033
- Table 2: Global APAC Diesel Generator Industry Volume K Unit Forecast, by Capacity 2020 & 2033
- Table 3: Global APAC Diesel Generator Industry Revenue billion Forecast, by End-User 2020 & 2033
- Table 4: Global APAC Diesel Generator Industry Volume K Unit Forecast, by End-User 2020 & 2033
- Table 5: Global APAC Diesel Generator Industry Revenue billion Forecast, by Application 2020 & 2033
- Table 6: Global APAC Diesel Generator Industry Volume K Unit Forecast, by Application 2020 & 2033
- Table 7: Global APAC Diesel Generator Industry Revenue billion Forecast, by Geography 2020 & 2033
- Table 8: Global APAC Diesel Generator Industry Volume K Unit Forecast, by Geography 2020 & 2033
- Table 9: Global APAC Diesel Generator Industry Revenue billion Forecast, by Region 2020 & 2033
- Table 10: Global APAC Diesel Generator Industry Volume K Unit Forecast, by Region 2020 & 2033
- Table 11: Global APAC Diesel Generator Industry Revenue billion Forecast, by Capacity 2020 & 2033
- Table 12: Global APAC Diesel Generator Industry Volume K Unit Forecast, by Capacity 2020 & 2033
- Table 13: Global APAC Diesel Generator Industry Revenue billion Forecast, by End-User 2020 & 2033
- Table 14: Global APAC Diesel Generator Industry Volume K Unit Forecast, by End-User 2020 & 2033
- Table 15: Global APAC Diesel Generator Industry Revenue billion Forecast, by Application 2020 & 2033
- Table 16: Global APAC Diesel Generator Industry Volume K Unit Forecast, by Application 2020 & 2033
- Table 17: Global APAC Diesel Generator Industry Revenue billion Forecast, by Geography 2020 & 2033
- Table 18: Global APAC Diesel Generator Industry Volume K Unit Forecast, by Geography 2020 & 2033
- Table 19: Global APAC Diesel Generator Industry Revenue billion Forecast, by Country 2020 & 2033
- Table 20: Global APAC Diesel Generator Industry Volume K Unit Forecast, by Country 2020 & 2033
- Table 21: Global APAC Diesel Generator Industry Revenue billion Forecast, by Capacity 2020 & 2033
- Table 22: Global APAC Diesel Generator Industry Volume K Unit Forecast, by Capacity 2020 & 2033
- Table 23: Global APAC Diesel Generator Industry Revenue billion Forecast, by End-User 2020 & 2033
- Table 24: Global APAC Diesel Generator Industry Volume K Unit Forecast, by End-User 2020 & 2033
- Table 25: Global APAC Diesel Generator Industry Revenue billion Forecast, by Application 2020 & 2033
- Table 26: Global APAC Diesel Generator Industry Volume K Unit Forecast, by Application 2020 & 2033
- Table 27: Global APAC Diesel Generator Industry Revenue billion Forecast, by Geography 2020 & 2033
- Table 28: Global APAC Diesel Generator Industry Volume K Unit Forecast, by Geography 2020 & 2033
- Table 29: Global APAC Diesel Generator Industry Revenue billion Forecast, by Country 2020 & 2033
- Table 30: Global APAC Diesel Generator Industry Volume K Unit Forecast, by Country 2020 & 2033
- Table 31: Global APAC Diesel Generator Industry Revenue billion Forecast, by Capacity 2020 & 2033
- Table 32: Global APAC Diesel Generator Industry Volume K Unit Forecast, by Capacity 2020 & 2033
- Table 33: Global APAC Diesel Generator Industry Revenue billion Forecast, by End-User 2020 & 2033
- Table 34: Global APAC Diesel Generator Industry Volume K Unit Forecast, by End-User 2020 & 2033
- Table 35: Global APAC Diesel Generator Industry Revenue billion Forecast, by Application 2020 & 2033
- Table 36: Global APAC Diesel Generator Industry Volume K Unit Forecast, by Application 2020 & 2033
- Table 37: Global APAC Diesel Generator Industry Revenue billion Forecast, by Geography 2020 & 2033
- Table 38: Global APAC Diesel Generator Industry Volume K Unit Forecast, by Geography 2020 & 2033
- Table 39: Global APAC Diesel Generator Industry Revenue billion Forecast, by Country 2020 & 2033
- Table 40: Global APAC Diesel Generator Industry Volume K Unit Forecast, by Country 2020 & 2033
- Table 41: Global APAC Diesel Generator Industry Revenue billion Forecast, by Capacity 2020 & 2033
- Table 42: Global APAC Diesel Generator Industry Volume K Unit Forecast, by Capacity 2020 & 2033
- Table 43: Global APAC Diesel Generator Industry Revenue billion Forecast, by End-User 2020 & 2033
- Table 44: Global APAC Diesel Generator Industry Volume K Unit Forecast, by End-User 2020 & 2033
- Table 45: Global APAC Diesel Generator Industry Revenue billion Forecast, by Application 2020 & 2033
- Table 46: Global APAC Diesel Generator Industry Volume K Unit Forecast, by Application 2020 & 2033
- Table 47: Global APAC Diesel Generator Industry Revenue billion Forecast, by Geography 2020 & 2033
- Table 48: Global APAC Diesel Generator Industry Volume K Unit Forecast, by Geography 2020 & 2033
- Table 49: Global APAC Diesel Generator Industry Revenue billion Forecast, by Country 2020 & 2033
- Table 50: Global APAC Diesel Generator Industry Volume K Unit Forecast, by Country 2020 & 2033
- Table 51: Global APAC Diesel Generator Industry Revenue billion Forecast, by Capacity 2020 & 2033
- Table 52: Global APAC Diesel Generator Industry Volume K Unit Forecast, by Capacity 2020 & 2033
- Table 53: Global APAC Diesel Generator Industry Revenue billion Forecast, by End-User 2020 & 2033
- Table 54: Global APAC Diesel Generator Industry Volume K Unit Forecast, by End-User 2020 & 2033
- Table 55: Global APAC Diesel Generator Industry Revenue billion Forecast, by Application 2020 & 2033
- Table 56: Global APAC Diesel Generator Industry Volume K Unit Forecast, by Application 2020 & 2033
- Table 57: Global APAC Diesel Generator Industry Revenue billion Forecast, by Geography 2020 & 2033
- Table 58: Global APAC Diesel Generator Industry Volume K Unit Forecast, by Geography 2020 & 2033
- Table 59: Global APAC Diesel Generator Industry Revenue billion Forecast, by Country 2020 & 2033
- Table 60: Global APAC Diesel Generator Industry Volume K Unit Forecast, by Country 2020 & 2033
Frequently Asked Questions
1. What is the projected Compound Annual Growth Rate (CAGR) of the APAC Diesel Generator Industry?
The projected CAGR is approximately 8.1%.
2. Which companies are prominent players in the APAC Diesel Generator Industry?
Key companies in the market include Kohler Co*List Not Exhaustive, Doosan Corporation, Mahindra Powerol Ltd, Caterpillar Inc, Honda Siel Power Products Ltd, Cummins Inc, Mitsubishi Heavy Industries Engine & Turbocharger Ltd, Yanmar Holdings co Ltd, Generac Power Systems.
3. What are the main segments of the APAC Diesel Generator Industry?
The market segments include Capacity, End-User, Application, Geography.
4. Can you provide details about the market size?
The market size is estimated to be USD 39.3 billion as of 2022.
5. What are some drivers contributing to market growth?
4.; Increased Demand for Uninterrupted and Reliable Power Supply4.; The Rise In the Industrial Sector.
6. What are the notable trends driving market growth?
Industrial Sector to Dominate the Market.
7. Are there any restraints impacting market growth?
4.; Advancements In Battery Technologies.
8. Can you provide examples of recent developments in the market?
June 2022: Kirloskar Group, an Indian conglomerate, unveiled Kirloskar iGreen Version 2.0 for the power generation business. The gensets powered with the R550 series of engines offer compactness, fuel efficiency, and high-power quality.
9. What pricing options are available for accessing the report?
Pricing options include single-user, multi-user, and enterprise licenses priced at USD 4750, USD 5250, and USD 8750 respectively.
10. Is the market size provided in terms of value or volume?
The market size is provided in terms of value, measured in billion and volume, measured in K Unit.
11. Are there any specific market keywords associated with the report?
Yes, the market keyword associated with the report is "APAC Diesel Generator Industry," which aids in identifying and referencing the specific market segment covered.
12. How do I determine which pricing option suits my needs best?
The pricing options vary based on user requirements and access needs. Individual users may opt for single-user licenses, while businesses requiring broader access may choose multi-user or enterprise licenses for cost-effective access to the report.
13. Are there any additional resources or data provided in the APAC Diesel Generator Industry report?
While the report offers comprehensive insights, it's advisable to review the specific contents or supplementary materials provided to ascertain if additional resources or data are available.
14. How can I stay updated on further developments or reports in the APAC Diesel Generator Industry?
To stay informed about further developments, trends, and reports in the APAC Diesel Generator Industry, consider subscribing to industry newsletters, following relevant companies and organizations, or regularly checking reputable industry news sources and publications.
Methodology
Step 1 - Identification of Relevant Samples Size from Population Database


Step 2 - Approaches for Defining Global Market Size (Value, Volume* & Price*)

Note*: In applicable scenarios
Step 3 - Data Sources
Primary Research
- Web Analytics
- Survey Reports
- Research Institute
- Latest Research Reports
- Opinion Leaders
Secondary Research
- Annual Reports
- White Paper
- Latest Press Release
- Industry Association
- Paid Database
- Investor Presentations

Step 4 - Data Triangulation
Involves using different sources of information in order to increase the validity of a study
These sources are likely to be stakeholders in a program - participants, other researchers, program staff, other community members, and so on.
Then we put all data in single framework & apply various statistical tools to find out the dynamic on the market.
During the analysis stage, feedback from the stakeholder groups would be compared to determine areas of agreement as well as areas of divergence

