
Key Insights
The Asia-Pacific (APAC) essential oil market is experiencing robust growth, driven by increasing consumer awareness of natural and organic products, rising demand for aromatherapy and holistic wellness practices, and the burgeoning cosmetics and personal care industry within the region. The market's diverse range of applications, including food and beverages, pharmaceuticals, and aromatherapy, contributes significantly to its expansion. Specific growth drivers within APAC include the increasing disposable incomes in emerging economies like India and China, fueling demand for premium, natural products. The rising popularity of Ayurveda and traditional medicine further boosts the demand for essential oils with therapeutic properties. While challenges exist, such as fluctuating raw material prices and potential supply chain disruptions, the overall market outlook remains positive, supported by consistent innovation in product formulations and delivery methods.
Significant growth is expected from countries like India and China, which are major consumers of essential oils both for traditional medicinal purposes and in the increasingly popular personal care and cosmetics sector. The rising middle class in these countries, coupled with increased access to information about the benefits of essential oils, is a key factor driving demand. Furthermore, the integration of essential oils into modern beauty and wellness routines, particularly among young consumers, is expected to contribute to market expansion in the coming years. The regional segment is likely to show differentiation, with certain countries exhibiting stronger growth rates than others based on factors such as economic development, cultural preferences, and regulatory environments. Specific product types, such as lavender, tea tree, and peppermint oils, are projected to maintain high demand due to their versatility and diverse applications.
This comprehensive report provides an in-depth analysis of the Asia-Pacific (APAC) essential oil industry, covering the period 2019-2033. It examines market dynamics, competitive landscapes, and future growth opportunities, offering valuable insights for industry stakeholders, investors, and businesses operating within this burgeoning sector. The report utilizes a robust methodology incorporating extensive primary and secondary research to deliver accurate and reliable data, forecasts, and actionable recommendations. The APAC essential oil market is projected to reach xx Million by 2033, exhibiting significant growth potential.
APAC Essential Oil Industry Market Concentration & Innovation
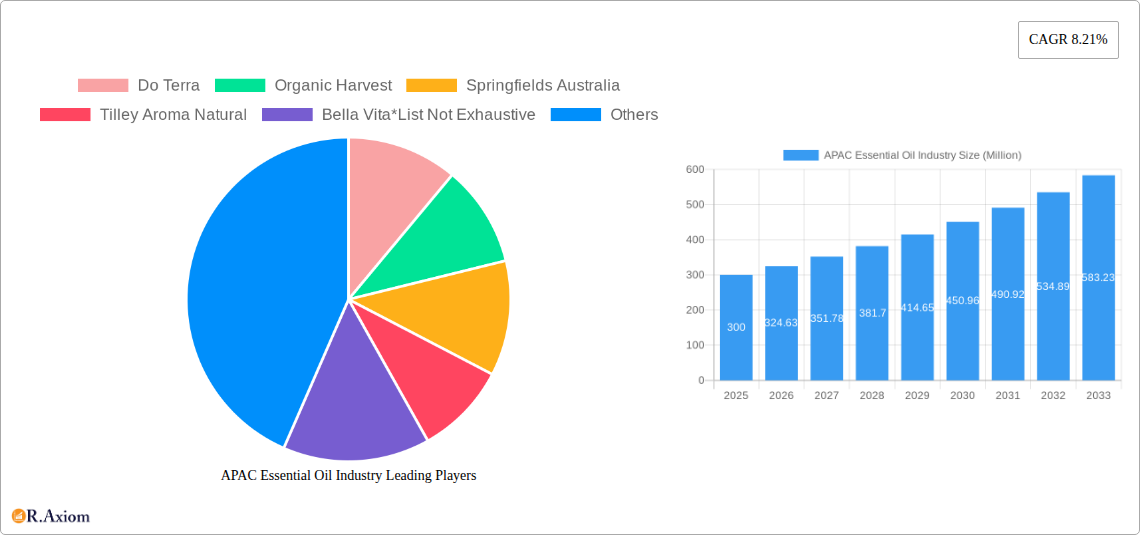
The APAC essential oil market exhibits a moderately concentrated landscape, with several large players commanding significant market share. While precise market share figures for individual companies are commercially sensitive, key players such as doTERRA, Young Living Essentials, and Auroma hold substantial positions, leveraging strong brand recognition and extensive distribution networks. However, smaller, niche players are also active, focusing on specialized product offerings or regional markets. Innovation in the APAC essential oil industry is primarily driven by consumer demand for natural and organic products, coupled with increasing awareness of aromatherapy and its therapeutic benefits. Companies are actively investing in research and development to create novel essential oil blends and formulations catering to diverse consumer needs. Furthermore, sustainability and ethical sourcing are gaining traction, influencing product development and supply chain strategies. The regulatory framework varies across APAC nations, impacting product standardization and labeling requirements. The market faces competition from synthetic fragrance substitutes, though natural essential oils continue to maintain a strong preference among consumers seeking authentic products. Mergers and acquisitions (M&A) activity in the sector remains relatively moderate, with deal values primarily concentrated in the xx Million range, driven by strategic expansion and consolidation efforts.
- Key Players: doTERRA, Young Living Essentials, Auroma, and others.
- Market Concentration: Moderately concentrated.
- M&A Activity: Moderate, with deal values averaging xx Million.
- Innovation Drivers: Consumer demand for natural products, aromatherapy awareness, sustainability.
- Regulatory Landscape: Varies across APAC countries.
APAC Essential Oil Industry Industry Trends & Insights
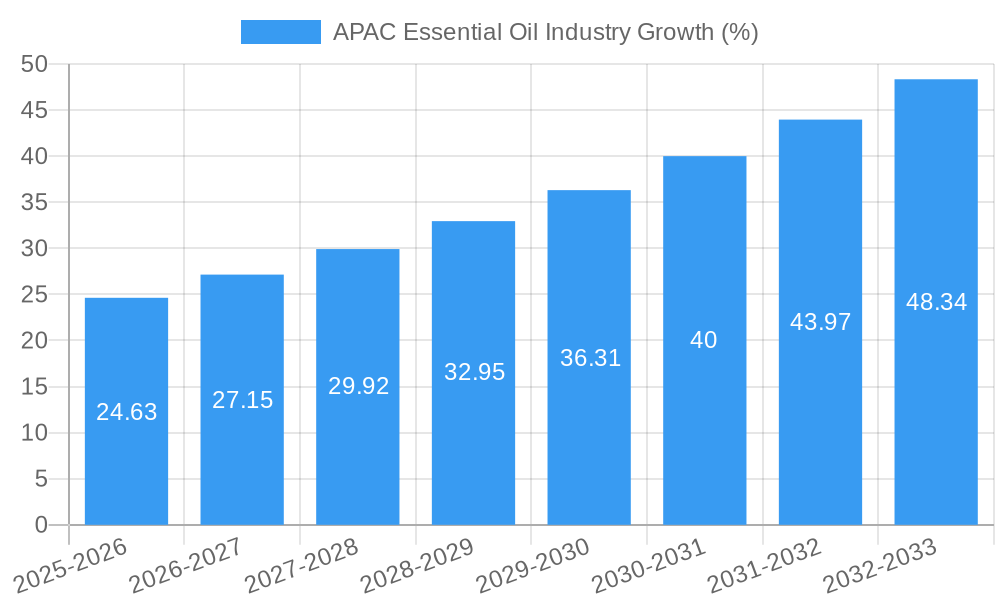
The APAC essential oil market is experiencing robust growth, driven by several key factors. The increasing adoption of aromatherapy and holistic wellness practices fuels demand for essential oils across diverse applications, including personal care, cosmetics, and pharmaceuticals. Growing disposable incomes, particularly in emerging economies, further contribute to the rising market size. Technological advancements, such as improved extraction techniques and advanced analytical methods for quality control, are enhancing product quality and efficiency. Consumer preferences are shifting towards organic and sustainably sourced essential oils, increasing the adoption of eco-friendly practices throughout the supply chain. Competitive dynamics are characterized by both established players and emerging brands vying for market share through product innovation, aggressive marketing, and strategic partnerships. The CAGR for the APAC essential oil market during the forecast period (2025-2033) is estimated to be xx%, while the market penetration rate stands at xx% in 2025, projected to increase to xx% by 2033.
Dominant Markets & Segments in APAC Essential Oil Industry
Within the APAC essential oil market, several segments demonstrate strong dominance. Geographically, [Country Name] currently holds the leading position, driven by [mention key factors like strong consumer demand, robust economy, and favorable regulatory environment]. Among product types, Lavender Oil, Tea Tree Oil, and Eucalyptus Oil maintain high demand, attributed to their widespread use in aromatherapy and personal care. In terms of application, the Cosmetics & Personal Care segment leads the market, while the Aromatherapy sector exhibits robust growth potential.
- Leading Region/Country: [Country Name] (Reasons: [mention specific reasons])
- Dominant Product Types: Lavender Oil, Tea Tree Oil, Eucalyptus Oil. (Reasons: [mention specific reasons])
- Leading Application Segment: Cosmetics & Personal Care (Reasons: [mention specific reasons])
- Key Drivers for Dominance: [Expand with economic policies, infrastructure in paragraph form].
APAC Essential Oil Industry Product Developments
Recent product innovations include a rise in specialized blends targeting specific therapeutic benefits, as well as convenient formats like roll-on applicators and pre-filled diffusers. Companies are emphasizing sustainable sourcing practices and transparent labeling, resonating with environmentally conscious consumers. The incorporation of essential oils into novel product formats like bath bombs, shower gels, and candles expands market reach. Technological advancements like improved extraction methods and quality control techniques are driving product standardization and ensuring high-quality products.
Report Scope & Segmentation Analysis
This report segments the APAC essential oil market by product type (Lavender Oil, Orange Oil, Eucalyptus Oil, Peppermint Oil, Spearmint Oil, Lemon Oil, Rosemary Oil, Geranium Oil, Tea Tree Oil, Others) and application (Food & Beverages, Aromatherapy, Pharmaceuticals, Cosmetics & Personal Care, Others). Each segment’s growth projections are detailed, reflecting diverse market dynamics and competitive landscapes. Market size estimations and detailed competitive analyses are provided for each segment. Growth projections vary based on the segment. For example, the Aromatherapy segment is projected to show faster growth than the Food & Beverages segment due to [mention specific reasons].
Key Drivers of APAC Essential Oil Industry Growth
The APAC essential oil market's growth is propelled by increasing consumer awareness of aromatherapy's therapeutic benefits and the growing preference for natural and organic personal care products. Technological advancements in extraction techniques and quality control contribute to enhanced product quality and efficiency, influencing consumer preference. Furthermore, supportive government policies and investments in the health and wellness sector provide a conducive environment for market expansion.
Challenges in the APAC Essential Oil Industry Sector
The APAC essential oil industry faces challenges including fluctuations in raw material prices, stringent regulatory requirements across different countries, and the potential for adulteration or counterfeit products. Supply chain complexities and sustainability concerns also impact industry profitability. Competition from synthetic fragrances and other substitute products presents a further obstacle. These challenges, if not effectively managed, could hinder market growth.
Emerging Opportunities in APAP Essential Oil Industry
Emerging opportunities lie in the expansion into new markets within APAC, focusing on untapped consumer segments and geographical regions. The development of innovative product formulations targeting specific health and wellness needs offers significant potential. Furthermore, the integration of technology in supply chain management and product traceability enhances transparency and builds consumer trust.
Leading Players in the APAP Essential Oil Industry Market
- doTERRA
- Organic Harvest
- Springfields Australia
- Tilley Aroma Natural
- Bella Vita
- In Essence
- Young Living Essentials
- Auroma
- AT-Aroma Co Ltd
- Ultra International BV
- Aroma Treasures
Key Developments in APAC Essential Oil Industry Industry
- June 2021: doTERRA expanded its portfolio in Thailand, establishing a new corporate office in Bangkok and registering 80 local products.
- September 2022: Blossom Kochhar Aroma Magic launched a Neem and Tea Tree product range.
- October 2022: doTERRA introduced new wellness products combining pure essential oils, sustainable sourcing, and evidence-based research (Helichrysum touch, LaLuz Diffuser, Roam Diffuser, Dawn Aroma Humidifier, Balance Bath Bar, On Guard Toothpaste, and On Guard Hand Wipes).
Strategic Outlook for APAC Essential Oil Industry Market
The APAC essential oil market presents a promising outlook, driven by increasing consumer demand, technological advancements, and supportive regulatory frameworks. Opportunities for growth are abundant, particularly within niche segments and emerging markets. Companies that leverage sustainable practices, innovate with product formulations, and adopt effective marketing strategies are poised to capture significant market share. Further growth is anticipated as consumer awareness and disposable incomes continue to rise across the APAC region.
APAC Essential Oil Industry Segmentation
-
1. Product Type
- 1.1. Lavender Oil
- 1.2. Orange Oil
- 1.3. Eucalyptus Oil
- 1.4. Peppermint Oil
- 1.5. Spearmint Oil
- 1.6. Lemon Oil
- 1.7. Rosemary Oil
- 1.8. Geranium Oil
- 1.9. Tea Tree Oil
- 1.10. Others
-
2. Application
- 2.1. Food & Beverages
- 2.2. Aromatherapy
- 2.3. Pharmaceuticals
- 2.4. Cosmetics & Personal Care
- 2.5. Others
-
3. Geography
- 3.1. China
- 3.2. India
- 3.3. Japan
- 3.4. Australia
- 3.5. Rest of Asia-Pacific
APAC Essential Oil Industry Segmentation By Geography
- 1. China
- 2. India
- 3. Japan
- 4. Australia
- 5. Rest of Asia Pacific
APAC Essential Oil Industry REPORT HIGHLIGHTS
| Aspects | Details |
|---|---|
| Study Period | 2019-2033 |
| Base Year | 2024 |
| Estimated Year | 2025 |
| Forecast Period | 2025-2033 |
| Historical Period | 2019-2024 |
| Growth Rate | CAGR of 8.21% from 2019-2033 |
| Segmentation |
|
Table of Contents
- 1. Introduction
- 1.1. Research Scope
- 1.2. Market Segmentation
- 1.3. Research Methodology
- 1.4. Definitions and Assumptions
- 2. Executive Summary
- 2.1. Introduction
- 3. Market Dynamics
- 3.1. Introduction
- 3.2. Market Drivers
- 3.2.1. Increasing awareness towards fitness among consumers; Demand for convenient fortified foods
- 3.3. Market Restrains
- 3.3.1. Increasing vegan culture in the market
- 3.4. Market Trends
- 3.4.1. Increasing Awareness Toward the Health Benefits of Essential Oil
- 4. Market Factor Analysis
- 4.1. Porters Five Forces
- 4.2. Supply/Value Chain
- 4.3. PESTEL analysis
- 4.4. Market Entropy
- 4.5. Patent/Trademark Analysis
- 5. Global APAC Essential Oil Industry Analysis, Insights and Forecast, 2019-2031
- 5.1. Market Analysis, Insights and Forecast - by Product Type
- 5.1.1. Lavender Oil
- 5.1.2. Orange Oil
- 5.1.3. Eucalyptus Oil
- 5.1.4. Peppermint Oil
- 5.1.5. Spearmint Oil
- 5.1.6. Lemon Oil
- 5.1.7. Rosemary Oil
- 5.1.8. Geranium Oil
- 5.1.9. Tea Tree Oil
- 5.1.10. Others
- 5.2. Market Analysis, Insights and Forecast - by Application
- 5.2.1. Food & Beverages
- 5.2.2. Aromatherapy
- 5.2.3. Pharmaceuticals
- 5.2.4. Cosmetics & Personal Care
- 5.2.5. Others
- 5.3. Market Analysis, Insights and Forecast - by Geography
- 5.3.1. China
- 5.3.2. India
- 5.3.3. Japan
- 5.3.4. Australia
- 5.3.5. Rest of Asia-Pacific
- 5.4. Market Analysis, Insights and Forecast - by Region
- 5.4.1. China
- 5.4.2. India
- 5.4.3. Japan
- 5.4.4. Australia
- 5.4.5. Rest of Asia Pacific
- 5.1. Market Analysis, Insights and Forecast - by Product Type
- 6. China APAC Essential Oil Industry Analysis, Insights and Forecast, 2019-2031
- 6.1. Market Analysis, Insights and Forecast - by Product Type
- 6.1.1. Lavender Oil
- 6.1.2. Orange Oil
- 6.1.3. Eucalyptus Oil
- 6.1.4. Peppermint Oil
- 6.1.5. Spearmint Oil
- 6.1.6. Lemon Oil
- 6.1.7. Rosemary Oil
- 6.1.8. Geranium Oil
- 6.1.9. Tea Tree Oil
- 6.1.10. Others
- 6.2. Market Analysis, Insights and Forecast - by Application
- 6.2.1. Food & Beverages
- 6.2.2. Aromatherapy
- 6.2.3. Pharmaceuticals
- 6.2.4. Cosmetics & Personal Care
- 6.2.5. Others
- 6.3. Market Analysis, Insights and Forecast - by Geography
- 6.3.1. China
- 6.3.2. India
- 6.3.3. Japan
- 6.3.4. Australia
- 6.3.5. Rest of Asia-Pacific
- 6.1. Market Analysis, Insights and Forecast - by Product Type
- 7. India APAC Essential Oil Industry Analysis, Insights and Forecast, 2019-2031
- 7.1. Market Analysis, Insights and Forecast - by Product Type
- 7.1.1. Lavender Oil
- 7.1.2. Orange Oil
- 7.1.3. Eucalyptus Oil
- 7.1.4. Peppermint Oil
- 7.1.5. Spearmint Oil
- 7.1.6. Lemon Oil
- 7.1.7. Rosemary Oil
- 7.1.8. Geranium Oil
- 7.1.9. Tea Tree Oil
- 7.1.10. Others
- 7.2. Market Analysis, Insights and Forecast - by Application
- 7.2.1. Food & Beverages
- 7.2.2. Aromatherapy
- 7.2.3. Pharmaceuticals
- 7.2.4. Cosmetics & Personal Care
- 7.2.5. Others
- 7.3. Market Analysis, Insights and Forecast - by Geography
- 7.3.1. China
- 7.3.2. India
- 7.3.3. Japan
- 7.3.4. Australia
- 7.3.5. Rest of Asia-Pacific
- 7.1. Market Analysis, Insights and Forecast - by Product Type
- 8. Japan APAC Essential Oil Industry Analysis, Insights and Forecast, 2019-2031
- 8.1. Market Analysis, Insights and Forecast - by Product Type
- 8.1.1. Lavender Oil
- 8.1.2. Orange Oil
- 8.1.3. Eucalyptus Oil
- 8.1.4. Peppermint Oil
- 8.1.5. Spearmint Oil
- 8.1.6. Lemon Oil
- 8.1.7. Rosemary Oil
- 8.1.8. Geranium Oil
- 8.1.9. Tea Tree Oil
- 8.1.10. Others
- 8.2. Market Analysis, Insights and Forecast - by Application
- 8.2.1. Food & Beverages
- 8.2.2. Aromatherapy
- 8.2.3. Pharmaceuticals
- 8.2.4. Cosmetics & Personal Care
- 8.2.5. Others
- 8.3. Market Analysis, Insights and Forecast - by Geography
- 8.3.1. China
- 8.3.2. India
- 8.3.3. Japan
- 8.3.4. Australia
- 8.3.5. Rest of Asia-Pacific
- 8.1. Market Analysis, Insights and Forecast - by Product Type
- 9. Australia APAC Essential Oil Industry Analysis, Insights and Forecast, 2019-2031
- 9.1. Market Analysis, Insights and Forecast - by Product Type
- 9.1.1. Lavender Oil
- 9.1.2. Orange Oil
- 9.1.3. Eucalyptus Oil
- 9.1.4. Peppermint Oil
- 9.1.5. Spearmint Oil
- 9.1.6. Lemon Oil
- 9.1.7. Rosemary Oil
- 9.1.8. Geranium Oil
- 9.1.9. Tea Tree Oil
- 9.1.10. Others
- 9.2. Market Analysis, Insights and Forecast - by Application
- 9.2.1. Food & Beverages
- 9.2.2. Aromatherapy
- 9.2.3. Pharmaceuticals
- 9.2.4. Cosmetics & Personal Care
- 9.2.5. Others
- 9.3. Market Analysis, Insights and Forecast - by Geography
- 9.3.1. China
- 9.3.2. India
- 9.3.3. Japan
- 9.3.4. Australia
- 9.3.5. Rest of Asia-Pacific
- 9.1. Market Analysis, Insights and Forecast - by Product Type
- 10. Rest of Asia Pacific APAC Essential Oil Industry Analysis, Insights and Forecast, 2019-2031
- 10.1. Market Analysis, Insights and Forecast - by Product Type
- 10.1.1. Lavender Oil
- 10.1.2. Orange Oil
- 10.1.3. Eucalyptus Oil
- 10.1.4. Peppermint Oil
- 10.1.5. Spearmint Oil
- 10.1.6. Lemon Oil
- 10.1.7. Rosemary Oil
- 10.1.8. Geranium Oil
- 10.1.9. Tea Tree Oil
- 10.1.10. Others
- 10.2. Market Analysis, Insights and Forecast - by Application
- 10.2.1. Food & Beverages
- 10.2.2. Aromatherapy
- 10.2.3. Pharmaceuticals
- 10.2.4. Cosmetics & Personal Care
- 10.2.5. Others
- 10.3. Market Analysis, Insights and Forecast - by Geography
- 10.3.1. China
- 10.3.2. India
- 10.3.3. Japan
- 10.3.4. Australia
- 10.3.5. Rest of Asia-Pacific
- 10.1. Market Analysis, Insights and Forecast - by Product Type
- 11. North America APAC Essential Oil Industry Analysis, Insights and Forecast, 2019-2031
- 11.1. Market Analysis, Insights and Forecast - By Country/Sub-region
- 11.1.1 United States
- 11.1.2 Canada
- 11.1.3 Mexico
- 12. Europe APAC Essential Oil Industry Analysis, Insights and Forecast, 2019-2031
- 12.1. Market Analysis, Insights and Forecast - By Country/Sub-region
- 12.1.1 Germany
- 12.1.2 United Kingdom
- 12.1.3 France
- 12.1.4 Spain
- 12.1.5 Italy
- 12.1.6 Spain
- 12.1.7 Belgium
- 12.1.8 Netherland
- 12.1.9 Nordics
- 12.1.10 Rest of Europe
- 13. Asia Pacific APAC Essential Oil Industry Analysis, Insights and Forecast, 2019-2031
- 13.1. Market Analysis, Insights and Forecast - By Country/Sub-region
- 13.1.1 China
- 13.1.2 Japan
- 13.1.3 India
- 13.1.4 South Korea
- 13.1.5 Southeast Asia
- 13.1.6 Australia
- 13.1.7 Indonesia
- 13.1.8 Phillipes
- 13.1.9 Singapore
- 13.1.10 Thailandc
- 13.1.11 Rest of Asia Pacific
- 14. South America APAC Essential Oil Industry Analysis, Insights and Forecast, 2019-2031
- 14.1. Market Analysis, Insights and Forecast - By Country/Sub-region
- 14.1.1 Brazil
- 14.1.2 Argentina
- 14.1.3 Peru
- 14.1.4 Chile
- 14.1.5 Colombia
- 14.1.6 Ecuador
- 14.1.7 Venezuela
- 14.1.8 Rest of South America
- 15. North America APAC Essential Oil Industry Analysis, Insights and Forecast, 2019-2031
- 15.1. Market Analysis, Insights and Forecast - By Country/Sub-region
- 15.1.1 United States
- 15.1.2 Canada
- 15.1.3 Mexico
- 16. MEA APAC Essential Oil Industry Analysis, Insights and Forecast, 2019-2031
- 16.1. Market Analysis, Insights and Forecast - By Country/Sub-region
- 16.1.1 United Arab Emirates
- 16.1.2 Saudi Arabia
- 16.1.3 South Africa
- 16.1.4 Rest of Middle East and Africa
- 17. Competitive Analysis
- 17.1. Global Market Share Analysis 2024
- 17.2. Company Profiles
- 17.2.1 Do Terra
- 17.2.1.1. Overview
- 17.2.1.2. Products
- 17.2.1.3. SWOT Analysis
- 17.2.1.4. Recent Developments
- 17.2.1.5. Financials (Based on Availability)
- 17.2.2 Organic Harvest
- 17.2.2.1. Overview
- 17.2.2.2. Products
- 17.2.2.3. SWOT Analysis
- 17.2.2.4. Recent Developments
- 17.2.2.5. Financials (Based on Availability)
- 17.2.3 Springfields Australia
- 17.2.3.1. Overview
- 17.2.3.2. Products
- 17.2.3.3. SWOT Analysis
- 17.2.3.4. Recent Developments
- 17.2.3.5. Financials (Based on Availability)
- 17.2.4 Tilley Aroma Natural
- 17.2.4.1. Overview
- 17.2.4.2. Products
- 17.2.4.3. SWOT Analysis
- 17.2.4.4. Recent Developments
- 17.2.4.5. Financials (Based on Availability)
- 17.2.5 Bella Vita*List Not Exhaustive
- 17.2.5.1. Overview
- 17.2.5.2. Products
- 17.2.5.3. SWOT Analysis
- 17.2.5.4. Recent Developments
- 17.2.5.5. Financials (Based on Availability)
- 17.2.6 In Essence
- 17.2.6.1. Overview
- 17.2.6.2. Products
- 17.2.6.3. SWOT Analysis
- 17.2.6.4. Recent Developments
- 17.2.6.5. Financials (Based on Availability)
- 17.2.7 Young Living Essentials
- 17.2.7.1. Overview
- 17.2.7.2. Products
- 17.2.7.3. SWOT Analysis
- 17.2.7.4. Recent Developments
- 17.2.7.5. Financials (Based on Availability)
- 17.2.8 Auroma
- 17.2.8.1. Overview
- 17.2.8.2. Products
- 17.2.8.3. SWOT Analysis
- 17.2.8.4. Recent Developments
- 17.2.8.5. Financials (Based on Availability)
- 17.2.9 AT-Aroma Co Ltd
- 17.2.9.1. Overview
- 17.2.9.2. Products
- 17.2.9.3. SWOT Analysis
- 17.2.9.4. Recent Developments
- 17.2.9.5. Financials (Based on Availability)
- 17.2.10 Ultra International BV
- 17.2.10.1. Overview
- 17.2.10.2. Products
- 17.2.10.3. SWOT Analysis
- 17.2.10.4. Recent Developments
- 17.2.10.5. Financials (Based on Availability)
- 17.2.11 Aroma Treasures
- 17.2.11.1. Overview
- 17.2.11.2. Products
- 17.2.11.3. SWOT Analysis
- 17.2.11.4. Recent Developments
- 17.2.11.5. Financials (Based on Availability)
- 17.2.1 Do Terra
List of Figures
- Figure 1: Global APAC Essential Oil Industry Revenue Breakdown (Million, %) by Region 2024 & 2032
- Figure 2: Global APAC Essential Oil Industry Volume Breakdown (K Tons, %) by Region 2024 & 2032
- Figure 3: North America APAC Essential Oil Industry Revenue (Million), by Country 2024 & 2032
- Figure 4: North America APAC Essential Oil Industry Volume (K Tons), by Country 2024 & 2032
- Figure 5: North America APAC Essential Oil Industry Revenue Share (%), by Country 2024 & 2032
- Figure 6: North America APAC Essential Oil Industry Volume Share (%), by Country 2024 & 2032
- Figure 7: Europe APAC Essential Oil Industry Revenue (Million), by Country 2024 & 2032
- Figure 8: Europe APAC Essential Oil Industry Volume (K Tons), by Country 2024 & 2032
- Figure 9: Europe APAC Essential Oil Industry Revenue Share (%), by Country 2024 & 2032
- Figure 10: Europe APAC Essential Oil Industry Volume Share (%), by Country 2024 & 2032
- Figure 11: Asia Pacific APAC Essential Oil Industry Revenue (Million), by Country 2024 & 2032
- Figure 12: Asia Pacific APAC Essential Oil Industry Volume (K Tons), by Country 2024 & 2032
- Figure 13: Asia Pacific APAC Essential Oil Industry Revenue Share (%), by Country 2024 & 2032
- Figure 14: Asia Pacific APAC Essential Oil Industry Volume Share (%), by Country 2024 & 2032
- Figure 15: South America APAC Essential Oil Industry Revenue (Million), by Country 2024 & 2032
- Figure 16: South America APAC Essential Oil Industry Volume (K Tons), by Country 2024 & 2032
- Figure 17: South America APAC Essential Oil Industry Revenue Share (%), by Country 2024 & 2032
- Figure 18: South America APAC Essential Oil Industry Volume Share (%), by Country 2024 & 2032
- Figure 19: North America APAC Essential Oil Industry Revenue (Million), by Country 2024 & 2032
- Figure 20: North America APAC Essential Oil Industry Volume (K Tons), by Country 2024 & 2032
- Figure 21: North America APAC Essential Oil Industry Revenue Share (%), by Country 2024 & 2032
- Figure 22: North America APAC Essential Oil Industry Volume Share (%), by Country 2024 & 2032
- Figure 23: MEA APAC Essential Oil Industry Revenue (Million), by Country 2024 & 2032
- Figure 24: MEA APAC Essential Oil Industry Volume (K Tons), by Country 2024 & 2032
- Figure 25: MEA APAC Essential Oil Industry Revenue Share (%), by Country 2024 & 2032
- Figure 26: MEA APAC Essential Oil Industry Volume Share (%), by Country 2024 & 2032
- Figure 27: China APAC Essential Oil Industry Revenue (Million), by Product Type 2024 & 2032
- Figure 28: China APAC Essential Oil Industry Volume (K Tons), by Product Type 2024 & 2032
- Figure 29: China APAC Essential Oil Industry Revenue Share (%), by Product Type 2024 & 2032
- Figure 30: China APAC Essential Oil Industry Volume Share (%), by Product Type 2024 & 2032
- Figure 31: China APAC Essential Oil Industry Revenue (Million), by Application 2024 & 2032
- Figure 32: China APAC Essential Oil Industry Volume (K Tons), by Application 2024 & 2032
- Figure 33: China APAC Essential Oil Industry Revenue Share (%), by Application 2024 & 2032
- Figure 34: China APAC Essential Oil Industry Volume Share (%), by Application 2024 & 2032
- Figure 35: China APAC Essential Oil Industry Revenue (Million), by Geography 2024 & 2032
- Figure 36: China APAC Essential Oil Industry Volume (K Tons), by Geography 2024 & 2032
- Figure 37: China APAC Essential Oil Industry Revenue Share (%), by Geography 2024 & 2032
- Figure 38: China APAC Essential Oil Industry Volume Share (%), by Geography 2024 & 2032
- Figure 39: China APAC Essential Oil Industry Revenue (Million), by Country 2024 & 2032
- Figure 40: China APAC Essential Oil Industry Volume (K Tons), by Country 2024 & 2032
- Figure 41: China APAC Essential Oil Industry Revenue Share (%), by Country 2024 & 2032
- Figure 42: China APAC Essential Oil Industry Volume Share (%), by Country 2024 & 2032
- Figure 43: India APAC Essential Oil Industry Revenue (Million), by Product Type 2024 & 2032
- Figure 44: India APAC Essential Oil Industry Volume (K Tons), by Product Type 2024 & 2032
- Figure 45: India APAC Essential Oil Industry Revenue Share (%), by Product Type 2024 & 2032
- Figure 46: India APAC Essential Oil Industry Volume Share (%), by Product Type 2024 & 2032
- Figure 47: India APAC Essential Oil Industry Revenue (Million), by Application 2024 & 2032
- Figure 48: India APAC Essential Oil Industry Volume (K Tons), by Application 2024 & 2032
- Figure 49: India APAC Essential Oil Industry Revenue Share (%), by Application 2024 & 2032
- Figure 50: India APAC Essential Oil Industry Volume Share (%), by Application 2024 & 2032
- Figure 51: India APAC Essential Oil Industry Revenue (Million), by Geography 2024 & 2032
- Figure 52: India APAC Essential Oil Industry Volume (K Tons), by Geography 2024 & 2032
- Figure 53: India APAC Essential Oil Industry Revenue Share (%), by Geography 2024 & 2032
- Figure 54: India APAC Essential Oil Industry Volume Share (%), by Geography 2024 & 2032
- Figure 55: India APAC Essential Oil Industry Revenue (Million), by Country 2024 & 2032
- Figure 56: India APAC Essential Oil Industry Volume (K Tons), by Country 2024 & 2032
- Figure 57: India APAC Essential Oil Industry Revenue Share (%), by Country 2024 & 2032
- Figure 58: India APAC Essential Oil Industry Volume Share (%), by Country 2024 & 2032
- Figure 59: Japan APAC Essential Oil Industry Revenue (Million), by Product Type 2024 & 2032
- Figure 60: Japan APAC Essential Oil Industry Volume (K Tons), by Product Type 2024 & 2032
- Figure 61: Japan APAC Essential Oil Industry Revenue Share (%), by Product Type 2024 & 2032
- Figure 62: Japan APAC Essential Oil Industry Volume Share (%), by Product Type 2024 & 2032
- Figure 63: Japan APAC Essential Oil Industry Revenue (Million), by Application 2024 & 2032
- Figure 64: Japan APAC Essential Oil Industry Volume (K Tons), by Application 2024 & 2032
- Figure 65: Japan APAC Essential Oil Industry Revenue Share (%), by Application 2024 & 2032
- Figure 66: Japan APAC Essential Oil Industry Volume Share (%), by Application 2024 & 2032
- Figure 67: Japan APAC Essential Oil Industry Revenue (Million), by Geography 2024 & 2032
- Figure 68: Japan APAC Essential Oil Industry Volume (K Tons), by Geography 2024 & 2032
- Figure 69: Japan APAC Essential Oil Industry Revenue Share (%), by Geography 2024 & 2032
- Figure 70: Japan APAC Essential Oil Industry Volume Share (%), by Geography 2024 & 2032
- Figure 71: Japan APAC Essential Oil Industry Revenue (Million), by Country 2024 & 2032
- Figure 72: Japan APAC Essential Oil Industry Volume (K Tons), by Country 2024 & 2032
- Figure 73: Japan APAC Essential Oil Industry Revenue Share (%), by Country 2024 & 2032
- Figure 74: Japan APAC Essential Oil Industry Volume Share (%), by Country 2024 & 2032
- Figure 75: Australia APAC Essential Oil Industry Revenue (Million), by Product Type 2024 & 2032
- Figure 76: Australia APAC Essential Oil Industry Volume (K Tons), by Product Type 2024 & 2032
- Figure 77: Australia APAC Essential Oil Industry Revenue Share (%), by Product Type 2024 & 2032
- Figure 78: Australia APAC Essential Oil Industry Volume Share (%), by Product Type 2024 & 2032
- Figure 79: Australia APAC Essential Oil Industry Revenue (Million), by Application 2024 & 2032
- Figure 80: Australia APAC Essential Oil Industry Volume (K Tons), by Application 2024 & 2032
- Figure 81: Australia APAC Essential Oil Industry Revenue Share (%), by Application 2024 & 2032
- Figure 82: Australia APAC Essential Oil Industry Volume Share (%), by Application 2024 & 2032
- Figure 83: Australia APAC Essential Oil Industry Revenue (Million), by Geography 2024 & 2032
- Figure 84: Australia APAC Essential Oil Industry Volume (K Tons), by Geography 2024 & 2032
- Figure 85: Australia APAC Essential Oil Industry Revenue Share (%), by Geography 2024 & 2032
- Figure 86: Australia APAC Essential Oil Industry Volume Share (%), by Geography 2024 & 2032
- Figure 87: Australia APAC Essential Oil Industry Revenue (Million), by Country 2024 & 2032
- Figure 88: Australia APAC Essential Oil Industry Volume (K Tons), by Country 2024 & 2032
- Figure 89: Australia APAC Essential Oil Industry Revenue Share (%), by Country 2024 & 2032
- Figure 90: Australia APAC Essential Oil Industry Volume Share (%), by Country 2024 & 2032
- Figure 91: Rest of Asia Pacific APAC Essential Oil Industry Revenue (Million), by Product Type 2024 & 2032
- Figure 92: Rest of Asia Pacific APAC Essential Oil Industry Volume (K Tons), by Product Type 2024 & 2032
- Figure 93: Rest of Asia Pacific APAC Essential Oil Industry Revenue Share (%), by Product Type 2024 & 2032
- Figure 94: Rest of Asia Pacific APAC Essential Oil Industry Volume Share (%), by Product Type 2024 & 2032
- Figure 95: Rest of Asia Pacific APAC Essential Oil Industry Revenue (Million), by Application 2024 & 2032
- Figure 96: Rest of Asia Pacific APAC Essential Oil Industry Volume (K Tons), by Application 2024 & 2032
- Figure 97: Rest of Asia Pacific APAC Essential Oil Industry Revenue Share (%), by Application 2024 & 2032
- Figure 98: Rest of Asia Pacific APAC Essential Oil Industry Volume Share (%), by Application 2024 & 2032
- Figure 99: Rest of Asia Pacific APAC Essential Oil Industry Revenue (Million), by Geography 2024 & 2032
- Figure 100: Rest of Asia Pacific APAC Essential Oil Industry Volume (K Tons), by Geography 2024 & 2032
- Figure 101: Rest of Asia Pacific APAC Essential Oil Industry Revenue Share (%), by Geography 2024 & 2032
- Figure 102: Rest of Asia Pacific APAC Essential Oil Industry Volume Share (%), by Geography 2024 & 2032
- Figure 103: Rest of Asia Pacific APAC Essential Oil Industry Revenue (Million), by Country 2024 & 2032
- Figure 104: Rest of Asia Pacific APAC Essential Oil Industry Volume (K Tons), by Country 2024 & 2032
- Figure 105: Rest of Asia Pacific APAC Essential Oil Industry Revenue Share (%), by Country 2024 & 2032
- Figure 106: Rest of Asia Pacific APAC Essential Oil Industry Volume Share (%), by Country 2024 & 2032
List of Tables
- Table 1: Global APAC Essential Oil Industry Revenue Million Forecast, by Region 2019 & 2032
- Table 2: Global APAC Essential Oil Industry Volume K Tons Forecast, by Region 2019 & 2032
- Table 3: Global APAC Essential Oil Industry Revenue Million Forecast, by Product Type 2019 & 2032
- Table 4: Global APAC Essential Oil Industry Volume K Tons Forecast, by Product Type 2019 & 2032
- Table 5: Global APAC Essential Oil Industry Revenue Million Forecast, by Application 2019 & 2032
- Table 6: Global APAC Essential Oil Industry Volume K Tons Forecast, by Application 2019 & 2032
- Table 7: Global APAC Essential Oil Industry Revenue Million Forecast, by Geography 2019 & 2032
- Table 8: Global APAC Essential Oil Industry Volume K Tons Forecast, by Geography 2019 & 2032
- Table 9: Global APAC Essential Oil Industry Revenue Million Forecast, by Region 2019 & 2032
- Table 10: Global APAC Essential Oil Industry Volume K Tons Forecast, by Region 2019 & 2032
- Table 11: Global APAC Essential Oil Industry Revenue Million Forecast, by Country 2019 & 2032
- Table 12: Global APAC Essential Oil Industry Volume K Tons Forecast, by Country 2019 & 2032
- Table 13: United States APAC Essential Oil Industry Revenue (Million) Forecast, by Application 2019 & 2032
- Table 14: United States APAC Essential Oil Industry Volume (K Tons) Forecast, by Application 2019 & 2032
- Table 15: Canada APAC Essential Oil Industry Revenue (Million) Forecast, by Application 2019 & 2032
- Table 16: Canada APAC Essential Oil Industry Volume (K Tons) Forecast, by Application 2019 & 2032
- Table 17: Mexico APAC Essential Oil Industry Revenue (Million) Forecast, by Application 2019 & 2032
- Table 18: Mexico APAC Essential Oil Industry Volume (K Tons) Forecast, by Application 2019 & 2032
- Table 19: Global APAC Essential Oil Industry Revenue Million Forecast, by Country 2019 & 2032
- Table 20: Global APAC Essential Oil Industry Volume K Tons Forecast, by Country 2019 & 2032
- Table 21: Germany APAC Essential Oil Industry Revenue (Million) Forecast, by Application 2019 & 2032
- Table 22: Germany APAC Essential Oil Industry Volume (K Tons) Forecast, by Application 2019 & 2032
- Table 23: United Kingdom APAC Essential Oil Industry Revenue (Million) Forecast, by Application 2019 & 2032
- Table 24: United Kingdom APAC Essential Oil Industry Volume (K Tons) Forecast, by Application 2019 & 2032
- Table 25: France APAC Essential Oil Industry Revenue (Million) Forecast, by Application 2019 & 2032
- Table 26: France APAC Essential Oil Industry Volume (K Tons) Forecast, by Application 2019 & 2032
- Table 27: Spain APAC Essential Oil Industry Revenue (Million) Forecast, by Application 2019 & 2032
- Table 28: Spain APAC Essential Oil Industry Volume (K Tons) Forecast, by Application 2019 & 2032
- Table 29: Italy APAC Essential Oil Industry Revenue (Million) Forecast, by Application 2019 & 2032
- Table 30: Italy APAC Essential Oil Industry Volume (K Tons) Forecast, by Application 2019 & 2032
- Table 31: Spain APAC Essential Oil Industry Revenue (Million) Forecast, by Application 2019 & 2032
- Table 32: Spain APAC Essential Oil Industry Volume (K Tons) Forecast, by Application 2019 & 2032
- Table 33: Belgium APAC Essential Oil Industry Revenue (Million) Forecast, by Application 2019 & 2032
- Table 34: Belgium APAC Essential Oil Industry Volume (K Tons) Forecast, by Application 2019 & 2032
- Table 35: Netherland APAC Essential Oil Industry Revenue (Million) Forecast, by Application 2019 & 2032
- Table 36: Netherland APAC Essential Oil Industry Volume (K Tons) Forecast, by Application 2019 & 2032
- Table 37: Nordics APAC Essential Oil Industry Revenue (Million) Forecast, by Application 2019 & 2032
- Table 38: Nordics APAC Essential Oil Industry Volume (K Tons) Forecast, by Application 2019 & 2032
- Table 39: Rest of Europe APAC Essential Oil Industry Revenue (Million) Forecast, by Application 2019 & 2032
- Table 40: Rest of Europe APAC Essential Oil Industry Volume (K Tons) Forecast, by Application 2019 & 2032
- Table 41: Global APAC Essential Oil Industry Revenue Million Forecast, by Country 2019 & 2032
- Table 42: Global APAC Essential Oil Industry Volume K Tons Forecast, by Country 2019 & 2032
- Table 43: China APAC Essential Oil Industry Revenue (Million) Forecast, by Application 2019 & 2032
- Table 44: China APAC Essential Oil Industry Volume (K Tons) Forecast, by Application 2019 & 2032
- Table 45: Japan APAC Essential Oil Industry Revenue (Million) Forecast, by Application 2019 & 2032
- Table 46: Japan APAC Essential Oil Industry Volume (K Tons) Forecast, by Application 2019 & 2032
- Table 47: India APAC Essential Oil Industry Revenue (Million) Forecast, by Application 2019 & 2032
- Table 48: India APAC Essential Oil Industry Volume (K Tons) Forecast, by Application 2019 & 2032
- Table 49: South Korea APAC Essential Oil Industry Revenue (Million) Forecast, by Application 2019 & 2032
- Table 50: South Korea APAC Essential Oil Industry Volume (K Tons) Forecast, by Application 2019 & 2032
- Table 51: Southeast Asia APAC Essential Oil Industry Revenue (Million) Forecast, by Application 2019 & 2032
- Table 52: Southeast Asia APAC Essential Oil Industry Volume (K Tons) Forecast, by Application 2019 & 2032
- Table 53: Australia APAC Essential Oil Industry Revenue (Million) Forecast, by Application 2019 & 2032
- Table 54: Australia APAC Essential Oil Industry Volume (K Tons) Forecast, by Application 2019 & 2032
- Table 55: Indonesia APAC Essential Oil Industry Revenue (Million) Forecast, by Application 2019 & 2032
- Table 56: Indonesia APAC Essential Oil Industry Volume (K Tons) Forecast, by Application 2019 & 2032
- Table 57: Phillipes APAC Essential Oil Industry Revenue (Million) Forecast, by Application 2019 & 2032
- Table 58: Phillipes APAC Essential Oil Industry Volume (K Tons) Forecast, by Application 2019 & 2032
- Table 59: Singapore APAC Essential Oil Industry Revenue (Million) Forecast, by Application 2019 & 2032
- Table 60: Singapore APAC Essential Oil Industry Volume (K Tons) Forecast, by Application 2019 & 2032
- Table 61: Thailandc APAC Essential Oil Industry Revenue (Million) Forecast, by Application 2019 & 2032
- Table 62: Thailandc APAC Essential Oil Industry Volume (K Tons) Forecast, by Application 2019 & 2032
- Table 63: Rest of Asia Pacific APAC Essential Oil Industry Revenue (Million) Forecast, by Application 2019 & 2032
- Table 64: Rest of Asia Pacific APAC Essential Oil Industry Volume (K Tons) Forecast, by Application 2019 & 2032
- Table 65: Global APAC Essential Oil Industry Revenue Million Forecast, by Country 2019 & 2032
- Table 66: Global APAC Essential Oil Industry Volume K Tons Forecast, by Country 2019 & 2032
- Table 67: Brazil APAC Essential Oil Industry Revenue (Million) Forecast, by Application 2019 & 2032
- Table 68: Brazil APAC Essential Oil Industry Volume (K Tons) Forecast, by Application 2019 & 2032
- Table 69: Argentina APAC Essential Oil Industry Revenue (Million) Forecast, by Application 2019 & 2032
- Table 70: Argentina APAC Essential Oil Industry Volume (K Tons) Forecast, by Application 2019 & 2032
- Table 71: Peru APAC Essential Oil Industry Revenue (Million) Forecast, by Application 2019 & 2032
- Table 72: Peru APAC Essential Oil Industry Volume (K Tons) Forecast, by Application 2019 & 2032
- Table 73: Chile APAC Essential Oil Industry Revenue (Million) Forecast, by Application 2019 & 2032
- Table 74: Chile APAC Essential Oil Industry Volume (K Tons) Forecast, by Application 2019 & 2032
- Table 75: Colombia APAC Essential Oil Industry Revenue (Million) Forecast, by Application 2019 & 2032
- Table 76: Colombia APAC Essential Oil Industry Volume (K Tons) Forecast, by Application 2019 & 2032
- Table 77: Ecuador APAC Essential Oil Industry Revenue (Million) Forecast, by Application 2019 & 2032
- Table 78: Ecuador APAC Essential Oil Industry Volume (K Tons) Forecast, by Application 2019 & 2032
- Table 79: Venezuela APAC Essential Oil Industry Revenue (Million) Forecast, by Application 2019 & 2032
- Table 80: Venezuela APAC Essential Oil Industry Volume (K Tons) Forecast, by Application 2019 & 2032
- Table 81: Rest of South America APAC Essential Oil Industry Revenue (Million) Forecast, by Application 2019 & 2032
- Table 82: Rest of South America APAC Essential Oil Industry Volume (K Tons) Forecast, by Application 2019 & 2032
- Table 83: Global APAC Essential Oil Industry Revenue Million Forecast, by Country 2019 & 2032
- Table 84: Global APAC Essential Oil Industry Volume K Tons Forecast, by Country 2019 & 2032
- Table 85: United States APAC Essential Oil Industry Revenue (Million) Forecast, by Application 2019 & 2032
- Table 86: United States APAC Essential Oil Industry Volume (K Tons) Forecast, by Application 2019 & 2032
- Table 87: Canada APAC Essential Oil Industry Revenue (Million) Forecast, by Application 2019 & 2032
- Table 88: Canada APAC Essential Oil Industry Volume (K Tons) Forecast, by Application 2019 & 2032
- Table 89: Mexico APAC Essential Oil Industry Revenue (Million) Forecast, by Application 2019 & 2032
- Table 90: Mexico APAC Essential Oil Industry Volume (K Tons) Forecast, by Application 2019 & 2032
- Table 91: Global APAC Essential Oil Industry Revenue Million Forecast, by Country 2019 & 2032
- Table 92: Global APAC Essential Oil Industry Volume K Tons Forecast, by Country 2019 & 2032
- Table 93: United Arab Emirates APAC Essential Oil Industry Revenue (Million) Forecast, by Application 2019 & 2032
- Table 94: United Arab Emirates APAC Essential Oil Industry Volume (K Tons) Forecast, by Application 2019 & 2032
- Table 95: Saudi Arabia APAC Essential Oil Industry Revenue (Million) Forecast, by Application 2019 & 2032
- Table 96: Saudi Arabia APAC Essential Oil Industry Volume (K Tons) Forecast, by Application 2019 & 2032
- Table 97: South Africa APAC Essential Oil Industry Revenue (Million) Forecast, by Application 2019 & 2032
- Table 98: South Africa APAC Essential Oil Industry Volume (K Tons) Forecast, by Application 2019 & 2032
- Table 99: Rest of Middle East and Africa APAC Essential Oil Industry Revenue (Million) Forecast, by Application 2019 & 2032
- Table 100: Rest of Middle East and Africa APAC Essential Oil Industry Volume (K Tons) Forecast, by Application 2019 & 2032
- Table 101: Global APAC Essential Oil Industry Revenue Million Forecast, by Product Type 2019 & 2032
- Table 102: Global APAC Essential Oil Industry Volume K Tons Forecast, by Product Type 2019 & 2032
- Table 103: Global APAC Essential Oil Industry Revenue Million Forecast, by Application 2019 & 2032
- Table 104: Global APAC Essential Oil Industry Volume K Tons Forecast, by Application 2019 & 2032
- Table 105: Global APAC Essential Oil Industry Revenue Million Forecast, by Geography 2019 & 2032
- Table 106: Global APAC Essential Oil Industry Volume K Tons Forecast, by Geography 2019 & 2032
- Table 107: Global APAC Essential Oil Industry Revenue Million Forecast, by Country 2019 & 2032
- Table 108: Global APAC Essential Oil Industry Volume K Tons Forecast, by Country 2019 & 2032
- Table 109: Global APAC Essential Oil Industry Revenue Million Forecast, by Product Type 2019 & 2032
- Table 110: Global APAC Essential Oil Industry Volume K Tons Forecast, by Product Type 2019 & 2032
- Table 111: Global APAC Essential Oil Industry Revenue Million Forecast, by Application 2019 & 2032
- Table 112: Global APAC Essential Oil Industry Volume K Tons Forecast, by Application 2019 & 2032
- Table 113: Global APAC Essential Oil Industry Revenue Million Forecast, by Geography 2019 & 2032
- Table 114: Global APAC Essential Oil Industry Volume K Tons Forecast, by Geography 2019 & 2032
- Table 115: Global APAC Essential Oil Industry Revenue Million Forecast, by Country 2019 & 2032
- Table 116: Global APAC Essential Oil Industry Volume K Tons Forecast, by Country 2019 & 2032
- Table 117: Global APAC Essential Oil Industry Revenue Million Forecast, by Product Type 2019 & 2032
- Table 118: Global APAC Essential Oil Industry Volume K Tons Forecast, by Product Type 2019 & 2032
- Table 119: Global APAC Essential Oil Industry Revenue Million Forecast, by Application 2019 & 2032
- Table 120: Global APAC Essential Oil Industry Volume K Tons Forecast, by Application 2019 & 2032
- Table 121: Global APAC Essential Oil Industry Revenue Million Forecast, by Geography 2019 & 2032
- Table 122: Global APAC Essential Oil Industry Volume K Tons Forecast, by Geography 2019 & 2032
- Table 123: Global APAC Essential Oil Industry Revenue Million Forecast, by Country 2019 & 2032
- Table 124: Global APAC Essential Oil Industry Volume K Tons Forecast, by Country 2019 & 2032
- Table 125: Global APAC Essential Oil Industry Revenue Million Forecast, by Product Type 2019 & 2032
- Table 126: Global APAC Essential Oil Industry Volume K Tons Forecast, by Product Type 2019 & 2032
- Table 127: Global APAC Essential Oil Industry Revenue Million Forecast, by Application 2019 & 2032
- Table 128: Global APAC Essential Oil Industry Volume K Tons Forecast, by Application 2019 & 2032
- Table 129: Global APAC Essential Oil Industry Revenue Million Forecast, by Geography 2019 & 2032
- Table 130: Global APAC Essential Oil Industry Volume K Tons Forecast, by Geography 2019 & 2032
- Table 131: Global APAC Essential Oil Industry Revenue Million Forecast, by Country 2019 & 2032
- Table 132: Global APAC Essential Oil Industry Volume K Tons Forecast, by Country 2019 & 2032
- Table 133: Global APAC Essential Oil Industry Revenue Million Forecast, by Product Type 2019 & 2032
- Table 134: Global APAC Essential Oil Industry Volume K Tons Forecast, by Product Type 2019 & 2032
- Table 135: Global APAC Essential Oil Industry Revenue Million Forecast, by Application 2019 & 2032
- Table 136: Global APAC Essential Oil Industry Volume K Tons Forecast, by Application 2019 & 2032
- Table 137: Global APAC Essential Oil Industry Revenue Million Forecast, by Geography 2019 & 2032
- Table 138: Global APAC Essential Oil Industry Volume K Tons Forecast, by Geography 2019 & 2032
- Table 139: Global APAC Essential Oil Industry Revenue Million Forecast, by Country 2019 & 2032
- Table 140: Global APAC Essential Oil Industry Volume K Tons Forecast, by Country 2019 & 2032
Frequently Asked Questions
1. What is the projected Compound Annual Growth Rate (CAGR) of the APAC Essential Oil Industry?
The projected CAGR is approximately 8.21%.
2. Which companies are prominent players in the APAC Essential Oil Industry?
Key companies in the market include Do Terra, Organic Harvest, Springfields Australia, Tilley Aroma Natural, Bella Vita*List Not Exhaustive, In Essence, Young Living Essentials, Auroma, AT-Aroma Co Ltd, Ultra International BV, Aroma Treasures.
3. What are the main segments of the APAC Essential Oil Industry?
The market segments include Product Type, Application, Geography.
4. Can you provide details about the market size?
The market size is estimated to be USD 2.26 Million as of 2022.
5. What are some drivers contributing to market growth?
Increasing awareness towards fitness among consumers; Demand for convenient fortified foods.
6. What are the notable trends driving market growth?
Increasing Awareness Toward the Health Benefits of Essential Oil.
7. Are there any restraints impacting market growth?
Increasing vegan culture in the market.
8. Can you provide examples of recent developments in the market?
October 2022: doTERRA introduced a new wellness product that combines pure essential oils, sustainable sourcing, and evidence-based research. Helichrysum touch, LaLuz Diffuser, Roam Diffuser, Dawn Aroma Humidifier, Balance Bath Bar, On Guard Toothpaste, and On Guard Hand Wipes are among the new products.
9. What pricing options are available for accessing the report?
Pricing options include single-user, multi-user, and enterprise licenses priced at USD 4750, USD 5250, and USD 8750 respectively.
10. Is the market size provided in terms of value or volume?
The market size is provided in terms of value, measured in Million and volume, measured in K Tons.
11. Are there any specific market keywords associated with the report?
Yes, the market keyword associated with the report is "APAC Essential Oil Industry," which aids in identifying and referencing the specific market segment covered.
12. How do I determine which pricing option suits my needs best?
The pricing options vary based on user requirements and access needs. Individual users may opt for single-user licenses, while businesses requiring broader access may choose multi-user or enterprise licenses for cost-effective access to the report.
13. Are there any additional resources or data provided in the APAC Essential Oil Industry report?
While the report offers comprehensive insights, it's advisable to review the specific contents or supplementary materials provided to ascertain if additional resources or data are available.
14. How can I stay updated on further developments or reports in the APAC Essential Oil Industry?
To stay informed about further developments, trends, and reports in the APAC Essential Oil Industry, consider subscribing to industry newsletters, following relevant companies and organizations, or regularly checking reputable industry news sources and publications.
Methodology
Step 1 - Identification of Relevant Samples Size from Population Database


Step 2 - Approaches for Defining Global Market Size (Value, Volume* & Price*)

Note*: In applicable scenarios
Step 3 - Data Sources
Primary Research
- Web Analytics
- Survey Reports
- Research Institute
- Latest Research Reports
- Opinion Leaders
Secondary Research
- Annual Reports
- White Paper
- Latest Press Release
- Industry Association
- Paid Database
- Investor Presentations

Step 4 - Data Triangulation
Involves using different sources of information in order to increase the validity of a study
These sources are likely to be stakeholders in a program - participants, other researchers, program staff, other community members, and so on.
Then we put all data in single framework & apply various statistical tools to find out the dynamic on the market.
During the analysis stage, feedback from the stakeholder groups would be compared to determine areas of agreement as well as areas of divergence


