Key Insights
The Asia-Pacific (APAC) industrial air cleaner market is experiencing robust growth, driven by increasing industrialization, stringent government regulations on air quality, and rising awareness of occupational health hazards. The market's Compound Annual Growth Rate (CAGR) exceeding 4.00% indicates a sustained expansion trajectory through 2033. Key segments within this market include HEPA filtration technology, which dominates due to its superior efficiency in removing particulate matter, and stand-alone units, preferred for their flexibility and ease of deployment in diverse industrial settings. Significant growth is projected within the industrial end-user segment, fueled by the expansion of manufacturing sectors in China, India, and Southeast Asia. These regions are witnessing a surge in demand for effective air purification solutions across various industries, including manufacturing, pharmaceuticals, and electronics. The market is highly competitive, with both established international players like Dyson, Honeywell, and Daikin, and regional manufacturers vying for market share. Challenges remain, including high initial investment costs for advanced air cleaners and the need for ongoing maintenance. However, the long-term benefits in terms of improved worker health, reduced operational disruptions, and compliance with environmental regulations are driving sustained market expansion.
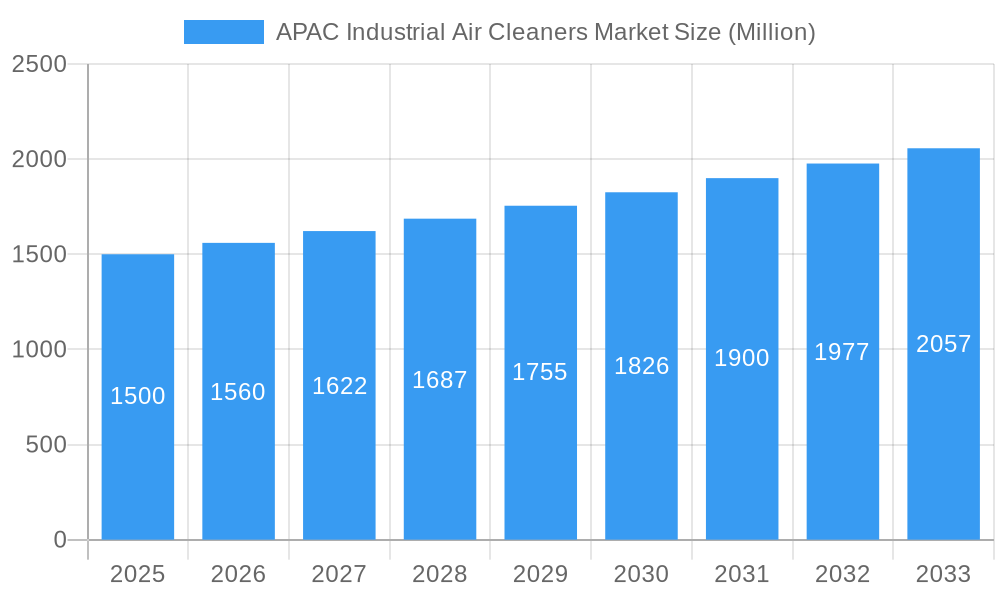
APAC Industrial Air Cleaners Market Market Size (In Billion)
Growth within the APAC industrial air cleaner market is further propelled by technological advancements leading to more energy-efficient and compact air cleaning solutions. The increasing adoption of smart technologies and IoT integration is enhancing monitoring capabilities and predictive maintenance, contributing to lower operational costs. Furthermore, government initiatives promoting cleaner production practices and sustainable manufacturing are bolstering demand for advanced air purification systems. While pricing remains a factor influencing adoption rates, particularly among smaller businesses, the increasing awareness of the health and economic benefits associated with clean air is gradually mitigating this barrier. Specific regional variations in market dynamics exist, with China and India representing the largest market segments due to their extensive manufacturing bases and growing environmental awareness. Nevertheless, other countries within Southeast Asia are also showing significant growth potential, driven by economic development and increasing industrial activity.
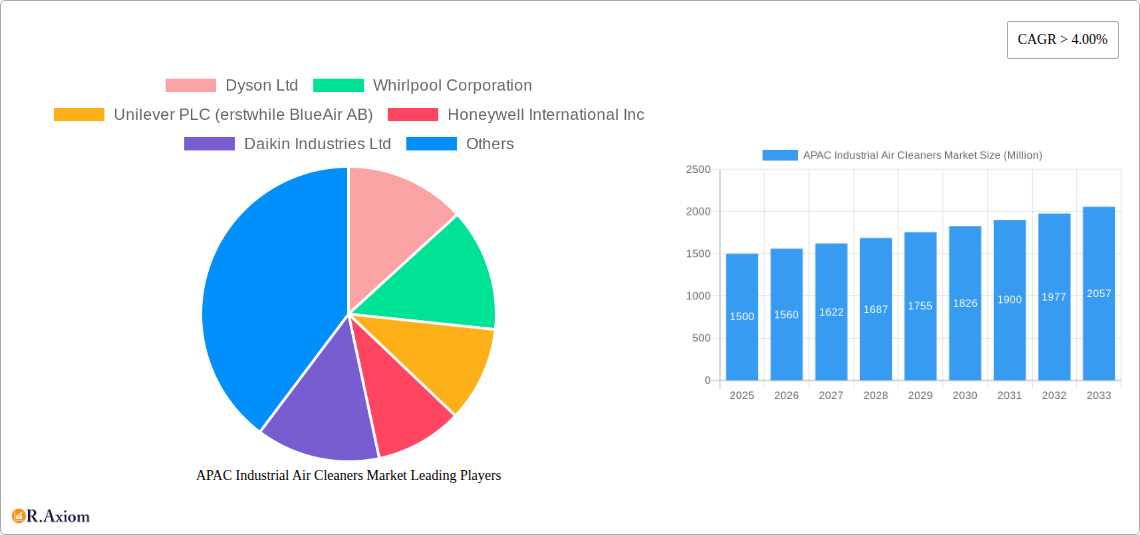
APAC Industrial Air Cleaners Market Company Market Share
APAC Industrial Air Cleaners Market: A Comprehensive Report (2019-2033)
This in-depth report provides a comprehensive analysis of the Asia-Pacific (APAC) industrial air cleaners market, covering the period from 2019 to 2033. It offers actionable insights into market dynamics, competitive landscapes, and future growth opportunities, equipping stakeholders with the knowledge needed to navigate this rapidly evolving sector. The report utilizes data from the historical period (2019-2024), the base year (2025), and projects the market's trajectory through the forecast period (2025-2033). Market values are expressed in Millions.
APAC Industrial Air Cleaners Market Concentration & Innovation
The APAC industrial air cleaners market exhibits a moderately concentrated landscape, with several key players holding significant market share. Market concentration is influenced by factors such as brand recognition, technological innovation, and distribution networks. While exact market share figures for individual companies require further analysis, companies like Dyson Ltd, Whirlpool Corporation, Unilever PLC (erstwhile BlueAir AB), Honeywell International Inc, Daikin Industries Ltd, LG Electronics Inc, Samsung Electronics Co Ltd, Xiaomi Corp, Koninklijke Philips NV, Panasonic Corporation, and IQAir hold prominent positions. Smaller, niche players also contribute to the market's diversity.
Innovation is a key driver, fueled by the increasing demand for cleaner air and stricter environmental regulations. HEPA filtration technology remains dominant, but advancements in other technologies are emerging, leading to improved efficiency and features. The market is witnessing significant M&A activity, with deal values varying considerably depending on the size and strategic importance of the acquired company. Specific deal values and details require further investigation; xx Million in M&A activity was observed within the period xx to xx, with notable transactions including (details require further investigation). The regulatory landscape also plays a crucial role, shaping product standards and driving innovation towards compliance. Substitution potential currently remains limited due to the specialized nature of these products. End-user trends towards improved indoor air quality and sustainability are also pushing innovation.
APAC Industrial Air Cleaners Market Industry Trends & Insights
The APAC industrial air cleaners market is experiencing robust growth, driven by rising industrialization, increasing urbanization, and growing awareness of air pollution's health impacts. The market witnessed a CAGR of xx% during the historical period (2019-2024) and is projected to maintain a CAGR of xx% during the forecast period (2025-2033). This growth is significantly influenced by rapid economic expansion in several APAC nations and government initiatives promoting better air quality. Market penetration is highest in developed economies within the region, but developing economies are exhibiting rapid growth due to increased disposable incomes and rising environmental concerns. Technological disruptions, such as the introduction of smart air purifiers with IoT capabilities and advanced sensor technologies, are reshaping the market. Consumer preferences are shifting towards energy-efficient, quiet, and aesthetically pleasing air cleaners. The competitive landscape is dynamic, with both established players and new entrants vying for market share. Price competition and product differentiation are key strategies employed by market participants.
Dominant Markets & Segments in APAC Industrial Air Cleaners Market
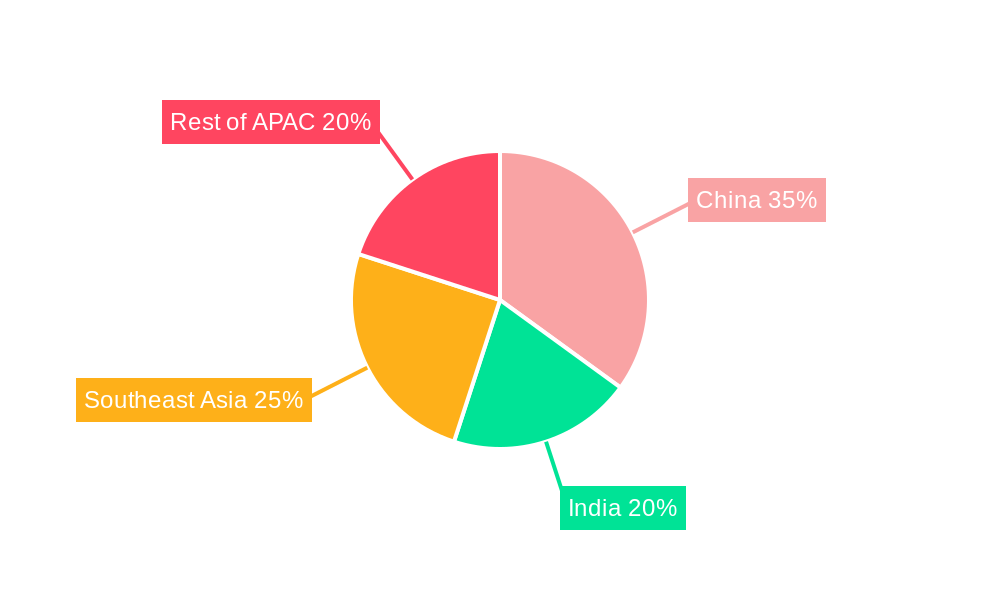
- Leading Region/Country: China is the dominant market within APAC due to its large industrial base, high pollution levels, and increasing demand for clean air solutions. Other key markets include India, Japan, South Korea, and Singapore. Key drivers for dominance include robust economic growth, supportive government policies focusing on environmental protection and stringent emission norms.
- Filtration Technology: HEPA filtration technology dominates the market due to its high efficiency in removing particulate matter. However, other technologies, including activated carbon filters and electrostatic precipitators, are gaining traction, driven by their cost-effectiveness and suitability for specific applications.
- Type: Stand-alone air cleaners currently hold a larger market share compared to in-duct systems due to their versatility and ease of installation. However, in-duct systems are gaining popularity in commercial and industrial settings due to their superior air filtration capabilities.
- End User: The industrial segment is experiencing significant growth owing to strict regulatory norms, the growing adoption of sophisticated air filtration systems in manufacturing plants, and a greater understanding of employee health and safety. The commercial segment is also expanding rapidly due to increased demand for cleaner indoor air quality in offices, malls, and public spaces. The residential segment constitutes a sizeable portion of the market, fueled by increasing awareness among consumers regarding air quality and health concerns.
APAC Industrial Air Cleaners Market Product Developments
Recent product innovations focus on improving filtration efficiency, reducing energy consumption, enhancing smart features (connectivity, air quality monitoring), and integrating air purification with other home appliances. These developments cater to the evolving needs of consumers and industries, offering increased convenience, performance, and energy savings. Companies are focusing on developing compact, stylish, and user-friendly designs to enhance market acceptance. The competitive advantage lies in delivering superior performance, unique features, and competitive pricing.
Report Scope & Segmentation Analysis
This report segments the APAC industrial air cleaners market based on filtration technology (HEPA, other technologies), type (stand-alone, in-duct), and end-user (residential, commercial, industrial). Each segment's growth projections, market sizes, and competitive dynamics are analyzed separately. For example, the HEPA filter segment is expected to maintain a substantial market share owing to its efficacy. Similarly, the stand-alone segment is anticipated to witness healthy growth compared to the in-duct segment due to ease of installation and versatility. The industrial end-user segment is projected to show high growth rates driven by stringent regulatory compliance demands and a greater focus on workplace safety.
Key Drivers of APAC Industrial Air Cleaners Market Growth
The APAC industrial air cleaners market's growth is driven by several factors: stringent government regulations aimed at improving air quality; rising awareness regarding the health risks of air pollution; increasing disposable incomes, particularly in developing economies, leading to higher spending on health and wellness products; the growth of industries leading to increased demand in industrial settings, and technological advancements leading to the development of more efficient and feature-rich air purifiers.
Challenges in the APAC Industrial Air Cleaners Market Sector
Challenges facing the market include the high initial investment cost of air cleaners; the fluctuating price of raw materials impacting production costs; the complexity of regulations across different countries within APAC leading to difficulties in compliance; intense competition from various players with a focus on price and differentiation; and concerns about the disposal and recycling of filter materials. These factors can impact market growth to varying degrees (estimated xx% impact by xx).
Emerging Opportunities in APAP Industrial Air Cleaners Market
Emerging opportunities lie in developing energy-efficient and smart air purifiers integrating IoT and AI features for enhanced user experience. The focus on customized solutions for specific industrial applications presents a substantial opportunity for growth. Expanding into underserved markets across rural areas and expanding product offerings suitable for diverse climates present new avenues for growth. Further, the rising focus on sustainable manufacturing and eco-friendly filter materials is an important area of future development.
Leading Players in the APAC Industrial Air Cleaners Market Market
- Dyson Ltd
- Whirlpool Corporation
- Unilever PLC (erstwhile BlueAir AB)
- Honeywell International Inc
- Daikin Industries Ltd
- LG Electronics Inc
- AllerAir Industries Inc
- Samsung Electronics Co Ltd
- Xiaomi Corp
- Koninklijke Philips NV
- Panasonic Corporation
- IQAir
Key Developments in APAC Industrial Air Cleaners Market Industry
- November 2022: Havells Studio launched the Meditate air purifier, verified by Equinox Lab for efficacy against gaseous pollutants and microorganisms. This launch strengthened their product portfolio and targeted the health-conscious segment.
- November 2022: Samsung launched the AX46 and AX32 air purifiers in India, emphasizing their ability to remove 99.97% of nano-sized particles, dust, bacteria, and allergens. This highlights the trend towards more efficient and effective air purification solutions.
Strategic Outlook for APAC Industrial Air Cleaners Market Market
The APAC industrial air cleaners market holds significant future potential, driven by continued urbanization, industrial expansion, and a heightened focus on environmental sustainability. Growth will be fueled by technological advancements, government regulations, and increasing consumer awareness. Companies focusing on innovation, sustainable practices, and market diversification will be well-positioned to capitalize on the substantial opportunities presented by this dynamic market.
APAC Industrial Air Cleaners Market Segmentation
-
1. Filtration Technology
- 1.1. High-efficiency Particulate Air (HEPA)
- 1.2. Other Technologies
-
2. Type
- 2.1. Stand-alone
- 2.2. In-duct
-
3. End User
- 3.1. Residential
- 3.2. Commercial
- 3.3. Industrial
-
4. Geography
- 4.1. China
- 4.2. India
- 4.3. Japan
- 4.4. Rest of Asia-Pacific
APAC Industrial Air Cleaners Market Segmentation By Geography
- 1. China
- 2. India
- 3. Japan
- 4. Rest of Asia Pacific
APAC Industrial Air Cleaners Market Regional Market Share
Geographic Coverage of APAC Industrial Air Cleaners Market
APAC Industrial Air Cleaners Market REPORT HIGHLIGHTS
| Aspects | Details |
|---|---|
| Study Period | 2020-2034 |
| Base Year | 2025 |
| Estimated Year | 2026 |
| Forecast Period | 2026-2034 |
| Historical Period | 2020-2025 |
| Growth Rate | CAGR of 7.3% from 2020-2034 |
| Segmentation |
|
Table of Contents
- 1. Introduction
- 1.1. Research Scope
- 1.2. Market Segmentation
- 1.3. Research Objective
- 1.4. Definitions and Assumptions
- 2. Executive Summary
- 2.1. Market Snapshot
- 3. Market Dynamics
- 3.1. Market Drivers
- 3.2. Market Restrains
- 3.3. Market Trends
- 3.4. Market Opportunities
- 4. Market Factor Analysis
- 4.1. Porters Five Forces
- 4.1.1. Bargaining Power of Suppliers
- 4.1.2. Bargaining Power of Buyers
- 4.1.3. Threat of New Entrants
- 4.1.4. Threat of Substitutes
- 4.1.5. Competitive Rivalry
- 4.2. PESTEL analysis
- 4.3. BCG Analysis
- 4.3.1. Stars (High Growth, High Market Share)
- 4.3.2. Cash Cows (Low Growth, High Market Share)
- 4.3.3. Question Mark (High Growth, Low Market Share)
- 4.3.4. Dogs (Low Growth, Low Market Share)
- 4.4. Ansoff Matrix Analysis
- 4.5. Supply Chain Analysis
- 4.6. Regulatory Landscape
- 4.7. Current Market Potential and Opportunity Assessment (TAM–SAM–SOM Framework)
- 4.8. RAX Analyst Note
- 4.1. Porters Five Forces
- 5. Market Analysis, Insights and Forecast 2021-2033
- 5.1. Market Analysis, Insights and Forecast - by Filtration Technology
- 5.1.1. High-efficiency Particulate Air (HEPA)
- 5.1.2. Other Technologies
- 5.2. Market Analysis, Insights and Forecast - by Type
- 5.2.1. Stand-alone
- 5.2.2. In-duct
- 5.3. Market Analysis, Insights and Forecast - by End User
- 5.3.1. Residential
- 5.3.2. Commercial
- 5.3.3. Industrial
- 5.4. Market Analysis, Insights and Forecast - by Geography
- 5.4.1. China
- 5.4.2. India
- 5.4.3. Japan
- 5.4.4. Rest of Asia-Pacific
- 5.5. Market Analysis, Insights and Forecast - by Region
- 5.5.1. China
- 5.5.2. India
- 5.5.3. Japan
- 5.5.4. Rest of Asia Pacific
- 5.1. Market Analysis, Insights and Forecast - by Filtration Technology
- 6. Global APAC Industrial Air Cleaners Market Analysis, Insights and Forecast, 2021-2033
- 6.1. Market Analysis, Insights and Forecast - by Filtration Technology
- 6.1.1. High-efficiency Particulate Air (HEPA)
- 6.1.2. Other Technologies
- 6.2. Market Analysis, Insights and Forecast - by Type
- 6.2.1. Stand-alone
- 6.2.2. In-duct
- 6.3. Market Analysis, Insights and Forecast - by End User
- 6.3.1. Residential
- 6.3.2. Commercial
- 6.3.3. Industrial
- 6.4. Market Analysis, Insights and Forecast - by Geography
- 6.4.1. China
- 6.4.2. India
- 6.4.3. Japan
- 6.4.4. Rest of Asia-Pacific
- 6.1. Market Analysis, Insights and Forecast - by Filtration Technology
- 7. China APAC Industrial Air Cleaners Market Analysis, Insights and Forecast, 2020-2032
- 7.1. Market Analysis, Insights and Forecast - by Filtration Technology
- 7.1.1. High-efficiency Particulate Air (HEPA)
- 7.1.2. Other Technologies
- 7.2. Market Analysis, Insights and Forecast - by Type
- 7.2.1. Stand-alone
- 7.2.2. In-duct
- 7.3. Market Analysis, Insights and Forecast - by End User
- 7.3.1. Residential
- 7.3.2. Commercial
- 7.3.3. Industrial
- 7.4. Market Analysis, Insights and Forecast - by Geography
- 7.4.1. China
- 7.4.2. India
- 7.4.3. Japan
- 7.4.4. Rest of Asia-Pacific
- 7.1. Market Analysis, Insights and Forecast - by Filtration Technology
- 8. India APAC Industrial Air Cleaners Market Analysis, Insights and Forecast, 2020-2032
- 8.1. Market Analysis, Insights and Forecast - by Filtration Technology
- 8.1.1. High-efficiency Particulate Air (HEPA)
- 8.1.2. Other Technologies
- 8.2. Market Analysis, Insights and Forecast - by Type
- 8.2.1. Stand-alone
- 8.2.2. In-duct
- 8.3. Market Analysis, Insights and Forecast - by End User
- 8.3.1. Residential
- 8.3.2. Commercial
- 8.3.3. Industrial
- 8.4. Market Analysis, Insights and Forecast - by Geography
- 8.4.1. China
- 8.4.2. India
- 8.4.3. Japan
- 8.4.4. Rest of Asia-Pacific
- 8.1. Market Analysis, Insights and Forecast - by Filtration Technology
- 9. Japan APAC Industrial Air Cleaners Market Analysis, Insights and Forecast, 2020-2032
- 9.1. Market Analysis, Insights and Forecast - by Filtration Technology
- 9.1.1. High-efficiency Particulate Air (HEPA)
- 9.1.2. Other Technologies
- 9.2. Market Analysis, Insights and Forecast - by Type
- 9.2.1. Stand-alone
- 9.2.2. In-duct
- 9.3. Market Analysis, Insights and Forecast - by End User
- 9.3.1. Residential
- 9.3.2. Commercial
- 9.3.3. Industrial
- 9.4. Market Analysis, Insights and Forecast - by Geography
- 9.4.1. China
- 9.4.2. India
- 9.4.3. Japan
- 9.4.4. Rest of Asia-Pacific
- 9.1. Market Analysis, Insights and Forecast - by Filtration Technology
- 10. Rest of Asia Pacific APAC Industrial Air Cleaners Market Analysis, Insights and Forecast, 2020-2032
- 10.1. Market Analysis, Insights and Forecast - by Filtration Technology
- 10.1.1. High-efficiency Particulate Air (HEPA)
- 10.1.2. Other Technologies
- 10.2. Market Analysis, Insights and Forecast - by Type
- 10.2.1. Stand-alone
- 10.2.2. In-duct
- 10.3. Market Analysis, Insights and Forecast - by End User
- 10.3.1. Residential
- 10.3.2. Commercial
- 10.3.3. Industrial
- 10.4. Market Analysis, Insights and Forecast - by Geography
- 10.4.1. China
- 10.4.2. India
- 10.4.3. Japan
- 10.4.4. Rest of Asia-Pacific
- 10.1. Market Analysis, Insights and Forecast - by Filtration Technology
- 11. Competitive Analysis
- 11.1. Company Profiles
- 11.1.1 Dyson Ltd
- 11.1.1.1. Company Overview
- 11.1.1.2. Products
- 11.1.1.3. Company Financials
- 11.1.1.4. SWOT Analysis
- 11.1.2 Whirlpool Corporation
- 11.1.2.1. Company Overview
- 11.1.2.2. Products
- 11.1.2.3. Company Financials
- 11.1.2.4. SWOT Analysis
- 11.1.3 Unilever PLC (erstwhile BlueAir AB)
- 11.1.3.1. Company Overview
- 11.1.3.2. Products
- 11.1.3.3. Company Financials
- 11.1.3.4. SWOT Analysis
- 11.1.4 Honeywell International Inc
- 11.1.4.1. Company Overview
- 11.1.4.2. Products
- 11.1.4.3. Company Financials
- 11.1.4.4. SWOT Analysis
- 11.1.5 Daikin Industries Ltd
- 11.1.5.1. Company Overview
- 11.1.5.2. Products
- 11.1.5.3. Company Financials
- 11.1.5.4. SWOT Analysis
- 11.1.6 LG Electronics Inc
- 11.1.6.1. Company Overview
- 11.1.6.2. Products
- 11.1.6.3. Company Financials
- 11.1.6.4. SWOT Analysis
- 11.1.7 AllerAir Industries Inc*List Not Exhaustive
- 11.1.7.1. Company Overview
- 11.1.7.2. Products
- 11.1.7.3. Company Financials
- 11.1.7.4. SWOT Analysis
- 11.1.8 Samsung Electronics Co Ltd
- 11.1.8.1. Company Overview
- 11.1.8.2. Products
- 11.1.8.3. Company Financials
- 11.1.8.4. SWOT Analysis
- 11.1.9 Xiaomi Corp
- 11.1.9.1. Company Overview
- 11.1.9.2. Products
- 11.1.9.3. Company Financials
- 11.1.9.4. SWOT Analysis
- 11.1.10 Koninklijke Philips NV
- 11.1.10.1. Company Overview
- 11.1.10.2. Products
- 11.1.10.3. Company Financials
- 11.1.10.4. SWOT Analysis
- 11.1.11 Panasonic Corporation
- 11.1.11.1. Company Overview
- 11.1.11.2. Products
- 11.1.11.3. Company Financials
- 11.1.11.4. SWOT Analysis
- 11.1.12 IQAir
- 11.1.12.1. Company Overview
- 11.1.12.2. Products
- 11.1.12.3. Company Financials
- 11.1.12.4. SWOT Analysis
- 11.1.1 Dyson Ltd
- 11.2. Market Entropy
- 11.2.1 Company's Key Areas Served
- 11.2.2 Recent Developments
- 11.3. Company Market Share Analysis 2025
- 11.3.1 Top 5 Companies Market Share Analysis
- 11.3.2 Top 3 Companies Market Share Analysis
- 11.4. List of Potential Customers
- 12. Research Methodology
List of Figures
- Figure 1: Global APAC Industrial Air Cleaners Market Revenue Breakdown (million, %) by Region 2025 & 2033
- Figure 2: Global APAC Industrial Air Cleaners Market Volume Breakdown (K Unit, %) by Region 2025 & 2033
- Figure 3: China APAC Industrial Air Cleaners Market Revenue (million), by Filtration Technology 2025 & 2033
- Figure 4: China APAC Industrial Air Cleaners Market Volume (K Unit), by Filtration Technology 2025 & 2033
- Figure 5: China APAC Industrial Air Cleaners Market Revenue Share (%), by Filtration Technology 2025 & 2033
- Figure 6: China APAC Industrial Air Cleaners Market Volume Share (%), by Filtration Technology 2025 & 2033
- Figure 7: China APAC Industrial Air Cleaners Market Revenue (million), by Type 2025 & 2033
- Figure 8: China APAC Industrial Air Cleaners Market Volume (K Unit), by Type 2025 & 2033
- Figure 9: China APAC Industrial Air Cleaners Market Revenue Share (%), by Type 2025 & 2033
- Figure 10: China APAC Industrial Air Cleaners Market Volume Share (%), by Type 2025 & 2033
- Figure 11: China APAC Industrial Air Cleaners Market Revenue (million), by End User 2025 & 2033
- Figure 12: China APAC Industrial Air Cleaners Market Volume (K Unit), by End User 2025 & 2033
- Figure 13: China APAC Industrial Air Cleaners Market Revenue Share (%), by End User 2025 & 2033
- Figure 14: China APAC Industrial Air Cleaners Market Volume Share (%), by End User 2025 & 2033
- Figure 15: China APAC Industrial Air Cleaners Market Revenue (million), by Geography 2025 & 2033
- Figure 16: China APAC Industrial Air Cleaners Market Volume (K Unit), by Geography 2025 & 2033
- Figure 17: China APAC Industrial Air Cleaners Market Revenue Share (%), by Geography 2025 & 2033
- Figure 18: China APAC Industrial Air Cleaners Market Volume Share (%), by Geography 2025 & 2033
- Figure 19: China APAC Industrial Air Cleaners Market Revenue (million), by Country 2025 & 2033
- Figure 20: China APAC Industrial Air Cleaners Market Volume (K Unit), by Country 2025 & 2033
- Figure 21: China APAC Industrial Air Cleaners Market Revenue Share (%), by Country 2025 & 2033
- Figure 22: China APAC Industrial Air Cleaners Market Volume Share (%), by Country 2025 & 2033
- Figure 23: India APAC Industrial Air Cleaners Market Revenue (million), by Filtration Technology 2025 & 2033
- Figure 24: India APAC Industrial Air Cleaners Market Volume (K Unit), by Filtration Technology 2025 & 2033
- Figure 25: India APAC Industrial Air Cleaners Market Revenue Share (%), by Filtration Technology 2025 & 2033
- Figure 26: India APAC Industrial Air Cleaners Market Volume Share (%), by Filtration Technology 2025 & 2033
- Figure 27: India APAC Industrial Air Cleaners Market Revenue (million), by Type 2025 & 2033
- Figure 28: India APAC Industrial Air Cleaners Market Volume (K Unit), by Type 2025 & 2033
- Figure 29: India APAC Industrial Air Cleaners Market Revenue Share (%), by Type 2025 & 2033
- Figure 30: India APAC Industrial Air Cleaners Market Volume Share (%), by Type 2025 & 2033
- Figure 31: India APAC Industrial Air Cleaners Market Revenue (million), by End User 2025 & 2033
- Figure 32: India APAC Industrial Air Cleaners Market Volume (K Unit), by End User 2025 & 2033
- Figure 33: India APAC Industrial Air Cleaners Market Revenue Share (%), by End User 2025 & 2033
- Figure 34: India APAC Industrial Air Cleaners Market Volume Share (%), by End User 2025 & 2033
- Figure 35: India APAC Industrial Air Cleaners Market Revenue (million), by Geography 2025 & 2033
- Figure 36: India APAC Industrial Air Cleaners Market Volume (K Unit), by Geography 2025 & 2033
- Figure 37: India APAC Industrial Air Cleaners Market Revenue Share (%), by Geography 2025 & 2033
- Figure 38: India APAC Industrial Air Cleaners Market Volume Share (%), by Geography 2025 & 2033
- Figure 39: India APAC Industrial Air Cleaners Market Revenue (million), by Country 2025 & 2033
- Figure 40: India APAC Industrial Air Cleaners Market Volume (K Unit), by Country 2025 & 2033
- Figure 41: India APAC Industrial Air Cleaners Market Revenue Share (%), by Country 2025 & 2033
- Figure 42: India APAC Industrial Air Cleaners Market Volume Share (%), by Country 2025 & 2033
- Figure 43: Japan APAC Industrial Air Cleaners Market Revenue (million), by Filtration Technology 2025 & 2033
- Figure 44: Japan APAC Industrial Air Cleaners Market Volume (K Unit), by Filtration Technology 2025 & 2033
- Figure 45: Japan APAC Industrial Air Cleaners Market Revenue Share (%), by Filtration Technology 2025 & 2033
- Figure 46: Japan APAC Industrial Air Cleaners Market Volume Share (%), by Filtration Technology 2025 & 2033
- Figure 47: Japan APAC Industrial Air Cleaners Market Revenue (million), by Type 2025 & 2033
- Figure 48: Japan APAC Industrial Air Cleaners Market Volume (K Unit), by Type 2025 & 2033
- Figure 49: Japan APAC Industrial Air Cleaners Market Revenue Share (%), by Type 2025 & 2033
- Figure 50: Japan APAC Industrial Air Cleaners Market Volume Share (%), by Type 2025 & 2033
- Figure 51: Japan APAC Industrial Air Cleaners Market Revenue (million), by End User 2025 & 2033
- Figure 52: Japan APAC Industrial Air Cleaners Market Volume (K Unit), by End User 2025 & 2033
- Figure 53: Japan APAC Industrial Air Cleaners Market Revenue Share (%), by End User 2025 & 2033
- Figure 54: Japan APAC Industrial Air Cleaners Market Volume Share (%), by End User 2025 & 2033
- Figure 55: Japan APAC Industrial Air Cleaners Market Revenue (million), by Geography 2025 & 2033
- Figure 56: Japan APAC Industrial Air Cleaners Market Volume (K Unit), by Geography 2025 & 2033
- Figure 57: Japan APAC Industrial Air Cleaners Market Revenue Share (%), by Geography 2025 & 2033
- Figure 58: Japan APAC Industrial Air Cleaners Market Volume Share (%), by Geography 2025 & 2033
- Figure 59: Japan APAC Industrial Air Cleaners Market Revenue (million), by Country 2025 & 2033
- Figure 60: Japan APAC Industrial Air Cleaners Market Volume (K Unit), by Country 2025 & 2033
- Figure 61: Japan APAC Industrial Air Cleaners Market Revenue Share (%), by Country 2025 & 2033
- Figure 62: Japan APAC Industrial Air Cleaners Market Volume Share (%), by Country 2025 & 2033
- Figure 63: Rest of Asia Pacific APAC Industrial Air Cleaners Market Revenue (million), by Filtration Technology 2025 & 2033
- Figure 64: Rest of Asia Pacific APAC Industrial Air Cleaners Market Volume (K Unit), by Filtration Technology 2025 & 2033
- Figure 65: Rest of Asia Pacific APAC Industrial Air Cleaners Market Revenue Share (%), by Filtration Technology 2025 & 2033
- Figure 66: Rest of Asia Pacific APAC Industrial Air Cleaners Market Volume Share (%), by Filtration Technology 2025 & 2033
- Figure 67: Rest of Asia Pacific APAC Industrial Air Cleaners Market Revenue (million), by Type 2025 & 2033
- Figure 68: Rest of Asia Pacific APAC Industrial Air Cleaners Market Volume (K Unit), by Type 2025 & 2033
- Figure 69: Rest of Asia Pacific APAC Industrial Air Cleaners Market Revenue Share (%), by Type 2025 & 2033
- Figure 70: Rest of Asia Pacific APAC Industrial Air Cleaners Market Volume Share (%), by Type 2025 & 2033
- Figure 71: Rest of Asia Pacific APAC Industrial Air Cleaners Market Revenue (million), by End User 2025 & 2033
- Figure 72: Rest of Asia Pacific APAC Industrial Air Cleaners Market Volume (K Unit), by End User 2025 & 2033
- Figure 73: Rest of Asia Pacific APAC Industrial Air Cleaners Market Revenue Share (%), by End User 2025 & 2033
- Figure 74: Rest of Asia Pacific APAC Industrial Air Cleaners Market Volume Share (%), by End User 2025 & 2033
- Figure 75: Rest of Asia Pacific APAC Industrial Air Cleaners Market Revenue (million), by Geography 2025 & 2033
- Figure 76: Rest of Asia Pacific APAC Industrial Air Cleaners Market Volume (K Unit), by Geography 2025 & 2033
- Figure 77: Rest of Asia Pacific APAC Industrial Air Cleaners Market Revenue Share (%), by Geography 2025 & 2033
- Figure 78: Rest of Asia Pacific APAC Industrial Air Cleaners Market Volume Share (%), by Geography 2025 & 2033
- Figure 79: Rest of Asia Pacific APAC Industrial Air Cleaners Market Revenue (million), by Country 2025 & 2033
- Figure 80: Rest of Asia Pacific APAC Industrial Air Cleaners Market Volume (K Unit), by Country 2025 & 2033
- Figure 81: Rest of Asia Pacific APAC Industrial Air Cleaners Market Revenue Share (%), by Country 2025 & 2033
- Figure 82: Rest of Asia Pacific APAC Industrial Air Cleaners Market Volume Share (%), by Country 2025 & 2033
List of Tables
- Table 1: Global APAC Industrial Air Cleaners Market Revenue million Forecast, by Filtration Technology 2020 & 2033
- Table 2: Global APAC Industrial Air Cleaners Market Volume K Unit Forecast, by Filtration Technology 2020 & 2033
- Table 3: Global APAC Industrial Air Cleaners Market Revenue million Forecast, by Type 2020 & 2033
- Table 4: Global APAC Industrial Air Cleaners Market Volume K Unit Forecast, by Type 2020 & 2033
- Table 5: Global APAC Industrial Air Cleaners Market Revenue million Forecast, by End User 2020 & 2033
- Table 6: Global APAC Industrial Air Cleaners Market Volume K Unit Forecast, by End User 2020 & 2033
- Table 7: Global APAC Industrial Air Cleaners Market Revenue million Forecast, by Geography 2020 & 2033
- Table 8: Global APAC Industrial Air Cleaners Market Volume K Unit Forecast, by Geography 2020 & 2033
- Table 9: Global APAC Industrial Air Cleaners Market Revenue million Forecast, by Region 2020 & 2033
- Table 10: Global APAC Industrial Air Cleaners Market Volume K Unit Forecast, by Region 2020 & 2033
- Table 11: Global APAC Industrial Air Cleaners Market Revenue million Forecast, by Filtration Technology 2020 & 2033
- Table 12: Global APAC Industrial Air Cleaners Market Volume K Unit Forecast, by Filtration Technology 2020 & 2033
- Table 13: Global APAC Industrial Air Cleaners Market Revenue million Forecast, by Type 2020 & 2033
- Table 14: Global APAC Industrial Air Cleaners Market Volume K Unit Forecast, by Type 2020 & 2033
- Table 15: Global APAC Industrial Air Cleaners Market Revenue million Forecast, by End User 2020 & 2033
- Table 16: Global APAC Industrial Air Cleaners Market Volume K Unit Forecast, by End User 2020 & 2033
- Table 17: Global APAC Industrial Air Cleaners Market Revenue million Forecast, by Geography 2020 & 2033
- Table 18: Global APAC Industrial Air Cleaners Market Volume K Unit Forecast, by Geography 2020 & 2033
- Table 19: Global APAC Industrial Air Cleaners Market Revenue million Forecast, by Country 2020 & 2033
- Table 20: Global APAC Industrial Air Cleaners Market Volume K Unit Forecast, by Country 2020 & 2033
- Table 21: Global APAC Industrial Air Cleaners Market Revenue million Forecast, by Filtration Technology 2020 & 2033
- Table 22: Global APAC Industrial Air Cleaners Market Volume K Unit Forecast, by Filtration Technology 2020 & 2033
- Table 23: Global APAC Industrial Air Cleaners Market Revenue million Forecast, by Type 2020 & 2033
- Table 24: Global APAC Industrial Air Cleaners Market Volume K Unit Forecast, by Type 2020 & 2033
- Table 25: Global APAC Industrial Air Cleaners Market Revenue million Forecast, by End User 2020 & 2033
- Table 26: Global APAC Industrial Air Cleaners Market Volume K Unit Forecast, by End User 2020 & 2033
- Table 27: Global APAC Industrial Air Cleaners Market Revenue million Forecast, by Geography 2020 & 2033
- Table 28: Global APAC Industrial Air Cleaners Market Volume K Unit Forecast, by Geography 2020 & 2033
- Table 29: Global APAC Industrial Air Cleaners Market Revenue million Forecast, by Country 2020 & 2033
- Table 30: Global APAC Industrial Air Cleaners Market Volume K Unit Forecast, by Country 2020 & 2033
- Table 31: Global APAC Industrial Air Cleaners Market Revenue million Forecast, by Filtration Technology 2020 & 2033
- Table 32: Global APAC Industrial Air Cleaners Market Volume K Unit Forecast, by Filtration Technology 2020 & 2033
- Table 33: Global APAC Industrial Air Cleaners Market Revenue million Forecast, by Type 2020 & 2033
- Table 34: Global APAC Industrial Air Cleaners Market Volume K Unit Forecast, by Type 2020 & 2033
- Table 35: Global APAC Industrial Air Cleaners Market Revenue million Forecast, by End User 2020 & 2033
- Table 36: Global APAC Industrial Air Cleaners Market Volume K Unit Forecast, by End User 2020 & 2033
- Table 37: Global APAC Industrial Air Cleaners Market Revenue million Forecast, by Geography 2020 & 2033
- Table 38: Global APAC Industrial Air Cleaners Market Volume K Unit Forecast, by Geography 2020 & 2033
- Table 39: Global APAC Industrial Air Cleaners Market Revenue million Forecast, by Country 2020 & 2033
- Table 40: Global APAC Industrial Air Cleaners Market Volume K Unit Forecast, by Country 2020 & 2033
- Table 41: Global APAC Industrial Air Cleaners Market Revenue million Forecast, by Filtration Technology 2020 & 2033
- Table 42: Global APAC Industrial Air Cleaners Market Volume K Unit Forecast, by Filtration Technology 2020 & 2033
- Table 43: Global APAC Industrial Air Cleaners Market Revenue million Forecast, by Type 2020 & 2033
- Table 44: Global APAC Industrial Air Cleaners Market Volume K Unit Forecast, by Type 2020 & 2033
- Table 45: Global APAC Industrial Air Cleaners Market Revenue million Forecast, by End User 2020 & 2033
- Table 46: Global APAC Industrial Air Cleaners Market Volume K Unit Forecast, by End User 2020 & 2033
- Table 47: Global APAC Industrial Air Cleaners Market Revenue million Forecast, by Geography 2020 & 2033
- Table 48: Global APAC Industrial Air Cleaners Market Volume K Unit Forecast, by Geography 2020 & 2033
- Table 49: Global APAC Industrial Air Cleaners Market Revenue million Forecast, by Country 2020 & 2033
- Table 50: Global APAC Industrial Air Cleaners Market Volume K Unit Forecast, by Country 2020 & 2033
Frequently Asked Questions
1. What is the projected Compound Annual Growth Rate (CAGR) of the APAC Industrial Air Cleaners Market?
The projected CAGR is approximately 7.3%.
2. Which companies are prominent players in the APAC Industrial Air Cleaners Market?
Key companies in the market include Dyson Ltd, Whirlpool Corporation, Unilever PLC (erstwhile BlueAir AB), Honeywell International Inc, Daikin Industries Ltd, LG Electronics Inc, AllerAir Industries Inc*List Not Exhaustive, Samsung Electronics Co Ltd, Xiaomi Corp, Koninklijke Philips NV, Panasonic Corporation, IQAir.
3. What are the main segments of the APAC Industrial Air Cleaners Market?
The market segments include Filtration Technology, Type, End User, Geography.
4. Can you provide details about the market size?
The market size is estimated to be USD 6689.8 million as of 2022.
5. What are some drivers contributing to market growth?
4.; Increasing Number of Automobiles4.; The Government Policy Regarding Pollution Emission Control Parameters.
6. What are the notable trends driving market growth?
Residential Segment Expected to Dominate the Market.
7. Are there any restraints impacting market growth?
4.; The Technological Limitations of Air Filters.
8. Can you provide examples of recent developments in the market?
November 2022: Havells Studio launched a new product, the Meditate air purifier. The company said the air purifier is tested and verified by Equinox Lab for efficacy against the removal of hazardous gaseous pollutants as well as microorganisms like bacteria, viruses, and fungal strains.
9. What pricing options are available for accessing the report?
Pricing options include single-user, multi-user, and enterprise licenses priced at USD 4750, USD 5250, and USD 8750 respectively.
10. Is the market size provided in terms of value or volume?
The market size is provided in terms of value, measured in million and volume, measured in K Unit.
11. Are there any specific market keywords associated with the report?
Yes, the market keyword associated with the report is "APAC Industrial Air Cleaners Market," which aids in identifying and referencing the specific market segment covered.
12. How do I determine which pricing option suits my needs best?
The pricing options vary based on user requirements and access needs. Individual users may opt for single-user licenses, while businesses requiring broader access may choose multi-user or enterprise licenses for cost-effective access to the report.
13. Are there any additional resources or data provided in the APAC Industrial Air Cleaners Market report?
While the report offers comprehensive insights, it's advisable to review the specific contents or supplementary materials provided to ascertain if additional resources or data are available.
14. How can I stay updated on further developments or reports in the APAC Industrial Air Cleaners Market?
To stay informed about further developments, trends, and reports in the APAC Industrial Air Cleaners Market, consider subscribing to industry newsletters, following relevant companies and organizations, or regularly checking reputable industry news sources and publications.
Methodology
Step 1 - Identification of Relevant Samples Size from Population Database


Step 2 - Approaches for Defining Global Market Size (Value, Volume* & Price*)

Note*: In applicable scenarios
Step 3 - Data Sources
Primary Research
- Web Analytics
- Survey Reports
- Research Institute
- Latest Research Reports
- Opinion Leaders
Secondary Research
- Annual Reports
- White Paper
- Latest Press Release
- Industry Association
- Paid Database
- Investor Presentations

Step 4 - Data Triangulation
Involves using different sources of information in order to increase the validity of a study
These sources are likely to be stakeholders in a program - participants, other researchers, program staff, other community members, and so on.
Then we put all data in single framework & apply various statistical tools to find out the dynamic on the market.
During the analysis stage, feedback from the stakeholder groups would be compared to determine areas of agreement as well as areas of divergence

