

Key Insights
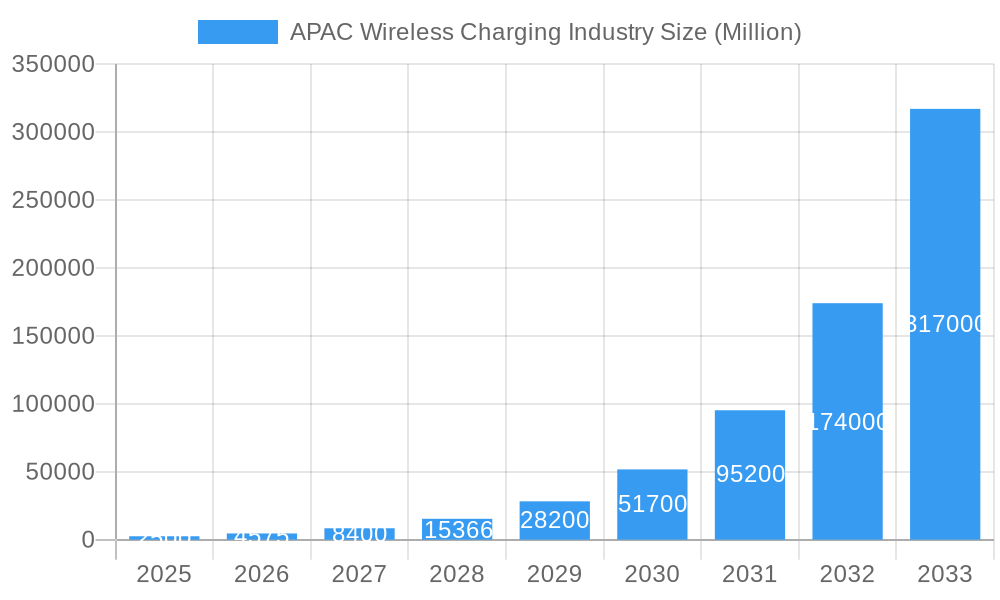
The Asia-Pacific (APAC) wireless charging market is projected for significant expansion, driven by the escalating adoption of electric vehicles (EVs) and the growing demand for convenient charging solutions. Key growth catalysts include a rising middle class and supportive government initiatives promoting EV uptake in China, Japan, India, and South Korea. The market is exhibiting a notable Compound Annual Growth Rate (CAGR) of 36.2%. The estimated market size for 2025 is projected to be between $2.4 billion and $3 billion, underscoring the region's pivotal role in global EV production and consumption. Dominant segments are expected to be battery electric vehicles (BEVs), followed by plug-in hybrid vehicles (PHEVs). Advancements in charging efficiency and power transfer are further stimulating market growth. However, challenges persist, such as the higher cost of wireless charging systems compared to wired alternatives and the necessity for standardization to ensure interoperability. Despite these factors, the long-term outlook for the APAC wireless charging market remains robust, with sustained high growth anticipated through 2033, fueled by technological innovations, policy support, and increasing EV penetration. Leading companies such as Tesla, Daimler, and Toyota are actively investing in research and development and expanding their presence in this evolving landscape.
APAC Wireless Charging Industry Market Size (In Billion)
The competitive arena features a blend of established automotive manufacturers and forward-thinking technology firms. Tesla's early market entry and substantial influence in the EV sector position it as a key participant. Concurrently, numerous other entities, including Daimler, BMW, and specialized technology providers, are actively developing and deploying wireless charging solutions. This competitive environment is expected to spur further innovation and accelerate market development. Market success will hinge on addressing standardization, cost reduction, and the establishment of reliable charging infrastructure to accommodate the projected surge in EV adoption. The APAC wireless charging market is poised to become an integral part of the region's broader EV ecosystem, contributing significantly to the transition towards sustainable transportation.
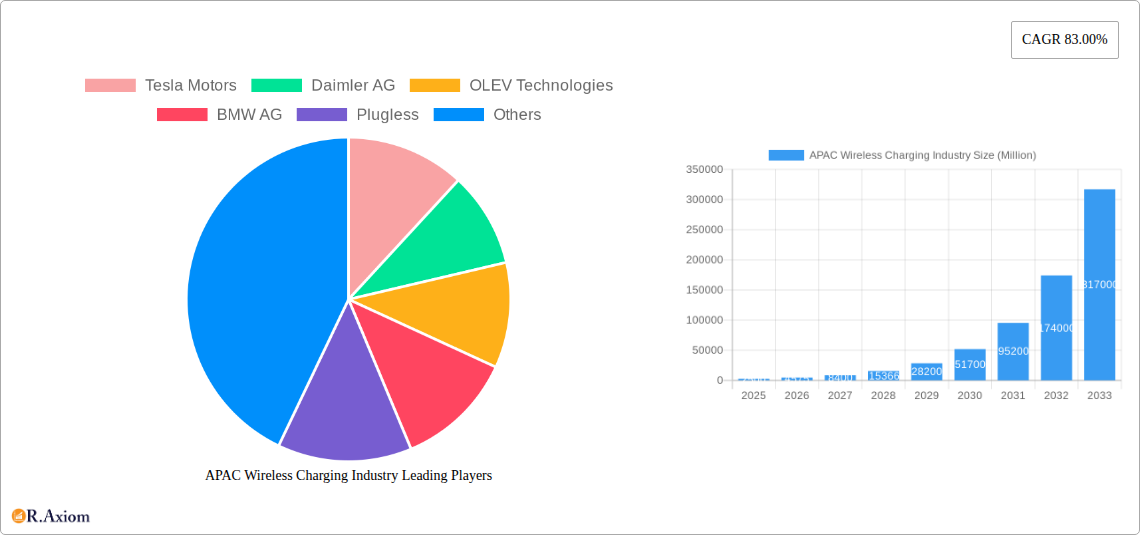
APAC Wireless Charging Industry Company Market Share
This report offers a comprehensive analysis of the Asia-Pacific (APAC) wireless charging industry, detailing market size, growth forecasts, key stakeholders, technological progress, and emerging trends from 2019 to 2033. The study period covers 2019-2033, with 2025 designated as the base and forecast year. The forecast period spans 2025-2033, with the historical period encompassing 2019-2024. This research is indispensable for industry participants, investors, and businesses seeking insights and opportunities within this dynamic market.
APAC Wireless Charging Industry Market Concentration & Innovation
The APAC wireless charging market is characterized by a moderate level of concentration, with several key players vying for market share. While exact market share figures for each company are proprietary information and cannot be disclosed, Tesla Motors, Daimler AG, and BMW AG hold significant positions, driven by their integration of wireless charging technology into their electric vehicle (EV) offerings. Smaller companies like Plugless, HEVO Power, and WiTricity are also contributing significantly to innovation in specific niche segments. The market is witnessing increased M&A activity, though specific deal values remain confidential (xx Million). Innovation is primarily driven by advancements in wireless power transfer technology, the increasing demand for convenient charging solutions for EVs, and supportive government regulations promoting EV adoption. Regulatory frameworks vary across APAC countries, creating both opportunities and challenges. Substitute technologies, such as traditional wired charging, continue to compete but are losing ground to the convenience and future-proofing offered by wireless solutions. End-user trends are focused on faster charging speeds, longer ranges, and seamless integration with smart home ecosystems.
- Market Concentration: Moderate, with a few dominant players and many niche competitors.
- Innovation Drivers: Advancements in wireless power transfer technology, rising EV adoption, supportive government policies.
- Regulatory Frameworks: Vary significantly across APAC countries.
- Product Substitutes: Traditional wired charging.
- End-User Trends: Demand for faster charging, longer ranges, and seamless integration with smart homes.
- M&A Activity: Increasing, though specific deal values are unavailable (xx Million).
APAC Wireless Charging Industry Industry Trends & Insights
The APAC wireless charging market is undergoing a transformative period, fueled by a confluence of powerful drivers. The rapidly expanding Electric Vehicle (EV) sector stands as a primary catalyst, with projections indicating a robust Compound Annual Growth Rate (CAGR) of approximately **XX%** between 2025 and 2033. This surge in EV adoption directly translates to a heightened demand for convenient and user-friendly charging solutions. Furthermore, significant technological breakthroughs, including advancements in resonant inductive coupling and high-efficiency power transfer techniques, are continuously refining the performance and practicality of wireless charging systems. Market penetration is steadily increasing, with developed economies like Japan and South Korea leading the charge due to their early adoption and technological prowess. The competitive landscape is dynamic and evolving, marked by established automotive giants proactively integrating wireless charging capabilities into their vehicle lineups and agile technology firms pioneering innovative charging solutions. The industry is characterized by a relentless pursuit of innovation, resulting in tangible improvements in charging speed, energy efficiency, and the overall user experience. The average charging duration is on a downward trend, while the efficiency of wireless power transfer is consistently being optimized. The pervasive growth of smart home ecosystems and the escalating adoption of connected car technologies further amplify the demand for seamlessly integrated wireless charging solutions.
Dominant Markets & Segments in APAC Wireless Charging Industry
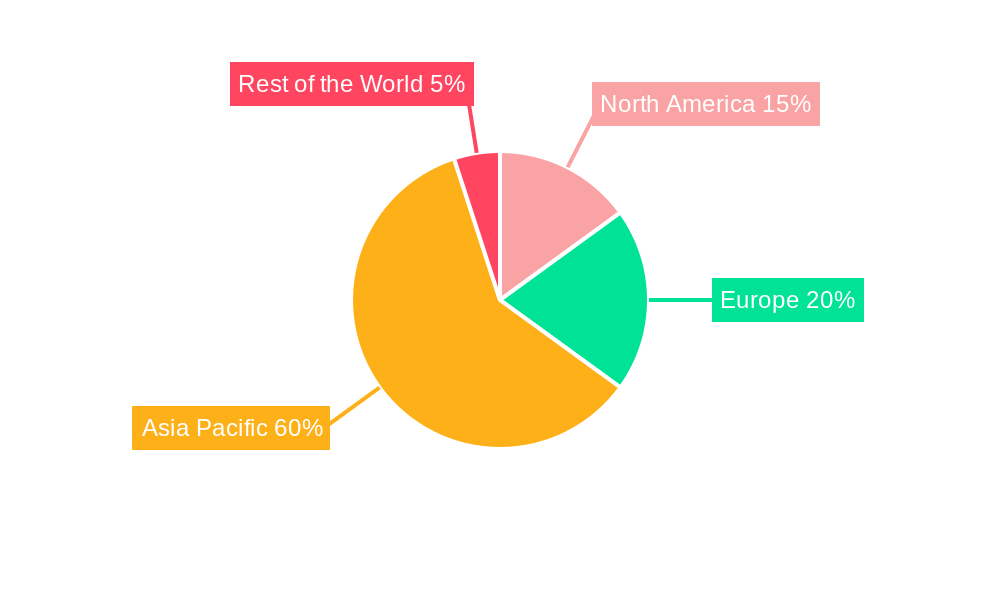
Dominant Region/Country: China is the leading market, driven by its large EV market and supportive government policies. Its dominance is attributable to its massive EV manufacturing base and substantial government investment in infrastructure development. Japan is a strong second, bolstered by its technological prowess and established automotive industry.
Dominant Segment: Battery Electric Vehicles (BEVs) represent the dominant segment due to their increasing adoption and compatibility with wireless charging technology.
Key Drivers for China:
- Massive EV market
- Government subsidies and incentives
- Robust domestic manufacturing base
- Extensive infrastructure development
Key Drivers for Japan:
- Technological advancements
- Strong automotive industry
- High consumer adoption of EVs
Key Drivers for BEVs:
- Increasing EV adoption rates
- Compatibility with wireless charging technology
- Growing consumer demand for convenience
Other Segments: Plug-in Hybrid Vehicles (PHEVs) are also showing growth, but at a slower rate compared to BEVs, with the Rest of Asia-Pacific showing potential due to rapidly increasing investment and EV adoption. India and Australia are emerging markets demonstrating substantial potential for growth, though infrastructure limitations and affordability remain challenges.
APAC Wireless Charging Industry Product Developments
Recent product innovations include advancements in high-power wireless charging systems capable of faster charging speeds and improved efficiency, enhancing user experience. Wireless charging pads are becoming smaller and more portable, suited for diverse applications from consumer electronics to industrial use cases. Competitive advantages are determined by factors such as charging speed, efficiency, cost-effectiveness, and integration capabilities. The market is witnessing a shift towards more compact and efficient solutions for both individual use and large-scale applications like charging stations for vehicles and robots.
Report Scope & Segmentation Analysis
By Vehicle Type: The analysis meticulously segments the market into two primary vehicle categories: Battery Electric Vehicles (BEVs) and Plug-in Hybrid Electric Vehicles (PHEVs). BEVs are anticipated to command a dominant market share, primarily due to their inherent higher compatibility with wireless charging infrastructure and their burgeoning popularity among consumers. PHEVs, while representing a smaller segment, are also projected to experience growth, albeit at a more moderate pace compared to BEVs.
By Country: The report offers a comprehensive examination of the market across key APAC nations, encompassing China, Japan, India, Australia, and the broader Rest of Asia-Pacific region. China is poised to sustain its leadership position, driven by its expansive EV market and robust governmental support. Japan and South Korea are expected to retain substantial market shares, leveraging their advanced technological capabilities and established charging infrastructure. India and Australia present significant growth potential in the forthcoming years, with the Rest of Asia-Pacific exhibiting a diverse range of growth trajectories and unique market challenges.
Growth projections exhibit considerable variation across different segments and geographical regions, reflecting disparities in EV adoption rates, the efficacy of government policies, and the pace of infrastructure development. Competitive dynamics also vary, influenced by the maturity of the respective markets and the presence of both local and international industry players.
Key Drivers of APAC Wireless Charging Industry Growth
The APAC wireless charging market’s growth is driven by several factors. Firstly, the rapid expansion of the electric vehicle (EV) market creates significant demand for convenient charging solutions. Government incentives and supportive policies in various APAC countries further stimulate EV adoption and, consequently, wireless charging technology. The ongoing technological advancements resulting in higher charging efficiency and faster charging speeds are crucial factors. The integration of wireless charging with smart home and connected car technologies enhances its appeal and creates wider adoption.
Challenges in the APAC Wireless Charging Industry Sector
The APAC wireless charging industry is navigating a landscape dotted with several key challenges. Prominent among these are interoperability issues stemming from diverse wireless charging standards, which can impede seamless adoption and contribute to market fragmentation. The relatively higher cost of wireless charging systems when contrasted with conventional wired solutions can act as a deterrent to widespread adoption, particularly in price-sensitive markets. Furthermore, potential supply chain disruptions and the fluctuating availability of critical components, especially semiconductors, pose inherent risks to production continuity and overall market stability. Lastly, the absence of comprehensive standardization and regional harmonization might present complexities in ensuring consistent and seamless operation across different devices and locations.
Emerging Opportunities in APAC Wireless Charging Industry
The horizon for the APAC wireless charging industry is bright with emerging opportunities that extend beyond the automotive sector. The integration of wireless charging into a wide array of consumer electronics, including smartphones, wearables, and other personal devices, alongside its application in industrial settings, presents compelling new avenues for market expansion. Continuous technological advancements focused on elevating charging efficiency and increasing power transfer capabilities will unlock novel market possibilities. The exploration and adoption of advanced materials and innovative manufacturing processes hold the potential for significant cost reductions, thereby making wireless charging technology more accessible to a broader consumer base. The development of more robust, reliable, and user-friendly wireless charging systems is crucial for mitigating consumer apprehension and fostering wider adoption.
Leading Players in the APAC Wireless Charging Industry Market
- Tesla Motors
- Daimler AG
- OLEV Technologies
- BMW AG
- Plugless
- Bombardier
- Toyota Motor Corporation
- Nissan
- Hella Aglaia
- HEVO Power
- WiTricity
- Qualcomm
Key Developments in APAC Wireless Charging Industry Industry
- June 2023: ST Microelectronics NV showcased its 100W Wireless Charging Solution at MWC Shanghai, highlighting advancements in wireless power transfer technology.
- June 2023: SAIC-GM launched the Buick Electra E5, featuring industry-first wireless battery management, demonstrating the increasing integration of wireless charging in EVs.
- May 2023: The Malaysian government announced a USD 422.3 Million investment by EVE Energy, signaling growing commitment to supporting the development of wireless charging infrastructure.
Strategic Outlook for APAC Wireless Charging Industry Market
The APAC wireless charging market is on a trajectory of substantial growth, propelled by the sustained expansion of the electric vehicle ecosystem, ongoing technological innovations that enhance charging efficiency and speed, and proactive government policies aimed at incentivizing EV adoption. The increasing integration of wireless charging capabilities into smart home environments and the heightened focus on improving charging convenience across diverse applications underscore a promising future for this market. The industry is well-positioned for significant expansion, offering lucrative opportunities for both established industry leaders and innovative new entrants.
APAC Wireless Charging Industry Segmentation
-
1. Vehicle Type
- 1.1. Battery Electric Vehicle
- 1.2. Plug-in Hybrid Vehicle
APAC Wireless Charging Industry Segmentation By Geography
-
1. North America
- 1.1. United States
- 1.2. Canada
- 1.3. Mexico
-
2. South America
- 2.1. Brazil
- 2.2. Argentina
- 2.3. Rest of South America
-
3. Europe
- 3.1. United Kingdom
- 3.2. Germany
- 3.3. France
- 3.4. Italy
- 3.5. Spain
- 3.6. Russia
- 3.7. Benelux
- 3.8. Nordics
- 3.9. Rest of Europe
-
4. Middle East & Africa
- 4.1. Turkey
- 4.2. Israel
- 4.3. GCC
- 4.4. North Africa
- 4.5. South Africa
- 4.6. Rest of Middle East & Africa
-
5. Asia Pacific
- 5.1. China
- 5.2. India
- 5.3. Japan
- 5.4. South Korea
- 5.5. ASEAN
- 5.6. Oceania
- 5.7. Rest of Asia Pacific
APAC Wireless Charging Industry Regional Market Share
Geographic Coverage of APAC Wireless Charging Industry
APAC Wireless Charging Industry REPORT HIGHLIGHTS
| Aspects | Details |
|---|---|
| Study Period | 2020-2034 |
| Base Year | 2025 |
| Estimated Year | 2026 |
| Forecast Period | 2026-2034 |
| Historical Period | 2020-2025 |
| Growth Rate | CAGR of 36.2% from 2020-2034 |
| Segmentation |
|
Table of Contents
- 1. Introduction
- 1.1. Research Scope
- 1.2. Market Segmentation
- 1.3. Research Objective
- 1.4. Definitions and Assumptions
- 2. Executive Summary
- 2.1. Market Snapshot
- 3. Market Dynamics
- 3.1. Market Drivers
- 3.2. Market Restrains
- 3.3. Market Trends
- 3.4. Market Opportunities
- 4. Market Factor Analysis
- 4.1. Porters Five Forces
- 4.1.1. Bargaining Power of Suppliers
- 4.1.2. Bargaining Power of Buyers
- 4.1.3. Threat of New Entrants
- 4.1.4. Threat of Substitutes
- 4.1.5. Competitive Rivalry
- 4.2. PESTEL analysis
- 4.3. BCG Analysis
- 4.3.1. Stars (High Growth, High Market Share)
- 4.3.2. Cash Cows (Low Growth, High Market Share)
- 4.3.3. Question Mark (High Growth, Low Market Share)
- 4.3.4. Dogs (Low Growth, Low Market Share)
- 4.4. Ansoff Matrix Analysis
- 4.5. Supply Chain Analysis
- 4.6. Regulatory Landscape
- 4.7. Current Market Potential and Opportunity Assessment (TAM–SAM–SOM Framework)
- 4.8. RAX Analyst Note
- 4.1. Porters Five Forces
- 5. Market Analysis, Insights and Forecast 2021-2033
- 5.1. Market Analysis, Insights and Forecast - by Vehicle Type
- 5.1.1. Battery Electric Vehicle
- 5.1.2. Plug-in Hybrid Vehicle
- 5.2. Market Analysis, Insights and Forecast - by Region
- 5.2.1. North America
- 5.2.2. South America
- 5.2.3. Europe
- 5.2.4. Middle East & Africa
- 5.2.5. Asia Pacific
- 5.1. Market Analysis, Insights and Forecast - by Vehicle Type
- 6. Global APAC Wireless Charging Industry Analysis, Insights and Forecast, 2021-2033
- 6.1. Market Analysis, Insights and Forecast - by Vehicle Type
- 6.1.1. Battery Electric Vehicle
- 6.1.2. Plug-in Hybrid Vehicle
- 6.1. Market Analysis, Insights and Forecast - by Vehicle Type
- 7. North America APAC Wireless Charging Industry Analysis, Insights and Forecast, 2020-2032
- 7.1. Market Analysis, Insights and Forecast - by Vehicle Type
- 7.1.1. Battery Electric Vehicle
- 7.1.2. Plug-in Hybrid Vehicle
- 7.1. Market Analysis, Insights and Forecast - by Vehicle Type
- 8. South America APAC Wireless Charging Industry Analysis, Insights and Forecast, 2020-2032
- 8.1. Market Analysis, Insights and Forecast - by Vehicle Type
- 8.1.1. Battery Electric Vehicle
- 8.1.2. Plug-in Hybrid Vehicle
- 8.1. Market Analysis, Insights and Forecast - by Vehicle Type
- 9. Europe APAC Wireless Charging Industry Analysis, Insights and Forecast, 2020-2032
- 9.1. Market Analysis, Insights and Forecast - by Vehicle Type
- 9.1.1. Battery Electric Vehicle
- 9.1.2. Plug-in Hybrid Vehicle
- 9.1. Market Analysis, Insights and Forecast - by Vehicle Type
- 10. Middle East & Africa APAC Wireless Charging Industry Analysis, Insights and Forecast, 2020-2032
- 10.1. Market Analysis, Insights and Forecast - by Vehicle Type
- 10.1.1. Battery Electric Vehicle
- 10.1.2. Plug-in Hybrid Vehicle
- 10.1. Market Analysis, Insights and Forecast - by Vehicle Type
- 11. Asia Pacific APAC Wireless Charging Industry Analysis, Insights and Forecast, 2020-2032
- 11.1. Market Analysis, Insights and Forecast - by Vehicle Type
- 11.1.1. Battery Electric Vehicle
- 11.1.2. Plug-in Hybrid Vehicle
- 11.1. Market Analysis, Insights and Forecast - by Vehicle Type
- 12. Competitive Analysis
- 12.1. Company Profiles
- 12.1.1 Tesla Motors
- 12.1.1.1. Company Overview
- 12.1.1.2. Products
- 12.1.1.3. Company Financials
- 12.1.1.4. SWOT Analysis
- 12.1.2 Daimler AG
- 12.1.2.1. Company Overview
- 12.1.2.2. Products
- 12.1.2.3. Company Financials
- 12.1.2.4. SWOT Analysis
- 12.1.3 OLEV Technologies
- 12.1.3.1. Company Overview
- 12.1.3.2. Products
- 12.1.3.3. Company Financials
- 12.1.3.4. SWOT Analysis
- 12.1.4 BMW AG
- 12.1.4.1. Company Overview
- 12.1.4.2. Products
- 12.1.4.3. Company Financials
- 12.1.4.4. SWOT Analysis
- 12.1.5 Plugless
- 12.1.5.1. Company Overview
- 12.1.5.2. Products
- 12.1.5.3. Company Financials
- 12.1.5.4. SWOT Analysis
- 12.1.6 Bombardier
- 12.1.6.1. Company Overview
- 12.1.6.2. Products
- 12.1.6.3. Company Financials
- 12.1.6.4. SWOT Analysis
- 12.1.7 Toyota Motor Corporation
- 12.1.7.1. Company Overview
- 12.1.7.2. Products
- 12.1.7.3. Company Financials
- 12.1.7.4. SWOT Analysis
- 12.1.8 Nissan
- 12.1.8.1. Company Overview
- 12.1.8.2. Products
- 12.1.8.3. Company Financials
- 12.1.8.4. SWOT Analysis
- 12.1.9 Hella Aglaia
- 12.1.9.1. Company Overview
- 12.1.9.2. Products
- 12.1.9.3. Company Financials
- 12.1.9.4. SWOT Analysis
- 12.1.10 HEVO Powe
- 12.1.10.1. Company Overview
- 12.1.10.2. Products
- 12.1.10.3. Company Financials
- 12.1.10.4. SWOT Analysis
- 12.1.11 WiTricity
- 12.1.11.1. Company Overview
- 12.1.11.2. Products
- 12.1.11.3. Company Financials
- 12.1.11.4. SWOT Analysis
- 12.1.12 Qualcomm
- 12.1.12.1. Company Overview
- 12.1.12.2. Products
- 12.1.12.3. Company Financials
- 12.1.12.4. SWOT Analysis
- 12.1.1 Tesla Motors
- 12.2. Market Entropy
- 12.2.1 Company's Key Areas Served
- 12.2.2 Recent Developments
- 12.3. Company Market Share Analysis 2025
- 12.3.1 Top 5 Companies Market Share Analysis
- 12.3.2 Top 3 Companies Market Share Analysis
- 12.4. List of Potential Customers
- 13. Research Methodology
List of Figures
- Figure 1: Global APAC Wireless Charging Industry Revenue Breakdown (billion, %) by Region 2025 & 2033
- Figure 2: North America APAC Wireless Charging Industry Revenue (billion), by Vehicle Type 2025 & 2033
- Figure 3: North America APAC Wireless Charging Industry Revenue Share (%), by Vehicle Type 2025 & 2033
- Figure 4: North America APAC Wireless Charging Industry Revenue (billion), by Country 2025 & 2033
- Figure 5: North America APAC Wireless Charging Industry Revenue Share (%), by Country 2025 & 2033
- Figure 6: South America APAC Wireless Charging Industry Revenue (billion), by Vehicle Type 2025 & 2033
- Figure 7: South America APAC Wireless Charging Industry Revenue Share (%), by Vehicle Type 2025 & 2033
- Figure 8: South America APAC Wireless Charging Industry Revenue (billion), by Country 2025 & 2033
- Figure 9: South America APAC Wireless Charging Industry Revenue Share (%), by Country 2025 & 2033
- Figure 10: Europe APAC Wireless Charging Industry Revenue (billion), by Vehicle Type 2025 & 2033
- Figure 11: Europe APAC Wireless Charging Industry Revenue Share (%), by Vehicle Type 2025 & 2033
- Figure 12: Europe APAC Wireless Charging Industry Revenue (billion), by Country 2025 & 2033
- Figure 13: Europe APAC Wireless Charging Industry Revenue Share (%), by Country 2025 & 2033
- Figure 14: Middle East & Africa APAC Wireless Charging Industry Revenue (billion), by Vehicle Type 2025 & 2033
- Figure 15: Middle East & Africa APAC Wireless Charging Industry Revenue Share (%), by Vehicle Type 2025 & 2033
- Figure 16: Middle East & Africa APAC Wireless Charging Industry Revenue (billion), by Country 2025 & 2033
- Figure 17: Middle East & Africa APAC Wireless Charging Industry Revenue Share (%), by Country 2025 & 2033
- Figure 18: Asia Pacific APAC Wireless Charging Industry Revenue (billion), by Vehicle Type 2025 & 2033
- Figure 19: Asia Pacific APAC Wireless Charging Industry Revenue Share (%), by Vehicle Type 2025 & 2033
- Figure 20: Asia Pacific APAC Wireless Charging Industry Revenue (billion), by Country 2025 & 2033
- Figure 21: Asia Pacific APAC Wireless Charging Industry Revenue Share (%), by Country 2025 & 2033
List of Tables
- Table 1: Global APAC Wireless Charging Industry Revenue billion Forecast, by Vehicle Type 2020 & 2033
- Table 2: Global APAC Wireless Charging Industry Revenue billion Forecast, by Region 2020 & 2033
- Table 3: Global APAC Wireless Charging Industry Revenue billion Forecast, by Vehicle Type 2020 & 2033
- Table 4: Global APAC Wireless Charging Industry Revenue billion Forecast, by Country 2020 & 2033
- Table 5: United States APAC Wireless Charging Industry Revenue (billion) Forecast, by Application 2020 & 2033
- Table 6: Canada APAC Wireless Charging Industry Revenue (billion) Forecast, by Application 2020 & 2033
- Table 7: Mexico APAC Wireless Charging Industry Revenue (billion) Forecast, by Application 2020 & 2033
- Table 8: Global APAC Wireless Charging Industry Revenue billion Forecast, by Vehicle Type 2020 & 2033
- Table 9: Global APAC Wireless Charging Industry Revenue billion Forecast, by Country 2020 & 2033
- Table 10: Brazil APAC Wireless Charging Industry Revenue (billion) Forecast, by Application 2020 & 2033
- Table 11: Argentina APAC Wireless Charging Industry Revenue (billion) Forecast, by Application 2020 & 2033
- Table 12: Rest of South America APAC Wireless Charging Industry Revenue (billion) Forecast, by Application 2020 & 2033
- Table 13: Global APAC Wireless Charging Industry Revenue billion Forecast, by Vehicle Type 2020 & 2033
- Table 14: Global APAC Wireless Charging Industry Revenue billion Forecast, by Country 2020 & 2033
- Table 15: United Kingdom APAC Wireless Charging Industry Revenue (billion) Forecast, by Application 2020 & 2033
- Table 16: Germany APAC Wireless Charging Industry Revenue (billion) Forecast, by Application 2020 & 2033
- Table 17: France APAC Wireless Charging Industry Revenue (billion) Forecast, by Application 2020 & 2033
- Table 18: Italy APAC Wireless Charging Industry Revenue (billion) Forecast, by Application 2020 & 2033
- Table 19: Spain APAC Wireless Charging Industry Revenue (billion) Forecast, by Application 2020 & 2033
- Table 20: Russia APAC Wireless Charging Industry Revenue (billion) Forecast, by Application 2020 & 2033
- Table 21: Benelux APAC Wireless Charging Industry Revenue (billion) Forecast, by Application 2020 & 2033
- Table 22: Nordics APAC Wireless Charging Industry Revenue (billion) Forecast, by Application 2020 & 2033
- Table 23: Rest of Europe APAC Wireless Charging Industry Revenue (billion) Forecast, by Application 2020 & 2033
- Table 24: Global APAC Wireless Charging Industry Revenue billion Forecast, by Vehicle Type 2020 & 2033
- Table 25: Global APAC Wireless Charging Industry Revenue billion Forecast, by Country 2020 & 2033
- Table 26: Turkey APAC Wireless Charging Industry Revenue (billion) Forecast, by Application 2020 & 2033
- Table 27: Israel APAC Wireless Charging Industry Revenue (billion) Forecast, by Application 2020 & 2033
- Table 28: GCC APAC Wireless Charging Industry Revenue (billion) Forecast, by Application 2020 & 2033
- Table 29: North Africa APAC Wireless Charging Industry Revenue (billion) Forecast, by Application 2020 & 2033
- Table 30: South Africa APAC Wireless Charging Industry Revenue (billion) Forecast, by Application 2020 & 2033
- Table 31: Rest of Middle East & Africa APAC Wireless Charging Industry Revenue (billion) Forecast, by Application 2020 & 2033
- Table 32: Global APAC Wireless Charging Industry Revenue billion Forecast, by Vehicle Type 2020 & 2033
- Table 33: Global APAC Wireless Charging Industry Revenue billion Forecast, by Country 2020 & 2033
- Table 34: China APAC Wireless Charging Industry Revenue (billion) Forecast, by Application 2020 & 2033
- Table 35: India APAC Wireless Charging Industry Revenue (billion) Forecast, by Application 2020 & 2033
- Table 36: Japan APAC Wireless Charging Industry Revenue (billion) Forecast, by Application 2020 & 2033
- Table 37: South Korea APAC Wireless Charging Industry Revenue (billion) Forecast, by Application 2020 & 2033
- Table 38: ASEAN APAC Wireless Charging Industry Revenue (billion) Forecast, by Application 2020 & 2033
- Table 39: Oceania APAC Wireless Charging Industry Revenue (billion) Forecast, by Application 2020 & 2033
- Table 40: Rest of Asia Pacific APAC Wireless Charging Industry Revenue (billion) Forecast, by Application 2020 & 2033
Frequently Asked Questions
1. What is the projected Compound Annual Growth Rate (CAGR) of the APAC Wireless Charging Industry?
The projected CAGR is approximately 36.2%.
2. Which companies are prominent players in the APAC Wireless Charging Industry?
Key companies in the market include Tesla Motors, Daimler AG, OLEV Technologies, BMW AG, Plugless, Bombardier, Toyota Motor Corporation, Nissan, Hella Aglaia, HEVO Powe, WiTricity, Qualcomm.
3. What are the main segments of the APAC Wireless Charging Industry?
The market segments include Vehicle Type.
4. Can you provide details about the market size?
The market size is estimated to be USD 24.4 billion as of 2022.
5. What are some drivers contributing to market growth?
Growing Sales of Electric Vehicles Aiding Market Growth.
6. What are the notable trends driving market growth?
Increasing Sales of Electric Vehicles Driving the Wireless Charging Demand.
7. Are there any restraints impacting market growth?
High Cost of Installing Wireless Chargers.
8. Can you provide examples of recent developments in the market?
June 2023: ST Microelectronics NV unveiled an array of cutting-edge products and solutions for the smart mobility sector during the MWC Shanghai event. Among the highlights was the debut of the ST P-BOX Solution, a groundbreaking technology set to revolutionize autonomous driving. Additionally, the company showcased its 100W Wireless Charging Solution, built upon the STWBC2-HP and STWLC99 platforms.
9. What pricing options are available for accessing the report?
Pricing options include single-user, multi-user, and enterprise licenses priced at USD 4750, USD 4950, and USD 6800 respectively.
10. Is the market size provided in terms of value or volume?
The market size is provided in terms of value, measured in billion.
11. Are there any specific market keywords associated with the report?
Yes, the market keyword associated with the report is "APAC Wireless Charging Industry," which aids in identifying and referencing the specific market segment covered.
12. How do I determine which pricing option suits my needs best?
The pricing options vary based on user requirements and access needs. Individual users may opt for single-user licenses, while businesses requiring broader access may choose multi-user or enterprise licenses for cost-effective access to the report.
13. Are there any additional resources or data provided in the APAC Wireless Charging Industry report?
While the report offers comprehensive insights, it's advisable to review the specific contents or supplementary materials provided to ascertain if additional resources or data are available.
14. How can I stay updated on further developments or reports in the APAC Wireless Charging Industry?
To stay informed about further developments, trends, and reports in the APAC Wireless Charging Industry, consider subscribing to industry newsletters, following relevant companies and organizations, or regularly checking reputable industry news sources and publications.
Methodology
Step 1 - Identification of Relevant Samples Size from Population Database


Step 2 - Approaches for Defining Global Market Size (Value, Volume* & Price*)

Note*: In applicable scenarios
Step 3 - Data Sources
Primary Research
- Web Analytics
- Survey Reports
- Research Institute
- Latest Research Reports
- Opinion Leaders
Secondary Research
- Annual Reports
- White Paper
- Latest Press Release
- Industry Association
- Paid Database
- Investor Presentations

Step 4 - Data Triangulation
Involves using different sources of information in order to increase the validity of a study
These sources are likely to be stakeholders in a program - participants, other researchers, program staff, other community members, and so on.
Then we put all data in single framework & apply various statistical tools to find out the dynamic on the market.
During the analysis stage, feedback from the stakeholder groups would be compared to determine areas of agreement as well as areas of divergence