
Key Insights
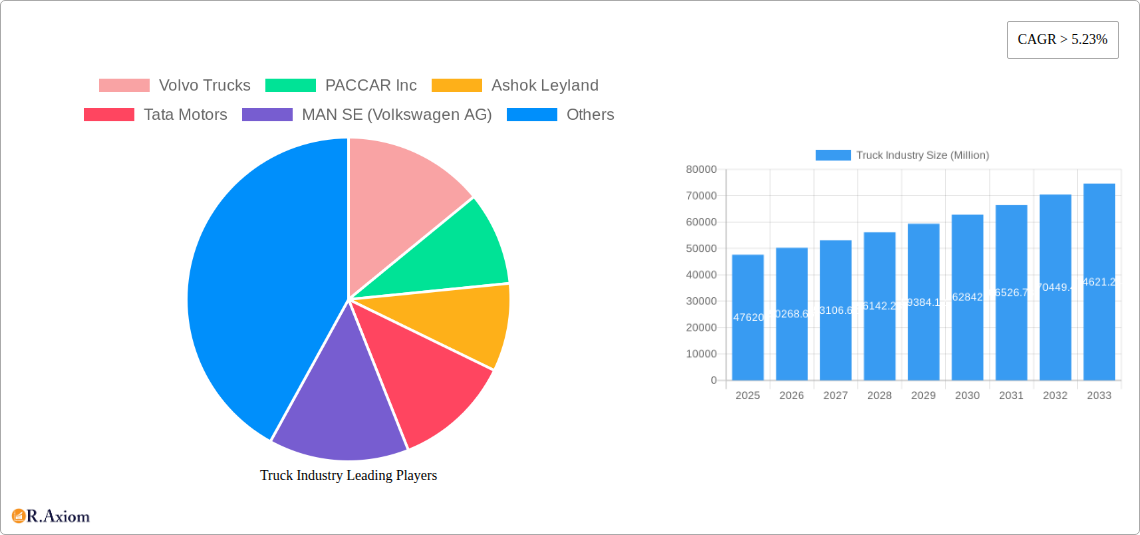
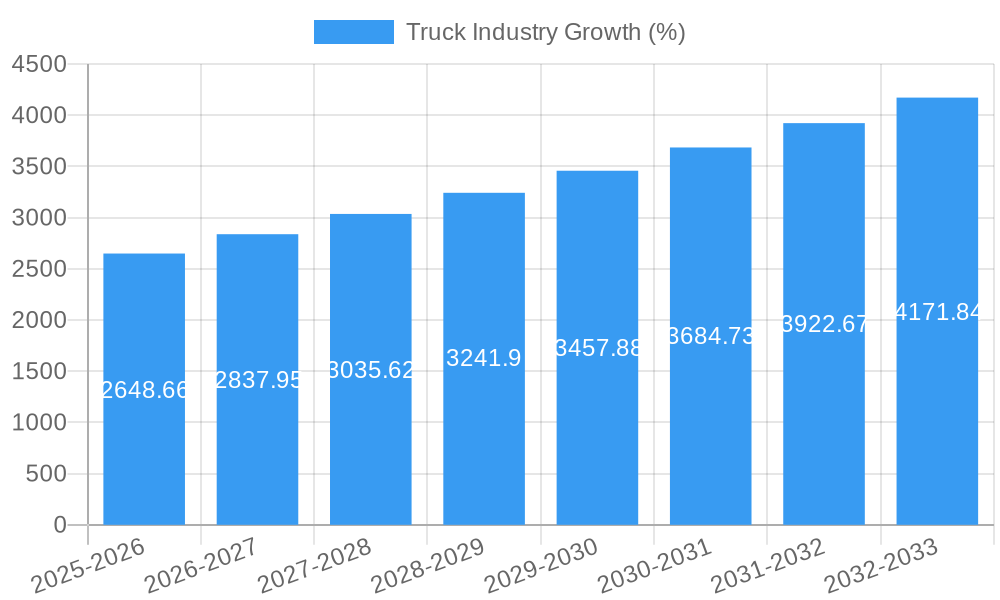
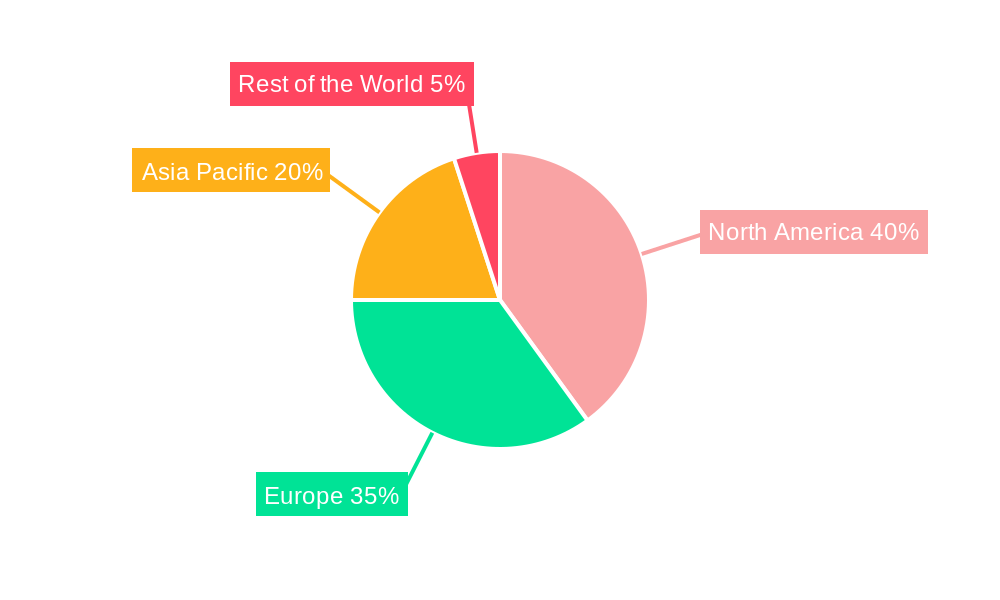
The global used truck market, valued at $47.62 billion in 2025, is projected to experience robust growth, driven by a Compound Annual Growth Rate (CAGR) exceeding 5.23% from 2025 to 2033. This expansion is fueled by several key factors. Firstly, the increasing demand for efficient and cost-effective transportation solutions across various industries, including logistics and construction, is a major driver. The rising preference for used trucks over new ones, due to their lower purchase price and operational costs, further boosts market growth. Technological advancements, such as improved telematics and engine efficiency in used trucks, are also contributing to the market's expansion. Furthermore, the growth of e-commerce and the consequent need for efficient last-mile delivery solutions are positively impacting the demand for used light and medium-duty trucks. The market is segmented by vehicle type (light, medium, and heavy-duty trucks) and sales channels (independent dealers, franchised dealers, and peer-to-peer platforms). The geographical distribution shows significant presence across North America, Europe, and Asia Pacific, with North America currently holding a substantial market share.
Growth within specific segments will vary. The light truck segment is likely to witness the most significant growth, fueled by the burgeoning e-commerce sector and the increasing number of small businesses relying on efficient delivery systems. Franchised dealers will likely maintain their strong position due to their established networks and customer trust, although the peer-to-peer segment is expected to experience a gradual rise, driven by the increasing convenience and potential cost savings it offers. Regional growth will be influenced by factors such as economic development, infrastructure investments, and government regulations. While North America and Europe will continue to be substantial markets, rapid economic growth in countries within the Asia-Pacific region, particularly India and China, will provide significant growth opportunities in the coming years. Competitive dynamics within the used truck market are intense, with established players like Volvo Trucks, PACCAR Inc., and Daimler AG competing with regional players and emerging online platforms. The industry is expected to see increased consolidation and strategic partnerships as companies strive to enhance their market presence and expand their service offerings.
This comprehensive report provides an in-depth analysis of the global truck industry, covering market size, segmentation, competitive landscape, and future growth prospects from 2019 to 2033. The report leverages extensive primary and secondary research to deliver actionable insights for industry stakeholders, investors, and strategic decision-makers. The study period spans 2019-2033, with 2025 serving as the base and estimated year. The forecast period covers 2025-2033, and the historical period encompasses 2019-2024. Key players analyzed include Volvo Trucks, PACCAR Inc, Ashok Leyland, Tata Motors, MAN SE (Volkswagen AG), Scania AB (Traton SE), Navistar International Corporation, Eicher, Renault SA, Mascus, Daimler AG (SelecTrucks), Enterprise Truck Rental, and AmeriQuest Used Truck.
Truck Industry Market Concentration & Innovation
This section analyzes the competitive intensity within the truck industry, focusing on market concentration, innovation drivers, regulatory landscapes, and strategic activities like mergers and acquisitions (M&A). The global truck market exhibits a moderately concentrated structure, with a few major players holding significant market share. Volvo Trucks and Daimler AG, for example, command substantial portions of the heavy-duty truck segment globally. However, regional variations exist, with increased fragmentation in developing markets.
- Market Share: Volvo Trucks holds an estimated xx% global market share in 2025, while Daimler AG holds approximately xx%. PACCAR Inc. and other major players account for the remaining share.
- Innovation Drivers: Stringent emission regulations, increasing fuel efficiency demands, and the rise of autonomous driving technologies are primary drivers of innovation. Advancements in telematics and connected vehicle technology are also shaping the landscape.
- Regulatory Frameworks: Government regulations concerning emissions (e.g., Euro VI/VII standards) significantly influence truck design and production. Safety standards and regulations also play a crucial role.
- Product Substitutes: Alternative transportation methods, such as railways and maritime shipping, represent potential substitutes for road freight. However, the truck industry's flexibility and reach limit this substitution's impact.
- End-User Trends: The e-commerce boom drives demand for last-mile delivery solutions, boosting the light and medium-duty truck segments. Infrastructure development projects in emerging economies fuel the demand for heavy-duty trucks.
- M&A Activities: The past five years have witnessed several significant M&A transactions within the truck industry, with deal values totaling approximately $xx million. These acquisitions aim to expand market reach, enhance technological capabilities, and optimize supply chains.
Truck Industry Industry Trends & Insights
This section delves into the significant trends shaping the global truck industry, examining market growth, technological advancements, and competitive dynamics. The industry's overall growth is projected at a CAGR of xx% during the forecast period (2025-2033). This growth stems from robust demand across various segments, driven by factors like expanding global trade, infrastructure development, and the burgeoning e-commerce sector.
Technological disruptions, such as the adoption of autonomous driving systems and electric powertrains, are transforming the industry. Consumer preferences are shifting toward fuel-efficient, technologically advanced, and safer trucks. Competitive dynamics are marked by intense rivalry among established players and the emergence of new entrants focused on electric or autonomous solutions. Market penetration of electric trucks is still relatively low but is anticipated to increase significantly in the coming years, exceeding xx% by 2033.
Dominant Markets & Segments in Truck Industry
This analysis identifies the leading geographical regions, countries, and truck segments (vehicle type and sales channel).
Dominant Regions: North America and Europe currently dominate the global truck market, driven by established economies, advanced infrastructure, and robust logistics networks. However, Asia-Pacific is experiencing rapid growth, driven by urbanization, infrastructure development, and expanding economies.
Dominant Vehicle Types: Heavy-duty trucks hold the largest market share globally, owing to their essential role in long-haul transportation and bulk freight movement. However, the medium-duty segment is expected to grow significantly due to the expansion of last-mile delivery services and urban logistics operations.
Dominant Sales Channels: Franchised dealers remain the dominant sales channel, providing customers with established networks for sales, service, and parts support. However, the independent dealer channel is gaining traction, especially in developing markets. Peer-to-peer sales are slowly gaining momentum, fueled by online marketplaces.
Key Drivers (Bullet Points):
- Economic Policies: Government incentives for purchasing fuel-efficient and environmentally friendly vehicles.
- Infrastructure Development: Investments in road networks and logistics infrastructure.
- Urbanization: Growth of urban areas drives demand for efficient last-mile delivery solutions.
- E-commerce boom: Rapid expansion of online retail fuels demand for delivery trucks.
Truck Industry Product Developments
The truck industry is witnessing rapid technological advancements, with a focus on enhanced fuel efficiency, safety features, and driver assistance systems. Electric trucks are gaining prominence, driven by environmental concerns and government regulations. Autonomous driving technology is also making significant inroads, though widespread adoption remains a few years away. These innovations address evolving market needs and create competitive advantages for manufacturers who successfully integrate them into their offerings.
Report Scope & Segmentation Analysis
This report segments the truck market by vehicle type (Light, Medium, and Heavy-duty trucks) and sales channel (Independent Dealer, Franchised Dealer, Peer-to-peer). Each segment's growth projections, market sizes, and competitive dynamics are analyzed in detail. For example, the heavy-duty segment is expected to experience a xx% CAGR, with a market size of $xx million by 2033. Competition is fierce among established manufacturers, with innovation and strategic partnerships playing crucial roles. The franchised dealer channel is expected to maintain its dominance, supported by its established network and customer relationships. However, growth is projected for independent dealers, particularly in the used truck market. The peer-to-peer market is experiencing nascent growth, driven by online marketplaces connecting buyers and sellers directly.
Key Drivers of Truck Industry Growth
The truck industry's growth is propelled by several key factors: growing global trade necessitates efficient transportation; infrastructure development in emerging economies fuels demand; e-commerce expansion necessitates robust last-mile delivery systems; technological advancements, like autonomous driving and electrification, are transforming the sector; and favorable government policies and regulations encouraging the adoption of cleaner and safer trucks further stimulate industry growth.
Challenges in the Truck Industry Sector
The truck industry faces several challenges: stringent emission regulations require substantial investments in new technologies; supply chain disruptions can impact production and delivery; intense competition among established manufacturers and new entrants put pressure on pricing and margins; fluctuations in fuel prices and raw material costs affect operational profitability; and the driver shortage remains a persistent issue across many regions.
Emerging Opportunities in Truck Industry
Emerging opportunities in the truck industry are abundant: the growing demand for electric trucks opens up significant market potential; the development of autonomous driving technologies offers improved safety and efficiency; the expansion of connected vehicle technology enhances fleet management capabilities; the growth of the used truck market presents a new revenue stream for manufacturers and dealers; and focusing on sustainable and environmentally friendly transportation solutions aligns with evolving consumer and regulatory preferences.
Leading Players in the Truck Industry Market
- Volvo Trucks
- PACCAR Inc
- Ashok Leyland
- Tata Motors
- MAN SE (Volkswagen AG)
- Scania AB (Traton SE)
- Navistar International Corporation
- Eicher
- Renault SA
- Mascus
- Daimler AG (SelecTrucks)
- Enterprise Truck Rental
- AmeriQuest Used Truck
Key Developments in Truck Industry Industry
- August 2023: Ashok Leyland launched its e-marketplace 'Re-AL' for used trucks, facilitating exchanges and upgrades. This development expands the used truck market and strengthens Ashok Leyland's customer base.
- June 2023: Daimler introduced the "Bharat Benz Certified" platform for pre-owned trucks, enhancing customer trust and promoting sustainability in the used truck market through quality assurance and maintenance contracts.
Strategic Outlook for Truck Industry Market
The truck industry is poised for continued growth, driven by technological advancements, evolving consumer preferences, and expansion in developing economies. The shift toward electric and autonomous vehicles will reshape the competitive landscape, presenting both challenges and opportunities for established manufacturers and new entrants. Strategic investments in research and development, supply chain optimization, and customer relationship management will be crucial for success in this dynamic market.
Truck Industry Segmentation
-
1. Vehicle Type
- 1.1. Light Trucks
- 1.2. Medium-duty Trucks
- 1.3. Heavy-duty Trucks
-
2. Sales Channel
- 2.1. Independent Dealer
- 2.2. Franchised Dealer
- 2.3. Peer-to-peer
Truck Industry Segmentation By Geography
-
1. North America
- 1.1. United States
- 1.2. Canada
- 1.3. Rest of North America
-
2. Europe
- 2.1. Germany
- 2.2. United Kingdom
- 2.3. France
- 2.4. Russia
- 2.5. Italy
- 2.6. Rest of Europe
-
3. Asia Pacific
- 3.1. China
- 3.2. Japan
- 3.3. India
- 3.4. South Korea
- 3.5. Rest of Asia Pacific
-
4. Rest of the World
- 4.1. Brazil
- 4.2. South Africa
- 4.3. Other Countries
Truck Industry REPORT HIGHLIGHTS
| Aspects | Details |
|---|---|
| Study Period | 2019-2033 |
| Base Year | 2024 |
| Estimated Year | 2025 |
| Forecast Period | 2025-2033 |
| Historical Period | 2019-2024 |
| Growth Rate | CAGR of > 5.23% from 2019-2033 |
| Segmentation |
|
Table of Contents
- 1. Introduction
- 1.1. Research Scope
- 1.2. Market Segmentation
- 1.3. Research Methodology
- 1.4. Definitions and Assumptions
- 2. Executive Summary
- 2.1. Introduction
- 3. Market Dynamics
- 3.1. Introduction
- 3.2. Market Drivers
- 3.2.1. Increasing Infrastructure and Growing Construction Activities are Driving the Demand for Used Trucks; Cost Effectiveness and Affordability are Fueling the Demand for Used Trucks
- 3.3. Market Restrains
- 3.3.1. Stringent Emission and Safety Standards Present Challenges for the Market
- 3.4. Market Trends
- 3.4.1. Heavy-duty Trucks Will be the Leading Segment
- 4. Market Factor Analysis
- 4.1. Porters Five Forces
- 4.2. Supply/Value Chain
- 4.3. PESTEL analysis
- 4.4. Market Entropy
- 4.5. Patent/Trademark Analysis
- 5. Global Truck Industry Analysis, Insights and Forecast, 2019-2031
- 5.1. Market Analysis, Insights and Forecast - by Vehicle Type
- 5.1.1. Light Trucks
- 5.1.2. Medium-duty Trucks
- 5.1.3. Heavy-duty Trucks
- 5.2. Market Analysis, Insights and Forecast - by Sales Channel
- 5.2.1. Independent Dealer
- 5.2.2. Franchised Dealer
- 5.2.3. Peer-to-peer
- 5.3. Market Analysis, Insights and Forecast - by Region
- 5.3.1. North America
- 5.3.2. Europe
- 5.3.3. Asia Pacific
- 5.3.4. Rest of the World
- 5.1. Market Analysis, Insights and Forecast - by Vehicle Type
- 6. North America Truck Industry Analysis, Insights and Forecast, 2019-2031
- 6.1. Market Analysis, Insights and Forecast - by Vehicle Type
- 6.1.1. Light Trucks
- 6.1.2. Medium-duty Trucks
- 6.1.3. Heavy-duty Trucks
- 6.2. Market Analysis, Insights and Forecast - by Sales Channel
- 6.2.1. Independent Dealer
- 6.2.2. Franchised Dealer
- 6.2.3. Peer-to-peer
- 6.1. Market Analysis, Insights and Forecast - by Vehicle Type
- 7. Europe Truck Industry Analysis, Insights and Forecast, 2019-2031
- 7.1. Market Analysis, Insights and Forecast - by Vehicle Type
- 7.1.1. Light Trucks
- 7.1.2. Medium-duty Trucks
- 7.1.3. Heavy-duty Trucks
- 7.2. Market Analysis, Insights and Forecast - by Sales Channel
- 7.2.1. Independent Dealer
- 7.2.2. Franchised Dealer
- 7.2.3. Peer-to-peer
- 7.1. Market Analysis, Insights and Forecast - by Vehicle Type
- 8. Asia Pacific Truck Industry Analysis, Insights and Forecast, 2019-2031
- 8.1. Market Analysis, Insights and Forecast - by Vehicle Type
- 8.1.1. Light Trucks
- 8.1.2. Medium-duty Trucks
- 8.1.3. Heavy-duty Trucks
- 8.2. Market Analysis, Insights and Forecast - by Sales Channel
- 8.2.1. Independent Dealer
- 8.2.2. Franchised Dealer
- 8.2.3. Peer-to-peer
- 8.1. Market Analysis, Insights and Forecast - by Vehicle Type
- 9. Rest of the World Truck Industry Analysis, Insights and Forecast, 2019-2031
- 9.1. Market Analysis, Insights and Forecast - by Vehicle Type
- 9.1.1. Light Trucks
- 9.1.2. Medium-duty Trucks
- 9.1.3. Heavy-duty Trucks
- 9.2. Market Analysis, Insights and Forecast - by Sales Channel
- 9.2.1. Independent Dealer
- 9.2.2. Franchised Dealer
- 9.2.3. Peer-to-peer
- 9.1. Market Analysis, Insights and Forecast - by Vehicle Type
- 10. North America Truck Industry Analysis, Insights and Forecast, 2019-2031
- 10.1. Market Analysis, Insights and Forecast - By Country/Sub-region
- 10.1.1 United States
- 10.1.2 Canada
- 10.1.3 Rest of North America
- 11. Europe Truck Industry Analysis, Insights and Forecast, 2019-2031
- 11.1. Market Analysis, Insights and Forecast - By Country/Sub-region
- 11.1.1 Germany
- 11.1.2 United Kingdom
- 11.1.3 France
- 11.1.4 Russia
- 11.1.5 Italy
- 11.1.6 Rest of Europe
- 12. Asia Pacific Truck Industry Analysis, Insights and Forecast, 2019-2031
- 12.1. Market Analysis, Insights and Forecast - By Country/Sub-region
- 12.1.1 China
- 12.1.2 Japan
- 12.1.3 India
- 12.1.4 South Korea
- 12.1.5 Rest of Asia Pacific
- 13. Rest of the World Truck Industry Analysis, Insights and Forecast, 2019-2031
- 13.1. Market Analysis, Insights and Forecast - By Country/Sub-region
- 13.1.1 Brazil
- 13.1.2 South Africa
- 13.1.3 Other Countries
- 14. Competitive Analysis
- 14.1. Global Market Share Analysis 2024
- 14.2. Company Profiles
- 14.2.1 Volvo Trucks
- 14.2.1.1. Overview
- 14.2.1.2. Products
- 14.2.1.3. SWOT Analysis
- 14.2.1.4. Recent Developments
- 14.2.1.5. Financials (Based on Availability)
- 14.2.2 PACCAR Inc
- 14.2.2.1. Overview
- 14.2.2.2. Products
- 14.2.2.3. SWOT Analysis
- 14.2.2.4. Recent Developments
- 14.2.2.5. Financials (Based on Availability)
- 14.2.3 Ashok Leyland
- 14.2.3.1. Overview
- 14.2.3.2. Products
- 14.2.3.3. SWOT Analysis
- 14.2.3.4. Recent Developments
- 14.2.3.5. Financials (Based on Availability)
- 14.2.4 Tata Motors
- 14.2.4.1. Overview
- 14.2.4.2. Products
- 14.2.4.3. SWOT Analysis
- 14.2.4.4. Recent Developments
- 14.2.4.5. Financials (Based on Availability)
- 14.2.5 MAN SE (Volkswagen AG)
- 14.2.5.1. Overview
- 14.2.5.2. Products
- 14.2.5.3. SWOT Analysis
- 14.2.5.4. Recent Developments
- 14.2.5.5. Financials (Based on Availability)
- 14.2.6 Scania AB ( Traton SE)
- 14.2.6.1. Overview
- 14.2.6.2. Products
- 14.2.6.3. SWOT Analysis
- 14.2.6.4. Recent Developments
- 14.2.6.5. Financials (Based on Availability)
- 14.2.7 Navistar International Corporation
- 14.2.7.1. Overview
- 14.2.7.2. Products
- 14.2.7.3. SWOT Analysis
- 14.2.7.4. Recent Developments
- 14.2.7.5. Financials (Based on Availability)
- 14.2.8 Eicher
- 14.2.8.1. Overview
- 14.2.8.2. Products
- 14.2.8.3. SWOT Analysis
- 14.2.8.4. Recent Developments
- 14.2.8.5. Financials (Based on Availability)
- 14.2.9 Renault SA
- 14.2.9.1. Overview
- 14.2.9.2. Products
- 14.2.9.3. SWOT Analysis
- 14.2.9.4. Recent Developments
- 14.2.9.5. Financials (Based on Availability)
- 14.2.10 Mascus
- 14.2.10.1. Overview
- 14.2.10.2. Products
- 14.2.10.3. SWOT Analysis
- 14.2.10.4. Recent Developments
- 14.2.10.5. Financials (Based on Availability)
- 14.2.11 Daimler AG (SelecTrucks)
- 14.2.11.1. Overview
- 14.2.11.2. Products
- 14.2.11.3. SWOT Analysis
- 14.2.11.4. Recent Developments
- 14.2.11.5. Financials (Based on Availability)
- 14.2.12 Enterprise Truck Rental
- 14.2.12.1. Overview
- 14.2.12.2. Products
- 14.2.12.3. SWOT Analysis
- 14.2.12.4. Recent Developments
- 14.2.12.5. Financials (Based on Availability)
- 14.2.13 AmeriQuest Used Truck
- 14.2.13.1. Overview
- 14.2.13.2. Products
- 14.2.13.3. SWOT Analysis
- 14.2.13.4. Recent Developments
- 14.2.13.5. Financials (Based on Availability)
- 14.2.1 Volvo Trucks
List of Figures
- Figure 1: Global Truck Industry Revenue Breakdown (Million, %) by Region 2024 & 2032
- Figure 2: North America Truck Industry Revenue (Million), by Country 2024 & 2032
- Figure 3: North America Truck Industry Revenue Share (%), by Country 2024 & 2032
- Figure 4: Europe Truck Industry Revenue (Million), by Country 2024 & 2032
- Figure 5: Europe Truck Industry Revenue Share (%), by Country 2024 & 2032
- Figure 6: Asia Pacific Truck Industry Revenue (Million), by Country 2024 & 2032
- Figure 7: Asia Pacific Truck Industry Revenue Share (%), by Country 2024 & 2032
- Figure 8: Rest of the World Truck Industry Revenue (Million), by Country 2024 & 2032
- Figure 9: Rest of the World Truck Industry Revenue Share (%), by Country 2024 & 2032
- Figure 10: North America Truck Industry Revenue (Million), by Vehicle Type 2024 & 2032
- Figure 11: North America Truck Industry Revenue Share (%), by Vehicle Type 2024 & 2032
- Figure 12: North America Truck Industry Revenue (Million), by Sales Channel 2024 & 2032
- Figure 13: North America Truck Industry Revenue Share (%), by Sales Channel 2024 & 2032
- Figure 14: North America Truck Industry Revenue (Million), by Country 2024 & 2032
- Figure 15: North America Truck Industry Revenue Share (%), by Country 2024 & 2032
- Figure 16: Europe Truck Industry Revenue (Million), by Vehicle Type 2024 & 2032
- Figure 17: Europe Truck Industry Revenue Share (%), by Vehicle Type 2024 & 2032
- Figure 18: Europe Truck Industry Revenue (Million), by Sales Channel 2024 & 2032
- Figure 19: Europe Truck Industry Revenue Share (%), by Sales Channel 2024 & 2032
- Figure 20: Europe Truck Industry Revenue (Million), by Country 2024 & 2032
- Figure 21: Europe Truck Industry Revenue Share (%), by Country 2024 & 2032
- Figure 22: Asia Pacific Truck Industry Revenue (Million), by Vehicle Type 2024 & 2032
- Figure 23: Asia Pacific Truck Industry Revenue Share (%), by Vehicle Type 2024 & 2032
- Figure 24: Asia Pacific Truck Industry Revenue (Million), by Sales Channel 2024 & 2032
- Figure 25: Asia Pacific Truck Industry Revenue Share (%), by Sales Channel 2024 & 2032
- Figure 26: Asia Pacific Truck Industry Revenue (Million), by Country 2024 & 2032
- Figure 27: Asia Pacific Truck Industry Revenue Share (%), by Country 2024 & 2032
- Figure 28: Rest of the World Truck Industry Revenue (Million), by Vehicle Type 2024 & 2032
- Figure 29: Rest of the World Truck Industry Revenue Share (%), by Vehicle Type 2024 & 2032
- Figure 30: Rest of the World Truck Industry Revenue (Million), by Sales Channel 2024 & 2032
- Figure 31: Rest of the World Truck Industry Revenue Share (%), by Sales Channel 2024 & 2032
- Figure 32: Rest of the World Truck Industry Revenue (Million), by Country 2024 & 2032
- Figure 33: Rest of the World Truck Industry Revenue Share (%), by Country 2024 & 2032
List of Tables
- Table 1: Global Truck Industry Revenue Million Forecast, by Region 2019 & 2032
- Table 2: Global Truck Industry Revenue Million Forecast, by Vehicle Type 2019 & 2032
- Table 3: Global Truck Industry Revenue Million Forecast, by Sales Channel 2019 & 2032
- Table 4: Global Truck Industry Revenue Million Forecast, by Region 2019 & 2032
- Table 5: Global Truck Industry Revenue Million Forecast, by Country 2019 & 2032
- Table 6: United States Truck Industry Revenue (Million) Forecast, by Application 2019 & 2032
- Table 7: Canada Truck Industry Revenue (Million) Forecast, by Application 2019 & 2032
- Table 8: Rest of North America Truck Industry Revenue (Million) Forecast, by Application 2019 & 2032
- Table 9: Global Truck Industry Revenue Million Forecast, by Country 2019 & 2032
- Table 10: Germany Truck Industry Revenue (Million) Forecast, by Application 2019 & 2032
- Table 11: United Kingdom Truck Industry Revenue (Million) Forecast, by Application 2019 & 2032
- Table 12: France Truck Industry Revenue (Million) Forecast, by Application 2019 & 2032
- Table 13: Russia Truck Industry Revenue (Million) Forecast, by Application 2019 & 2032
- Table 14: Italy Truck Industry Revenue (Million) Forecast, by Application 2019 & 2032
- Table 15: Rest of Europe Truck Industry Revenue (Million) Forecast, by Application 2019 & 2032
- Table 16: Global Truck Industry Revenue Million Forecast, by Country 2019 & 2032
- Table 17: China Truck Industry Revenue (Million) Forecast, by Application 2019 & 2032
- Table 18: Japan Truck Industry Revenue (Million) Forecast, by Application 2019 & 2032
- Table 19: India Truck Industry Revenue (Million) Forecast, by Application 2019 & 2032
- Table 20: South Korea Truck Industry Revenue (Million) Forecast, by Application 2019 & 2032
- Table 21: Rest of Asia Pacific Truck Industry Revenue (Million) Forecast, by Application 2019 & 2032
- Table 22: Global Truck Industry Revenue Million Forecast, by Country 2019 & 2032
- Table 23: Brazil Truck Industry Revenue (Million) Forecast, by Application 2019 & 2032
- Table 24: South Africa Truck Industry Revenue (Million) Forecast, by Application 2019 & 2032
- Table 25: Other Countries Truck Industry Revenue (Million) Forecast, by Application 2019 & 2032
- Table 26: Global Truck Industry Revenue Million Forecast, by Vehicle Type 2019 & 2032
- Table 27: Global Truck Industry Revenue Million Forecast, by Sales Channel 2019 & 2032
- Table 28: Global Truck Industry Revenue Million Forecast, by Country 2019 & 2032
- Table 29: United States Truck Industry Revenue (Million) Forecast, by Application 2019 & 2032
- Table 30: Canada Truck Industry Revenue (Million) Forecast, by Application 2019 & 2032
- Table 31: Rest of North America Truck Industry Revenue (Million) Forecast, by Application 2019 & 2032
- Table 32: Global Truck Industry Revenue Million Forecast, by Vehicle Type 2019 & 2032
- Table 33: Global Truck Industry Revenue Million Forecast, by Sales Channel 2019 & 2032
- Table 34: Global Truck Industry Revenue Million Forecast, by Country 2019 & 2032
- Table 35: Germany Truck Industry Revenue (Million) Forecast, by Application 2019 & 2032
- Table 36: United Kingdom Truck Industry Revenue (Million) Forecast, by Application 2019 & 2032
- Table 37: France Truck Industry Revenue (Million) Forecast, by Application 2019 & 2032
- Table 38: Russia Truck Industry Revenue (Million) Forecast, by Application 2019 & 2032
- Table 39: Italy Truck Industry Revenue (Million) Forecast, by Application 2019 & 2032
- Table 40: Rest of Europe Truck Industry Revenue (Million) Forecast, by Application 2019 & 2032
- Table 41: Global Truck Industry Revenue Million Forecast, by Vehicle Type 2019 & 2032
- Table 42: Global Truck Industry Revenue Million Forecast, by Sales Channel 2019 & 2032
- Table 43: Global Truck Industry Revenue Million Forecast, by Country 2019 & 2032
- Table 44: China Truck Industry Revenue (Million) Forecast, by Application 2019 & 2032
- Table 45: Japan Truck Industry Revenue (Million) Forecast, by Application 2019 & 2032
- Table 46: India Truck Industry Revenue (Million) Forecast, by Application 2019 & 2032
- Table 47: South Korea Truck Industry Revenue (Million) Forecast, by Application 2019 & 2032
- Table 48: Rest of Asia Pacific Truck Industry Revenue (Million) Forecast, by Application 2019 & 2032
- Table 49: Global Truck Industry Revenue Million Forecast, by Vehicle Type 2019 & 2032
- Table 50: Global Truck Industry Revenue Million Forecast, by Sales Channel 2019 & 2032
- Table 51: Global Truck Industry Revenue Million Forecast, by Country 2019 & 2032
- Table 52: Brazil Truck Industry Revenue (Million) Forecast, by Application 2019 & 2032
- Table 53: South Africa Truck Industry Revenue (Million) Forecast, by Application 2019 & 2032
- Table 54: Other Countries Truck Industry Revenue (Million) Forecast, by Application 2019 & 2032
Frequently Asked Questions
1. What is the projected Compound Annual Growth Rate (CAGR) of the Truck Industry?
The projected CAGR is approximately > 5.23%.
2. Which companies are prominent players in the Truck Industry?
Key companies in the market include Volvo Trucks, PACCAR Inc, Ashok Leyland, Tata Motors, MAN SE (Volkswagen AG), Scania AB ( Traton SE), Navistar International Corporation, Eicher, Renault SA, Mascus, Daimler AG (SelecTrucks), Enterprise Truck Rental, AmeriQuest Used Truck.
3. What are the main segments of the Truck Industry?
The market segments include Vehicle Type, Sales Channel.
4. Can you provide details about the market size?
The market size is estimated to be USD 47.62 Million as of 2022.
5. What are some drivers contributing to market growth?
Increasing Infrastructure and Growing Construction Activities are Driving the Demand for Used Trucks; Cost Effectiveness and Affordability are Fueling the Demand for Used Trucks.
6. What are the notable trends driving market growth?
Heavy-duty Trucks Will be the Leading Segment.
7. Are there any restraints impacting market growth?
Stringent Emission and Safety Standards Present Challenges for the Market.
8. Can you provide examples of recent developments in the market?
August 2023: Ashok Leyland introduced its e-marketplace 'Re-AL', dedicated to the sale of used trucks. The platform enables customers to exchange their existing commercial vehicles and upgrade to new Ashok Leyland trucks and buses. The e-marketplace provides customers with various features to help them easily locate vehicles of their choice, including verified images of the vehicles, validated documents, and evaluation reports.
9. What pricing options are available for accessing the report?
Pricing options include single-user, multi-user, and enterprise licenses priced at USD 4750, USD 5250, and USD 8750 respectively.
10. Is the market size provided in terms of value or volume?
The market size is provided in terms of value, measured in Million.
11. Are there any specific market keywords associated with the report?
Yes, the market keyword associated with the report is "Truck Industry," which aids in identifying and referencing the specific market segment covered.
12. How do I determine which pricing option suits my needs best?
The pricing options vary based on user requirements and access needs. Individual users may opt for single-user licenses, while businesses requiring broader access may choose multi-user or enterprise licenses for cost-effective access to the report.
13. Are there any additional resources or data provided in the Truck Industry report?
While the report offers comprehensive insights, it's advisable to review the specific contents or supplementary materials provided to ascertain if additional resources or data are available.
14. How can I stay updated on further developments or reports in the Truck Industry?
To stay informed about further developments, trends, and reports in the Truck Industry, consider subscribing to industry newsletters, following relevant companies and organizations, or regularly checking reputable industry news sources and publications.
Methodology
Step 1 - Identification of Relevant Samples Size from Population Database


Step 2 - Approaches for Defining Global Market Size (Value, Volume* & Price*)

Note*: In applicable scenarios
Step 3 - Data Sources
Primary Research
- Web Analytics
- Survey Reports
- Research Institute
- Latest Research Reports
- Opinion Leaders
Secondary Research
- Annual Reports
- White Paper
- Latest Press Release
- Industry Association
- Paid Database
- Investor Presentations

Step 4 - Data Triangulation
Involves using different sources of information in order to increase the validity of a study
These sources are likely to be stakeholders in a program - participants, other researchers, program staff, other community members, and so on.
Then we put all data in single framework & apply various statistical tools to find out the dynamic on the market.
During the analysis stage, feedback from the stakeholder groups would be compared to determine areas of agreement as well as areas of divergence


