
Key Insights
The Asia-Pacific (APAC) wireless sensor market is experiencing robust growth, driven by the increasing adoption of smart technologies across various sectors. The region's burgeoning economies, coupled with rapid industrialization and urbanization, are fueling demand for efficient monitoring and control systems. A significant factor contributing to this growth is the proliferation of IoT (Internet of Things) applications, where wireless sensors play a crucial role in collecting and transmitting real-time data. Key industries like automotive, healthcare, and energy and power are rapidly adopting wireless sensor technologies to enhance operational efficiency, improve safety, and reduce costs. The automotive sector, in particular, is a major driver, utilizing wireless sensors in advanced driver-assistance systems (ADAS) and connected car technologies. Similarly, the healthcare sector leverages wireless sensors for remote patient monitoring, wearable health trackers, and improved diagnostics. Furthermore, the rising focus on predictive maintenance in manufacturing and the increasing need for environmental monitoring contribute significantly to market expansion. While challenges such as security concerns related to data transmission and interoperability issues exist, the overall market trajectory indicates a sustained period of high growth, promising lucrative opportunities for market players in the coming years.
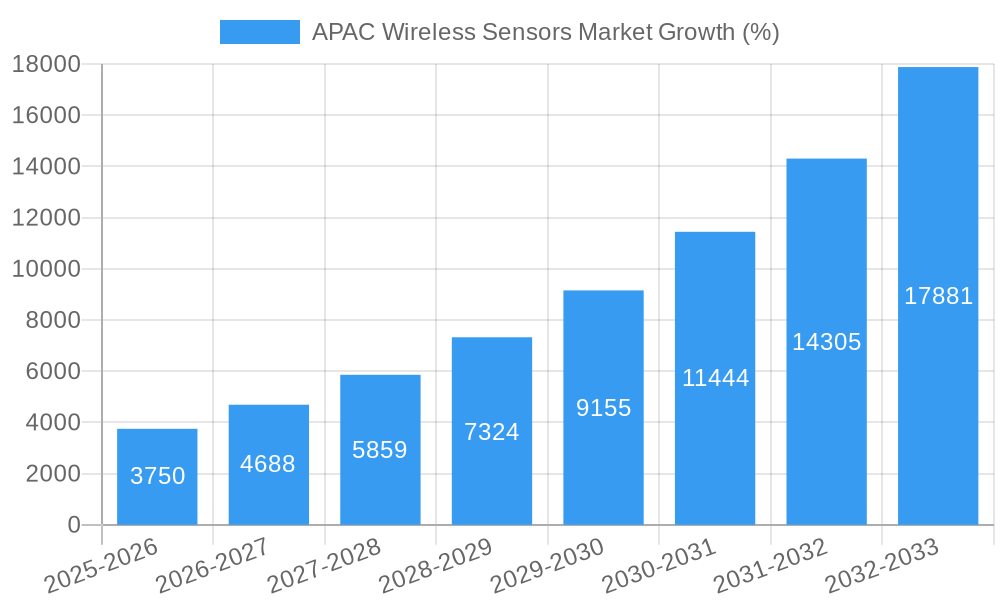
Despite some initial restraints, the overall market trend suggests a positive outlook for APAC wireless sensors. The market's segmentation by sensor type (pressure, temperature, image, etc.) and industry showcases diverse applications with varying growth rates. For example, the demand for chemical and gas sensors is expected to witness substantial growth due to increased environmental regulations and safety concerns in industries like oil and gas. Similarly, the healthcare sector’s increasing adoption of remote patient monitoring solutions is driving demand for physiological sensors. Competitive dynamics are shaping the market with established players like Honeywell, ABB, and Siemens competing with emerging technology providers. The market is expected to witness further consolidation through strategic partnerships, acquisitions, and technological advancements. Government initiatives promoting digital transformation across various industries are also providing a positive impetus to the growth of the APAC wireless sensor market. Considering the given CAGR of 25.29%, a conservative estimate suggests a substantial market expansion throughout the forecast period.
APAC Wireless Sensors Market: A Comprehensive Report (2019-2033)
This in-depth report provides a comprehensive analysis of the Asia-Pacific (APAC) wireless sensors market, covering the period from 2019 to 2033. It offers actionable insights for industry stakeholders, investors, and businesses seeking to understand the market's dynamics, growth potential, and competitive landscape. The report leverages extensive market research, including analysis of key players, segments, and trends, to deliver a precise and insightful perspective. The base year for this analysis is 2025, with estimations for 2025 and a forecast period spanning 2025-2033. The historical period covered is 2019-2024.
APAC Wireless Sensors Market Concentration & Innovation
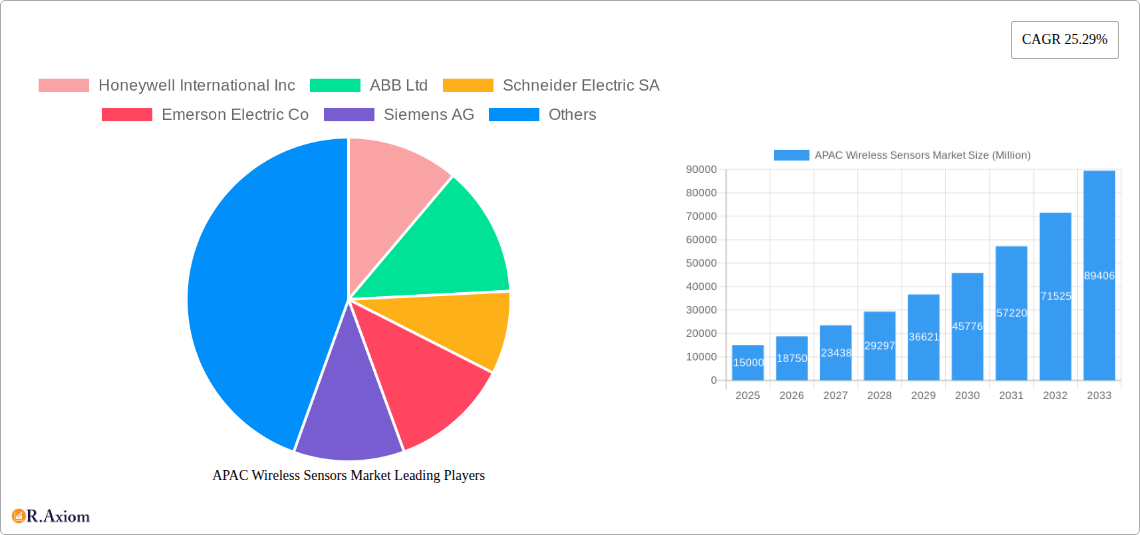
The APAC wireless sensors market exhibits a moderately concentrated landscape, with key players like Honeywell International Inc, ABB Ltd, Schneider Electric SA, Emerson Electric Co, and Siemens AG holding significant market share. However, the market is also characterized by a considerable presence of smaller, specialized companies focusing on niche applications. Market share fluctuations are influenced by factors like technological advancements, strategic partnerships, and mergers & acquisitions (M&A).
Market Concentration Metrics:
- Top 5 players market share: xx% (estimated)
- Average M&A deal value (2019-2024): USD xx Million
Innovation Drivers:
- Advancements in low-power wide-area networks (LPWAN) technologies like LoRaWAN and NB-IoT are driving market growth by enabling wider deployments.
- The rising adoption of IoT (Internet of Things) across various industries is a key catalyst.
- The demand for miniaturized, energy-efficient sensors is propelling innovation in sensor design and manufacturing.
Regulatory Frameworks & Product Substitutes:
Regulatory compliance requirements vary across countries in APAC. Stringent data privacy regulations are influencing the design and deployment of wireless sensors. While there are few direct substitutes for wireless sensors in many applications, wired sensors offer an alternative in certain contexts; however, their limitations in terms of flexibility and scalability make them less attractive for many use cases.
End-User Trends & M&A Activities:
The increasing focus on automation and digital transformation across industries is driving demand for wireless sensors. M&A activities are primarily driven by the need to expand product portfolios, enhance technological capabilities, and access new markets. For example, SoftBank's USD 200 Million investment in Wiliot Inc. (July 2021) highlights the strategic interest in battery-free sensor technologies.
APAC Wireless Sensors Market Industry Trends & Insights
The APAC wireless sensors market is experiencing robust growth, driven by a confluence of factors, including the escalating adoption of IoT, the increasing demand for industrial automation, and the expansion of smart infrastructure projects. The market's Compound Annual Growth Rate (CAGR) during the forecast period (2025-2033) is estimated to be xx%. Market penetration is increasing significantly across various industries, particularly in automotive, healthcare, and energy & power sectors.
Technological disruptions, particularly in areas like AI and machine learning, are impacting sensor design and data analytics capabilities. Consumer preferences for more reliable and connected devices are driving manufacturers to focus on improved sensor quality, durability, and data security. Competitive dynamics are shaping market behavior, with leading players vying for market share through product innovation, strategic alliances, and cost optimization strategies. The market is also witnessing the emergence of new players offering innovative solutions.
Dominant Markets & Segments in APAC Wireless Sensors Market
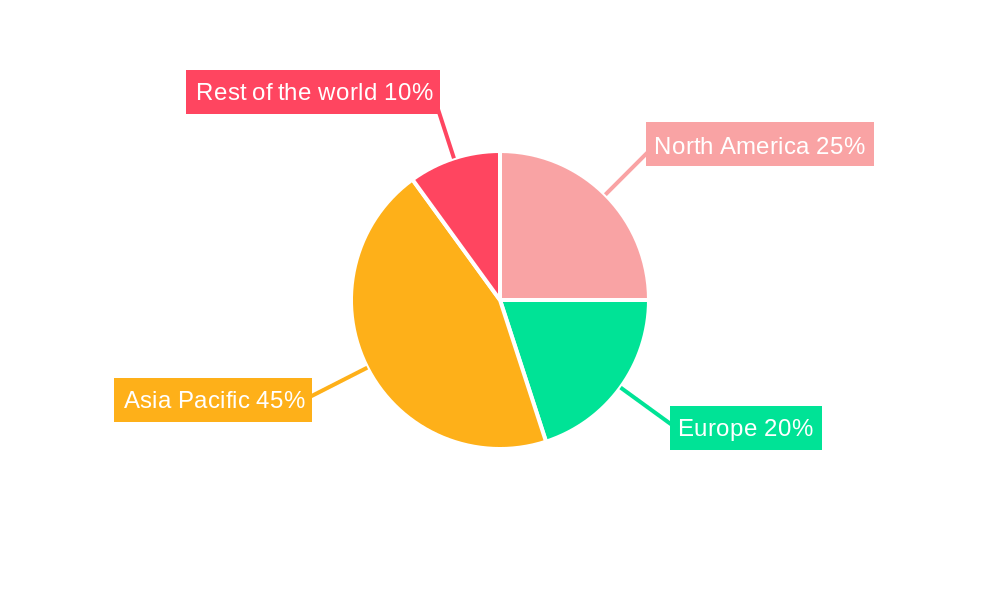
Dominant Region/Country: China holds the largest market share in APAC due to its vast industrial base, substantial investments in infrastructure development, and a rapidly growing IoT market. Japan and India are also significant markets experiencing considerable growth.
Dominant Sensor Type: The pressure sensor segment holds the largest market share currently driven by its widespread use in industrial automation and process monitoring.
Dominant Industry: The automotive industry represents a significant market segment for wireless sensors, particularly for applications such as advanced driver-assistance systems (ADAS) and vehicle diagnostics.
Key Drivers:
- China: Government initiatives supporting IoT and industrial automation, growing manufacturing sector.
- Japan: Focus on advanced automation in manufacturing, strong R&D capabilities.
- India: Rapid industrialization, increasing adoption of smart infrastructure solutions.
- Automotive: Rising demand for ADAS, connected car technology.
- Healthcare: Growing adoption of remote patient monitoring, increased healthcare infrastructure investment.
APAC Wireless Sensors Market Product Developments
Recent product innovations focus on miniaturization, energy efficiency, and enhanced connectivity. Manufacturers are developing sensors with improved accuracy, longer battery life, and advanced data processing capabilities. New wireless sensor applications are emerging in areas such as smart agriculture, environmental monitoring, and asset tracking. These developments reflect a concerted effort to meet the diverse needs of various industry verticals.
Report Scope & Segmentation Analysis
Type of Sensor: Pressure, Temperature, Image, Flow, Chemical and Gas, Position and Proximity, Others. Each segment shows varying growth rates based on specific industry demand and technological advancements.
Industry: Automotive, Healthcare, Aerospace and Defense, Energy and Power, Oil and Gas, Food and Beverage, Others. Market size and growth are heavily dependent on industry-specific adoption rates and technological integration.
Country: China, Japan, India, Others. Regional market dynamics are shaped by factors like economic development, infrastructure, and regulatory landscapes.
Key Drivers of APAC Wireless Sensors Market Growth
The APAC wireless sensors market is fueled by several key factors: Firstly, the widespread adoption of IoT across various sectors is creating a substantial demand for wireless sensors. Secondly, rapid industrialization and automation initiatives across APAC countries are driving substantial growth. Finally, government investments in smart cities and infrastructure projects are further stimulating market expansion. The development of advanced technologies like LPWAN and 5G is facilitating the deployment of cost-effective and reliable wireless sensor networks.
Challenges in the APAC Wireless Sensors Market Sector
The APAC wireless sensors market faces several challenges. Interoperability issues across different sensor technologies can hinder seamless data integration. Supply chain disruptions and fluctuating raw material costs can impact production and profitability. Lastly, cybersecurity concerns related to data security and network vulnerabilities pose risks to market growth. These issues need to be addressed for sustainable market expansion.
Emerging Opportunities in APAC Wireless Sensors Market
The APAC wireless sensors market presents significant opportunities. The rising demand for smart agriculture solutions presents a new growth avenue, as does the burgeoning need for environmental monitoring and disaster management systems. The expansion of 5G networks will provide enhanced connectivity and enable real-time data transmission, opening new possibilities. Furthermore, the increasing focus on predictive maintenance and asset management creates a significant opportunity for the adoption of wireless sensors.
Leading Players in the APAC Wireless Sensors Market Market
- Honeywell International Inc
- ABB Ltd
- Schneider Electric SA
- Emerson Electric Co
- Siemens AG
- STMicroelectronics
- Texas Instruments Incorporated
- Rockwell Automation Inc
- Yokogawa Electric Corporation
- Endress+Hauser SA
- General Electric
Key Developments in APAC Wireless Sensors Market Industry
July 2021: SoftBank Group Corp.'s Vision Fund 2 invested USD 200 Million in Wiliot Inc., a semiconductor company developing battery-free sensor tags for manufacturing and logistics. This investment signifies the growing interest in energy-efficient sensor technologies.
May 2021: Lutron Electronics launched the Vive wireless lighting control system in India. This highlights the increasing demand for wireless solutions in building automation and smart infrastructure.
Strategic Outlook for APAC Wireless Sensors Market Market
The APAC wireless sensors market is poised for significant growth, driven by ongoing technological advancements, expanding industrial automation, and rising investments in smart infrastructure. The increasing adoption of IoT across various industries and the focus on data-driven decision-making will continue to fuel market expansion. Opportunities exist in developing innovative sensor technologies, improving data security, and addressing interoperability challenges to unlock the full potential of the market.
APAC Wireless Sensors Market Segmentation
-
1. Type of Sensor
- 1.1. Pressure
- 1.2. Temperature
- 1.3. Image
- 1.4. Flow
- 1.5. Chemical and Gas
- 1.6. Position and Proximity
- 1.7. Others
-
2. Industry
- 2.1. Automotive
- 2.2. Healthcare
- 2.3. Aerospace and Defense
- 2.4. Energy and Power
- 2.5. Oil and Gas
- 2.6. Food and Beverage
- 2.7. Others
APAC Wireless Sensors Market Segmentation By Geography
-
1. North America
- 1.1. United States
- 1.2. Canada
- 1.3. Mexico
-
2. South America
- 2.1. Brazil
- 2.2. Argentina
- 2.3. Rest of South America
-
3. Europe
- 3.1. United Kingdom
- 3.2. Germany
- 3.3. France
- 3.4. Italy
- 3.5. Spain
- 3.6. Russia
- 3.7. Benelux
- 3.8. Nordics
- 3.9. Rest of Europe
-
4. Middle East & Africa
- 4.1. Turkey
- 4.2. Israel
- 4.3. GCC
- 4.4. North Africa
- 4.5. South Africa
- 4.6. Rest of Middle East & Africa
-
5. Asia Pacific
- 5.1. China
- 5.2. India
- 5.3. Japan
- 5.4. South Korea
- 5.5. ASEAN
- 5.6. Oceania
- 5.7. Rest of Asia Pacific
APAC Wireless Sensors Market REPORT HIGHLIGHTS
| Aspects | Details |
|---|---|
| Study Period | 2019-2033 |
| Base Year | 2024 |
| Estimated Year | 2025 |
| Forecast Period | 2025-2033 |
| Historical Period | 2019-2024 |
| Growth Rate | CAGR of 25.29% from 2019-2033 |
| Segmentation |
|
Table of Contents
- 1. Introduction
- 1.1. Research Scope
- 1.2. Market Segmentation
- 1.3. Research Methodology
- 1.4. Definitions and Assumptions
- 2. Executive Summary
- 2.1. Introduction
- 3. Market Dynamics
- 3.1. Introduction
- 3.2. Market Drivers
- 3.2.1. Increasing Adoption of Wireless Technologies (especially in harsh environments); Emergence of Smart Factory Concepts (Industrial Automation)
- 3.3. Market Restrains
- 3.3.1. Bandwidth Contraints and Compatibility Issues due to Variety of Standards
- 3.4. Market Trends
- 3.4.1. Increasing Adoption of Smart Factories
- 4. Market Factor Analysis
- 4.1. Porters Five Forces
- 4.2. Supply/Value Chain
- 4.3. PESTEL analysis
- 4.4. Market Entropy
- 4.5. Patent/Trademark Analysis
- 5. Global APAC Wireless Sensors Market Analysis, Insights and Forecast, 2019-2031
- 5.1. Market Analysis, Insights and Forecast - by Type of Sensor
- 5.1.1. Pressure
- 5.1.2. Temperature
- 5.1.3. Image
- 5.1.4. Flow
- 5.1.5. Chemical and Gas
- 5.1.6. Position and Proximity
- 5.1.7. Others
- 5.2. Market Analysis, Insights and Forecast - by Industry
- 5.2.1. Automotive
- 5.2.2. Healthcare
- 5.2.3. Aerospace and Defense
- 5.2.4. Energy and Power
- 5.2.5. Oil and Gas
- 5.2.6. Food and Beverage
- 5.2.7. Others
- 5.3. Market Analysis, Insights and Forecast - by Region
- 5.3.1. North America
- 5.3.2. South America
- 5.3.3. Europe
- 5.3.4. Middle East & Africa
- 5.3.5. Asia Pacific
- 5.1. Market Analysis, Insights and Forecast - by Type of Sensor
- 6. North America APAC Wireless Sensors Market Analysis, Insights and Forecast, 2019-2031
- 6.1. Market Analysis, Insights and Forecast - by Type of Sensor
- 6.1.1. Pressure
- 6.1.2. Temperature
- 6.1.3. Image
- 6.1.4. Flow
- 6.1.5. Chemical and Gas
- 6.1.6. Position and Proximity
- 6.1.7. Others
- 6.2. Market Analysis, Insights and Forecast - by Industry
- 6.2.1. Automotive
- 6.2.2. Healthcare
- 6.2.3. Aerospace and Defense
- 6.2.4. Energy and Power
- 6.2.5. Oil and Gas
- 6.2.6. Food and Beverage
- 6.2.7. Others
- 6.1. Market Analysis, Insights and Forecast - by Type of Sensor
- 7. South America APAC Wireless Sensors Market Analysis, Insights and Forecast, 2019-2031
- 7.1. Market Analysis, Insights and Forecast - by Type of Sensor
- 7.1.1. Pressure
- 7.1.2. Temperature
- 7.1.3. Image
- 7.1.4. Flow
- 7.1.5. Chemical and Gas
- 7.1.6. Position and Proximity
- 7.1.7. Others
- 7.2. Market Analysis, Insights and Forecast - by Industry
- 7.2.1. Automotive
- 7.2.2. Healthcare
- 7.2.3. Aerospace and Defense
- 7.2.4. Energy and Power
- 7.2.5. Oil and Gas
- 7.2.6. Food and Beverage
- 7.2.7. Others
- 7.1. Market Analysis, Insights and Forecast - by Type of Sensor
- 8. Europe APAC Wireless Sensors Market Analysis, Insights and Forecast, 2019-2031
- 8.1. Market Analysis, Insights and Forecast - by Type of Sensor
- 8.1.1. Pressure
- 8.1.2. Temperature
- 8.1.3. Image
- 8.1.4. Flow
- 8.1.5. Chemical and Gas
- 8.1.6. Position and Proximity
- 8.1.7. Others
- 8.2. Market Analysis, Insights and Forecast - by Industry
- 8.2.1. Automotive
- 8.2.2. Healthcare
- 8.2.3. Aerospace and Defense
- 8.2.4. Energy and Power
- 8.2.5. Oil and Gas
- 8.2.6. Food and Beverage
- 8.2.7. Others
- 8.1. Market Analysis, Insights and Forecast - by Type of Sensor
- 9. Middle East & Africa APAC Wireless Sensors Market Analysis, Insights and Forecast, 2019-2031
- 9.1. Market Analysis, Insights and Forecast - by Type of Sensor
- 9.1.1. Pressure
- 9.1.2. Temperature
- 9.1.3. Image
- 9.1.4. Flow
- 9.1.5. Chemical and Gas
- 9.1.6. Position and Proximity
- 9.1.7. Others
- 9.2. Market Analysis, Insights and Forecast - by Industry
- 9.2.1. Automotive
- 9.2.2. Healthcare
- 9.2.3. Aerospace and Defense
- 9.2.4. Energy and Power
- 9.2.5. Oil and Gas
- 9.2.6. Food and Beverage
- 9.2.7. Others
- 9.1. Market Analysis, Insights and Forecast - by Type of Sensor
- 10. Asia Pacific APAC Wireless Sensors Market Analysis, Insights and Forecast, 2019-2031
- 10.1. Market Analysis, Insights and Forecast - by Type of Sensor
- 10.1.1. Pressure
- 10.1.2. Temperature
- 10.1.3. Image
- 10.1.4. Flow
- 10.1.5. Chemical and Gas
- 10.1.6. Position and Proximity
- 10.1.7. Others
- 10.2. Market Analysis, Insights and Forecast - by Industry
- 10.2.1. Automotive
- 10.2.2. Healthcare
- 10.2.3. Aerospace and Defense
- 10.2.4. Energy and Power
- 10.2.5. Oil and Gas
- 10.2.6. Food and Beverage
- 10.2.7. Others
- 10.1. Market Analysis, Insights and Forecast - by Type of Sensor
- 11. North America APAC Wireless Sensors Market Analysis, Insights and Forecast, 2019-2031
- 11.1. Market Analysis, Insights and Forecast - By Country/Sub-region
- 11.1.1 US
- 11.1.2 Canada
- 12. Europe APAC Wireless Sensors Market Analysis, Insights and Forecast, 2019-2031
- 12.1. Market Analysis, Insights and Forecast - By Country/Sub-region
- 12.1.1 Germany
- 12.1.2 UK
- 12.1.3 France
- 12.1.4 Rest of Europe
- 13. Asia Pacific APAC Wireless Sensors Market Analysis, Insights and Forecast, 2019-2031
- 13.1. Market Analysis, Insights and Forecast - By Country/Sub-region
- 13.1.1 China
- 13.1.2 Japan
- 13.1.3 India
- 13.1.4 Rest of Asia Pacific
- 14. Rest of the world APAC Wireless Sensors Market Analysis, Insights and Forecast, 2019-2031
- 14.1. Market Analysis, Insights and Forecast - By Country/Sub-region
- 14.1.1.
- 15. Competitive Analysis
- 15.1. Global Market Share Analysis 2024
- 15.2. Company Profiles
- 15.2.1 Honeywell International Inc
- 15.2.1.1. Overview
- 15.2.1.2. Products
- 15.2.1.3. SWOT Analysis
- 15.2.1.4. Recent Developments
- 15.2.1.5. Financials (Based on Availability)
- 15.2.2 ABB Ltd
- 15.2.2.1. Overview
- 15.2.2.2. Products
- 15.2.2.3. SWOT Analysis
- 15.2.2.4. Recent Developments
- 15.2.2.5. Financials (Based on Availability)
- 15.2.3 Schneider Electric SA
- 15.2.3.1. Overview
- 15.2.3.2. Products
- 15.2.3.3. SWOT Analysis
- 15.2.3.4. Recent Developments
- 15.2.3.5. Financials (Based on Availability)
- 15.2.4 Emerson Electric Co
- 15.2.4.1. Overview
- 15.2.4.2. Products
- 15.2.4.3. SWOT Analysis
- 15.2.4.4. Recent Developments
- 15.2.4.5. Financials (Based on Availability)
- 15.2.5 Siemens AG
- 15.2.5.1. Overview
- 15.2.5.2. Products
- 15.2.5.3. SWOT Analysis
- 15.2.5.4. Recent Developments
- 15.2.5.5. Financials (Based on Availability)
- 15.2.6 STMicroelectronics
- 15.2.6.1. Overview
- 15.2.6.2. Products
- 15.2.6.3. SWOT Analysis
- 15.2.6.4. Recent Developments
- 15.2.6.5. Financials (Based on Availability)
- 15.2.7 Texas Instruments Incorporated
- 15.2.7.1. Overview
- 15.2.7.2. Products
- 15.2.7.3. SWOT Analysis
- 15.2.7.4. Recent Developments
- 15.2.7.5. Financials (Based on Availability)
- 15.2.8 Rockwell Automation Inc
- 15.2.8.1. Overview
- 15.2.8.2. Products
- 15.2.8.3. SWOT Analysis
- 15.2.8.4. Recent Developments
- 15.2.8.5. Financials (Based on Availability)
- 15.2.9 Yokogawa Electric Corporation
- 15.2.9.1. Overview
- 15.2.9.2. Products
- 15.2.9.3. SWOT Analysis
- 15.2.9.4. Recent Developments
- 15.2.9.5. Financials (Based on Availability)
- 15.2.10 Endress+Hauser SA
- 15.2.10.1. Overview
- 15.2.10.2. Products
- 15.2.10.3. SWOT Analysis
- 15.2.10.4. Recent Developments
- 15.2.10.5. Financials (Based on Availability)
- 15.2.11 General Electric
- 15.2.11.1. Overview
- 15.2.11.2. Products
- 15.2.11.3. SWOT Analysis
- 15.2.11.4. Recent Developments
- 15.2.11.5. Financials (Based on Availability)
- 15.2.1 Honeywell International Inc
List of Figures
- Figure 1: Global APAC Wireless Sensors Market Revenue Breakdown (Million, %) by Region 2024 & 2032
- Figure 2: Global APAC Wireless Sensors Market Volume Breakdown (K Units, %) by Region 2024 & 2032
- Figure 3: North America APAC Wireless Sensors Market Revenue (Million), by Country 2024 & 2032
- Figure 4: North America APAC Wireless Sensors Market Volume (K Units), by Country 2024 & 2032
- Figure 5: North America APAC Wireless Sensors Market Revenue Share (%), by Country 2024 & 2032
- Figure 6: North America APAC Wireless Sensors Market Volume Share (%), by Country 2024 & 2032
- Figure 7: Europe APAC Wireless Sensors Market Revenue (Million), by Country 2024 & 2032
- Figure 8: Europe APAC Wireless Sensors Market Volume (K Units), by Country 2024 & 2032
- Figure 9: Europe APAC Wireless Sensors Market Revenue Share (%), by Country 2024 & 2032
- Figure 10: Europe APAC Wireless Sensors Market Volume Share (%), by Country 2024 & 2032
- Figure 11: Asia Pacific APAC Wireless Sensors Market Revenue (Million), by Country 2024 & 2032
- Figure 12: Asia Pacific APAC Wireless Sensors Market Volume (K Units), by Country 2024 & 2032
- Figure 13: Asia Pacific APAC Wireless Sensors Market Revenue Share (%), by Country 2024 & 2032
- Figure 14: Asia Pacific APAC Wireless Sensors Market Volume Share (%), by Country 2024 & 2032
- Figure 15: Rest of the world APAC Wireless Sensors Market Revenue (Million), by Country 2024 & 2032
- Figure 16: Rest of the world APAC Wireless Sensors Market Volume (K Units), by Country 2024 & 2032
- Figure 17: Rest of the world APAC Wireless Sensors Market Revenue Share (%), by Country 2024 & 2032
- Figure 18: Rest of the world APAC Wireless Sensors Market Volume Share (%), by Country 2024 & 2032
- Figure 19: North America APAC Wireless Sensors Market Revenue (Million), by Type of Sensor 2024 & 2032
- Figure 20: North America APAC Wireless Sensors Market Volume (K Units), by Type of Sensor 2024 & 2032
- Figure 21: North America APAC Wireless Sensors Market Revenue Share (%), by Type of Sensor 2024 & 2032
- Figure 22: North America APAC Wireless Sensors Market Volume Share (%), by Type of Sensor 2024 & 2032
- Figure 23: North America APAC Wireless Sensors Market Revenue (Million), by Industry 2024 & 2032
- Figure 24: North America APAC Wireless Sensors Market Volume (K Units), by Industry 2024 & 2032
- Figure 25: North America APAC Wireless Sensors Market Revenue Share (%), by Industry 2024 & 2032
- Figure 26: North America APAC Wireless Sensors Market Volume Share (%), by Industry 2024 & 2032
- Figure 27: North America APAC Wireless Sensors Market Revenue (Million), by Country 2024 & 2032
- Figure 28: North America APAC Wireless Sensors Market Volume (K Units), by Country 2024 & 2032
- Figure 29: North America APAC Wireless Sensors Market Revenue Share (%), by Country 2024 & 2032
- Figure 30: North America APAC Wireless Sensors Market Volume Share (%), by Country 2024 & 2032
- Figure 31: South America APAC Wireless Sensors Market Revenue (Million), by Type of Sensor 2024 & 2032
- Figure 32: South America APAC Wireless Sensors Market Volume (K Units), by Type of Sensor 2024 & 2032
- Figure 33: South America APAC Wireless Sensors Market Revenue Share (%), by Type of Sensor 2024 & 2032
- Figure 34: South America APAC Wireless Sensors Market Volume Share (%), by Type of Sensor 2024 & 2032
- Figure 35: South America APAC Wireless Sensors Market Revenue (Million), by Industry 2024 & 2032
- Figure 36: South America APAC Wireless Sensors Market Volume (K Units), by Industry 2024 & 2032
- Figure 37: South America APAC Wireless Sensors Market Revenue Share (%), by Industry 2024 & 2032
- Figure 38: South America APAC Wireless Sensors Market Volume Share (%), by Industry 2024 & 2032
- Figure 39: South America APAC Wireless Sensors Market Revenue (Million), by Country 2024 & 2032
- Figure 40: South America APAC Wireless Sensors Market Volume (K Units), by Country 2024 & 2032
- Figure 41: South America APAC Wireless Sensors Market Revenue Share (%), by Country 2024 & 2032
- Figure 42: South America APAC Wireless Sensors Market Volume Share (%), by Country 2024 & 2032
- Figure 43: Europe APAC Wireless Sensors Market Revenue (Million), by Type of Sensor 2024 & 2032
- Figure 44: Europe APAC Wireless Sensors Market Volume (K Units), by Type of Sensor 2024 & 2032
- Figure 45: Europe APAC Wireless Sensors Market Revenue Share (%), by Type of Sensor 2024 & 2032
- Figure 46: Europe APAC Wireless Sensors Market Volume Share (%), by Type of Sensor 2024 & 2032
- Figure 47: Europe APAC Wireless Sensors Market Revenue (Million), by Industry 2024 & 2032
- Figure 48: Europe APAC Wireless Sensors Market Volume (K Units), by Industry 2024 & 2032
- Figure 49: Europe APAC Wireless Sensors Market Revenue Share (%), by Industry 2024 & 2032
- Figure 50: Europe APAC Wireless Sensors Market Volume Share (%), by Industry 2024 & 2032
- Figure 51: Europe APAC Wireless Sensors Market Revenue (Million), by Country 2024 & 2032
- Figure 52: Europe APAC Wireless Sensors Market Volume (K Units), by Country 2024 & 2032
- Figure 53: Europe APAC Wireless Sensors Market Revenue Share (%), by Country 2024 & 2032
- Figure 54: Europe APAC Wireless Sensors Market Volume Share (%), by Country 2024 & 2032
- Figure 55: Middle East & Africa APAC Wireless Sensors Market Revenue (Million), by Type of Sensor 2024 & 2032
- Figure 56: Middle East & Africa APAC Wireless Sensors Market Volume (K Units), by Type of Sensor 2024 & 2032
- Figure 57: Middle East & Africa APAC Wireless Sensors Market Revenue Share (%), by Type of Sensor 2024 & 2032
- Figure 58: Middle East & Africa APAC Wireless Sensors Market Volume Share (%), by Type of Sensor 2024 & 2032
- Figure 59: Middle East & Africa APAC Wireless Sensors Market Revenue (Million), by Industry 2024 & 2032
- Figure 60: Middle East & Africa APAC Wireless Sensors Market Volume (K Units), by Industry 2024 & 2032
- Figure 61: Middle East & Africa APAC Wireless Sensors Market Revenue Share (%), by Industry 2024 & 2032
- Figure 62: Middle East & Africa APAC Wireless Sensors Market Volume Share (%), by Industry 2024 & 2032
- Figure 63: Middle East & Africa APAC Wireless Sensors Market Revenue (Million), by Country 2024 & 2032
- Figure 64: Middle East & Africa APAC Wireless Sensors Market Volume (K Units), by Country 2024 & 2032
- Figure 65: Middle East & Africa APAC Wireless Sensors Market Revenue Share (%), by Country 2024 & 2032
- Figure 66: Middle East & Africa APAC Wireless Sensors Market Volume Share (%), by Country 2024 & 2032
- Figure 67: Asia Pacific APAC Wireless Sensors Market Revenue (Million), by Type of Sensor 2024 & 2032
- Figure 68: Asia Pacific APAC Wireless Sensors Market Volume (K Units), by Type of Sensor 2024 & 2032
- Figure 69: Asia Pacific APAC Wireless Sensors Market Revenue Share (%), by Type of Sensor 2024 & 2032
- Figure 70: Asia Pacific APAC Wireless Sensors Market Volume Share (%), by Type of Sensor 2024 & 2032
- Figure 71: Asia Pacific APAC Wireless Sensors Market Revenue (Million), by Industry 2024 & 2032
- Figure 72: Asia Pacific APAC Wireless Sensors Market Volume (K Units), by Industry 2024 & 2032
- Figure 73: Asia Pacific APAC Wireless Sensors Market Revenue Share (%), by Industry 2024 & 2032
- Figure 74: Asia Pacific APAC Wireless Sensors Market Volume Share (%), by Industry 2024 & 2032
- Figure 75: Asia Pacific APAC Wireless Sensors Market Revenue (Million), by Country 2024 & 2032
- Figure 76: Asia Pacific APAC Wireless Sensors Market Volume (K Units), by Country 2024 & 2032
- Figure 77: Asia Pacific APAC Wireless Sensors Market Revenue Share (%), by Country 2024 & 2032
- Figure 78: Asia Pacific APAC Wireless Sensors Market Volume Share (%), by Country 2024 & 2032
List of Tables
- Table 1: Global APAC Wireless Sensors Market Revenue Million Forecast, by Region 2019 & 2032
- Table 2: Global APAC Wireless Sensors Market Volume K Units Forecast, by Region 2019 & 2032
- Table 3: Global APAC Wireless Sensors Market Revenue Million Forecast, by Type of Sensor 2019 & 2032
- Table 4: Global APAC Wireless Sensors Market Volume K Units Forecast, by Type of Sensor 2019 & 2032
- Table 5: Global APAC Wireless Sensors Market Revenue Million Forecast, by Industry 2019 & 2032
- Table 6: Global APAC Wireless Sensors Market Volume K Units Forecast, by Industry 2019 & 2032
- Table 7: Global APAC Wireless Sensors Market Revenue Million Forecast, by Region 2019 & 2032
- Table 8: Global APAC Wireless Sensors Market Volume K Units Forecast, by Region 2019 & 2032
- Table 9: Global APAC Wireless Sensors Market Revenue Million Forecast, by Country 2019 & 2032
- Table 10: Global APAC Wireless Sensors Market Volume K Units Forecast, by Country 2019 & 2032
- Table 11: US APAC Wireless Sensors Market Revenue (Million) Forecast, by Application 2019 & 2032
- Table 12: US APAC Wireless Sensors Market Volume (K Units) Forecast, by Application 2019 & 2032
- Table 13: Canada APAC Wireless Sensors Market Revenue (Million) Forecast, by Application 2019 & 2032
- Table 14: Canada APAC Wireless Sensors Market Volume (K Units) Forecast, by Application 2019 & 2032
- Table 15: Global APAC Wireless Sensors Market Revenue Million Forecast, by Country 2019 & 2032
- Table 16: Global APAC Wireless Sensors Market Volume K Units Forecast, by Country 2019 & 2032
- Table 17: Germany APAC Wireless Sensors Market Revenue (Million) Forecast, by Application 2019 & 2032
- Table 18: Germany APAC Wireless Sensors Market Volume (K Units) Forecast, by Application 2019 & 2032
- Table 19: UK APAC Wireless Sensors Market Revenue (Million) Forecast, by Application 2019 & 2032
- Table 20: UK APAC Wireless Sensors Market Volume (K Units) Forecast, by Application 2019 & 2032
- Table 21: France APAC Wireless Sensors Market Revenue (Million) Forecast, by Application 2019 & 2032
- Table 22: France APAC Wireless Sensors Market Volume (K Units) Forecast, by Application 2019 & 2032
- Table 23: Rest of Europe APAC Wireless Sensors Market Revenue (Million) Forecast, by Application 2019 & 2032
- Table 24: Rest of Europe APAC Wireless Sensors Market Volume (K Units) Forecast, by Application 2019 & 2032
- Table 25: Global APAC Wireless Sensors Market Revenue Million Forecast, by Country 2019 & 2032
- Table 26: Global APAC Wireless Sensors Market Volume K Units Forecast, by Country 2019 & 2032
- Table 27: China APAC Wireless Sensors Market Revenue (Million) Forecast, by Application 2019 & 2032
- Table 28: China APAC Wireless Sensors Market Volume (K Units) Forecast, by Application 2019 & 2032
- Table 29: Japan APAC Wireless Sensors Market Revenue (Million) Forecast, by Application 2019 & 2032
- Table 30: Japan APAC Wireless Sensors Market Volume (K Units) Forecast, by Application 2019 & 2032
- Table 31: India APAC Wireless Sensors Market Revenue (Million) Forecast, by Application 2019 & 2032
- Table 32: India APAC Wireless Sensors Market Volume (K Units) Forecast, by Application 2019 & 2032
- Table 33: Rest of Asia Pacific APAC Wireless Sensors Market Revenue (Million) Forecast, by Application 2019 & 2032
- Table 34: Rest of Asia Pacific APAC Wireless Sensors Market Volume (K Units) Forecast, by Application 2019 & 2032
- Table 35: Global APAC Wireless Sensors Market Revenue Million Forecast, by Country 2019 & 2032
- Table 36: Global APAC Wireless Sensors Market Volume K Units Forecast, by Country 2019 & 2032
- Table 37: APAC Wireless Sensors Market Revenue (Million) Forecast, by Application 2019 & 2032
- Table 38: APAC Wireless Sensors Market Volume (K Units) Forecast, by Application 2019 & 2032
- Table 39: Global APAC Wireless Sensors Market Revenue Million Forecast, by Type of Sensor 2019 & 2032
- Table 40: Global APAC Wireless Sensors Market Volume K Units Forecast, by Type of Sensor 2019 & 2032
- Table 41: Global APAC Wireless Sensors Market Revenue Million Forecast, by Industry 2019 & 2032
- Table 42: Global APAC Wireless Sensors Market Volume K Units Forecast, by Industry 2019 & 2032
- Table 43: Global APAC Wireless Sensors Market Revenue Million Forecast, by Country 2019 & 2032
- Table 44: Global APAC Wireless Sensors Market Volume K Units Forecast, by Country 2019 & 2032
- Table 45: United States APAC Wireless Sensors Market Revenue (Million) Forecast, by Application 2019 & 2032
- Table 46: United States APAC Wireless Sensors Market Volume (K Units) Forecast, by Application 2019 & 2032
- Table 47: Canada APAC Wireless Sensors Market Revenue (Million) Forecast, by Application 2019 & 2032
- Table 48: Canada APAC Wireless Sensors Market Volume (K Units) Forecast, by Application 2019 & 2032
- Table 49: Mexico APAC Wireless Sensors Market Revenue (Million) Forecast, by Application 2019 & 2032
- Table 50: Mexico APAC Wireless Sensors Market Volume (K Units) Forecast, by Application 2019 & 2032
- Table 51: Global APAC Wireless Sensors Market Revenue Million Forecast, by Type of Sensor 2019 & 2032
- Table 52: Global APAC Wireless Sensors Market Volume K Units Forecast, by Type of Sensor 2019 & 2032
- Table 53: Global APAC Wireless Sensors Market Revenue Million Forecast, by Industry 2019 & 2032
- Table 54: Global APAC Wireless Sensors Market Volume K Units Forecast, by Industry 2019 & 2032
- Table 55: Global APAC Wireless Sensors Market Revenue Million Forecast, by Country 2019 & 2032
- Table 56: Global APAC Wireless Sensors Market Volume K Units Forecast, by Country 2019 & 2032
- Table 57: Brazil APAC Wireless Sensors Market Revenue (Million) Forecast, by Application 2019 & 2032
- Table 58: Brazil APAC Wireless Sensors Market Volume (K Units) Forecast, by Application 2019 & 2032
- Table 59: Argentina APAC Wireless Sensors Market Revenue (Million) Forecast, by Application 2019 & 2032
- Table 60: Argentina APAC Wireless Sensors Market Volume (K Units) Forecast, by Application 2019 & 2032
- Table 61: Rest of South America APAC Wireless Sensors Market Revenue (Million) Forecast, by Application 2019 & 2032
- Table 62: Rest of South America APAC Wireless Sensors Market Volume (K Units) Forecast, by Application 2019 & 2032
- Table 63: Global APAC Wireless Sensors Market Revenue Million Forecast, by Type of Sensor 2019 & 2032
- Table 64: Global APAC Wireless Sensors Market Volume K Units Forecast, by Type of Sensor 2019 & 2032
- Table 65: Global APAC Wireless Sensors Market Revenue Million Forecast, by Industry 2019 & 2032
- Table 66: Global APAC Wireless Sensors Market Volume K Units Forecast, by Industry 2019 & 2032
- Table 67: Global APAC Wireless Sensors Market Revenue Million Forecast, by Country 2019 & 2032
- Table 68: Global APAC Wireless Sensors Market Volume K Units Forecast, by Country 2019 & 2032
- Table 69: United Kingdom APAC Wireless Sensors Market Revenue (Million) Forecast, by Application 2019 & 2032
- Table 70: United Kingdom APAC Wireless Sensors Market Volume (K Units) Forecast, by Application 2019 & 2032
- Table 71: Germany APAC Wireless Sensors Market Revenue (Million) Forecast, by Application 2019 & 2032
- Table 72: Germany APAC Wireless Sensors Market Volume (K Units) Forecast, by Application 2019 & 2032
- Table 73: France APAC Wireless Sensors Market Revenue (Million) Forecast, by Application 2019 & 2032
- Table 74: France APAC Wireless Sensors Market Volume (K Units) Forecast, by Application 2019 & 2032
- Table 75: Italy APAC Wireless Sensors Market Revenue (Million) Forecast, by Application 2019 & 2032
- Table 76: Italy APAC Wireless Sensors Market Volume (K Units) Forecast, by Application 2019 & 2032
- Table 77: Spain APAC Wireless Sensors Market Revenue (Million) Forecast, by Application 2019 & 2032
- Table 78: Spain APAC Wireless Sensors Market Volume (K Units) Forecast, by Application 2019 & 2032
- Table 79: Russia APAC Wireless Sensors Market Revenue (Million) Forecast, by Application 2019 & 2032
- Table 80: Russia APAC Wireless Sensors Market Volume (K Units) Forecast, by Application 2019 & 2032
- Table 81: Benelux APAC Wireless Sensors Market Revenue (Million) Forecast, by Application 2019 & 2032
- Table 82: Benelux APAC Wireless Sensors Market Volume (K Units) Forecast, by Application 2019 & 2032
- Table 83: Nordics APAC Wireless Sensors Market Revenue (Million) Forecast, by Application 2019 & 2032
- Table 84: Nordics APAC Wireless Sensors Market Volume (K Units) Forecast, by Application 2019 & 2032
- Table 85: Rest of Europe APAC Wireless Sensors Market Revenue (Million) Forecast, by Application 2019 & 2032
- Table 86: Rest of Europe APAC Wireless Sensors Market Volume (K Units) Forecast, by Application 2019 & 2032
- Table 87: Global APAC Wireless Sensors Market Revenue Million Forecast, by Type of Sensor 2019 & 2032
- Table 88: Global APAC Wireless Sensors Market Volume K Units Forecast, by Type of Sensor 2019 & 2032
- Table 89: Global APAC Wireless Sensors Market Revenue Million Forecast, by Industry 2019 & 2032
- Table 90: Global APAC Wireless Sensors Market Volume K Units Forecast, by Industry 2019 & 2032
- Table 91: Global APAC Wireless Sensors Market Revenue Million Forecast, by Country 2019 & 2032
- Table 92: Global APAC Wireless Sensors Market Volume K Units Forecast, by Country 2019 & 2032
- Table 93: Turkey APAC Wireless Sensors Market Revenue (Million) Forecast, by Application 2019 & 2032
- Table 94: Turkey APAC Wireless Sensors Market Volume (K Units) Forecast, by Application 2019 & 2032
- Table 95: Israel APAC Wireless Sensors Market Revenue (Million) Forecast, by Application 2019 & 2032
- Table 96: Israel APAC Wireless Sensors Market Volume (K Units) Forecast, by Application 2019 & 2032
- Table 97: GCC APAC Wireless Sensors Market Revenue (Million) Forecast, by Application 2019 & 2032
- Table 98: GCC APAC Wireless Sensors Market Volume (K Units) Forecast, by Application 2019 & 2032
- Table 99: North Africa APAC Wireless Sensors Market Revenue (Million) Forecast, by Application 2019 & 2032
- Table 100: North Africa APAC Wireless Sensors Market Volume (K Units) Forecast, by Application 2019 & 2032
- Table 101: South Africa APAC Wireless Sensors Market Revenue (Million) Forecast, by Application 2019 & 2032
- Table 102: South Africa APAC Wireless Sensors Market Volume (K Units) Forecast, by Application 2019 & 2032
- Table 103: Rest of Middle East & Africa APAC Wireless Sensors Market Revenue (Million) Forecast, by Application 2019 & 2032
- Table 104: Rest of Middle East & Africa APAC Wireless Sensors Market Volume (K Units) Forecast, by Application 2019 & 2032
- Table 105: Global APAC Wireless Sensors Market Revenue Million Forecast, by Type of Sensor 2019 & 2032
- Table 106: Global APAC Wireless Sensors Market Volume K Units Forecast, by Type of Sensor 2019 & 2032
- Table 107: Global APAC Wireless Sensors Market Revenue Million Forecast, by Industry 2019 & 2032
- Table 108: Global APAC Wireless Sensors Market Volume K Units Forecast, by Industry 2019 & 2032
- Table 109: Global APAC Wireless Sensors Market Revenue Million Forecast, by Country 2019 & 2032
- Table 110: Global APAC Wireless Sensors Market Volume K Units Forecast, by Country 2019 & 2032
- Table 111: China APAC Wireless Sensors Market Revenue (Million) Forecast, by Application 2019 & 2032
- Table 112: China APAC Wireless Sensors Market Volume (K Units) Forecast, by Application 2019 & 2032
- Table 113: India APAC Wireless Sensors Market Revenue (Million) Forecast, by Application 2019 & 2032
- Table 114: India APAC Wireless Sensors Market Volume (K Units) Forecast, by Application 2019 & 2032
- Table 115: Japan APAC Wireless Sensors Market Revenue (Million) Forecast, by Application 2019 & 2032
- Table 116: Japan APAC Wireless Sensors Market Volume (K Units) Forecast, by Application 2019 & 2032
- Table 117: South Korea APAC Wireless Sensors Market Revenue (Million) Forecast, by Application 2019 & 2032
- Table 118: South Korea APAC Wireless Sensors Market Volume (K Units) Forecast, by Application 2019 & 2032
- Table 119: ASEAN APAC Wireless Sensors Market Revenue (Million) Forecast, by Application 2019 & 2032
- Table 120: ASEAN APAC Wireless Sensors Market Volume (K Units) Forecast, by Application 2019 & 2032
- Table 121: Oceania APAC Wireless Sensors Market Revenue (Million) Forecast, by Application 2019 & 2032
- Table 122: Oceania APAC Wireless Sensors Market Volume (K Units) Forecast, by Application 2019 & 2032
- Table 123: Rest of Asia Pacific APAC Wireless Sensors Market Revenue (Million) Forecast, by Application 2019 & 2032
- Table 124: Rest of Asia Pacific APAC Wireless Sensors Market Volume (K Units) Forecast, by Application 2019 & 2032
Frequently Asked Questions
1. What is the projected Compound Annual Growth Rate (CAGR) of the APAC Wireless Sensors Market?
The projected CAGR is approximately 25.29%.
2. Which companies are prominent players in the APAC Wireless Sensors Market?
Key companies in the market include Honeywell International Inc, ABB Ltd, Schneider Electric SA, Emerson Electric Co, Siemens AG, STMicroelectronics, Texas Instruments Incorporated, Rockwell Automation Inc, Yokogawa Electric Corporation, Endress+Hauser SA, General Electric.
3. What are the main segments of the APAC Wireless Sensors Market?
The market segments include Type of Sensor, Industry.
4. Can you provide details about the market size?
The market size is estimated to be USD XX Million as of 2022.
5. What are some drivers contributing to market growth?
Increasing Adoption of Wireless Technologies (especially in harsh environments); Emergence of Smart Factory Concepts (Industrial Automation).
6. What are the notable trends driving market growth?
Increasing Adoption of Smart Factories.
7. Are there any restraints impacting market growth?
Bandwidth Contraints and Compatibility Issues due to Variety of Standards.
8. Can you provide examples of recent developments in the market?
July 2021: SoftBank Group Corp.'s Vision Fund 2 led a USD 200 million investment in Wiliot Inc., a semiconductor company that is developing ways to gather data in manufacturing and logistics using battery-free, stamp-sized sensor tags.
9. What pricing options are available for accessing the report?
Pricing options include single-user, multi-user, and enterprise licenses priced at USD 4750, USD 4950, and USD 6800 respectively.
10. Is the market size provided in terms of value or volume?
The market size is provided in terms of value, measured in Million and volume, measured in K Units.
11. Are there any specific market keywords associated with the report?
Yes, the market keyword associated with the report is "APAC Wireless Sensors Market," which aids in identifying and referencing the specific market segment covered.
12. How do I determine which pricing option suits my needs best?
The pricing options vary based on user requirements and access needs. Individual users may opt for single-user licenses, while businesses requiring broader access may choose multi-user or enterprise licenses for cost-effective access to the report.
13. Are there any additional resources or data provided in the APAC Wireless Sensors Market report?
While the report offers comprehensive insights, it's advisable to review the specific contents or supplementary materials provided to ascertain if additional resources or data are available.
14. How can I stay updated on further developments or reports in the APAC Wireless Sensors Market?
To stay informed about further developments, trends, and reports in the APAC Wireless Sensors Market, consider subscribing to industry newsletters, following relevant companies and organizations, or regularly checking reputable industry news sources and publications.
Methodology
Step 1 - Identification of Relevant Samples Size from Population Database


Step 2 - Approaches for Defining Global Market Size (Value, Volume* & Price*)

Note*: In applicable scenarios
Step 3 - Data Sources
Primary Research
- Web Analytics
- Survey Reports
- Research Institute
- Latest Research Reports
- Opinion Leaders
Secondary Research
- Annual Reports
- White Paper
- Latest Press Release
- Industry Association
- Paid Database
- Investor Presentations

Step 4 - Data Triangulation
Involves using different sources of information in order to increase the validity of a study
These sources are likely to be stakeholders in a program - participants, other researchers, program staff, other community members, and so on.
Then we put all data in single framework & apply various statistical tools to find out the dynamic on the market.
During the analysis stage, feedback from the stakeholder groups would be compared to determine areas of agreement as well as areas of divergence


