
Key Insights
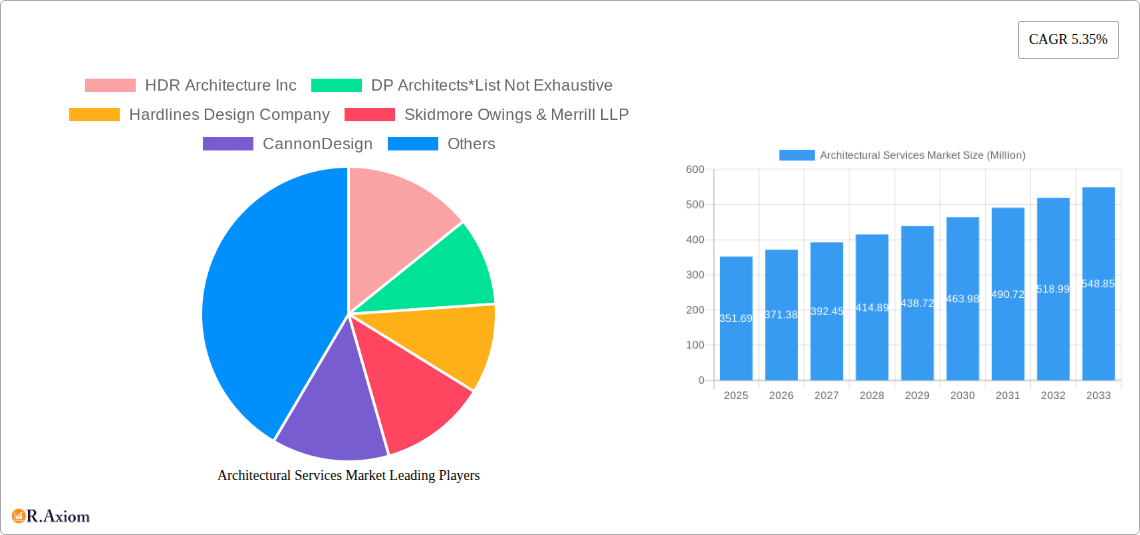
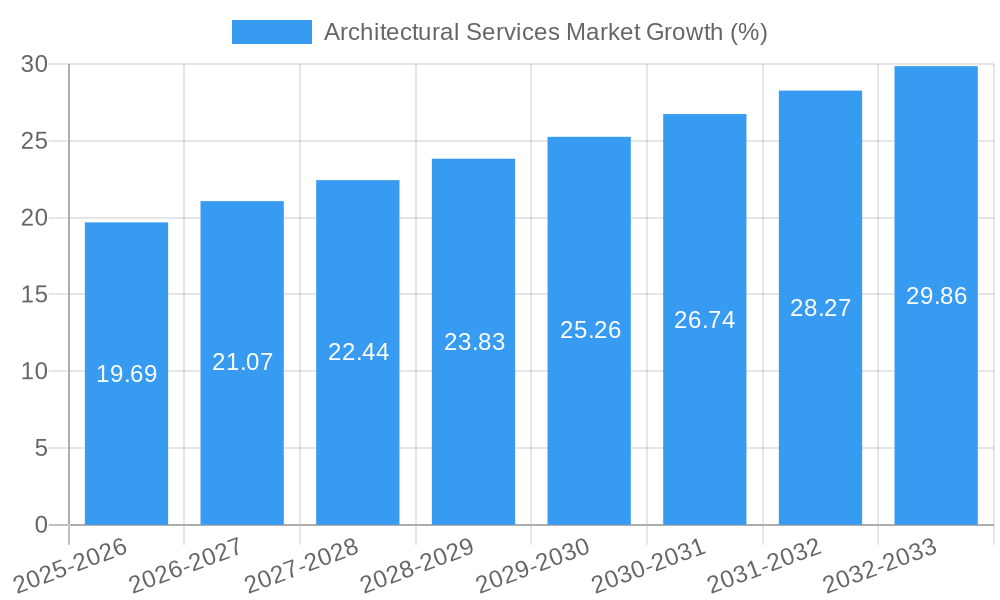
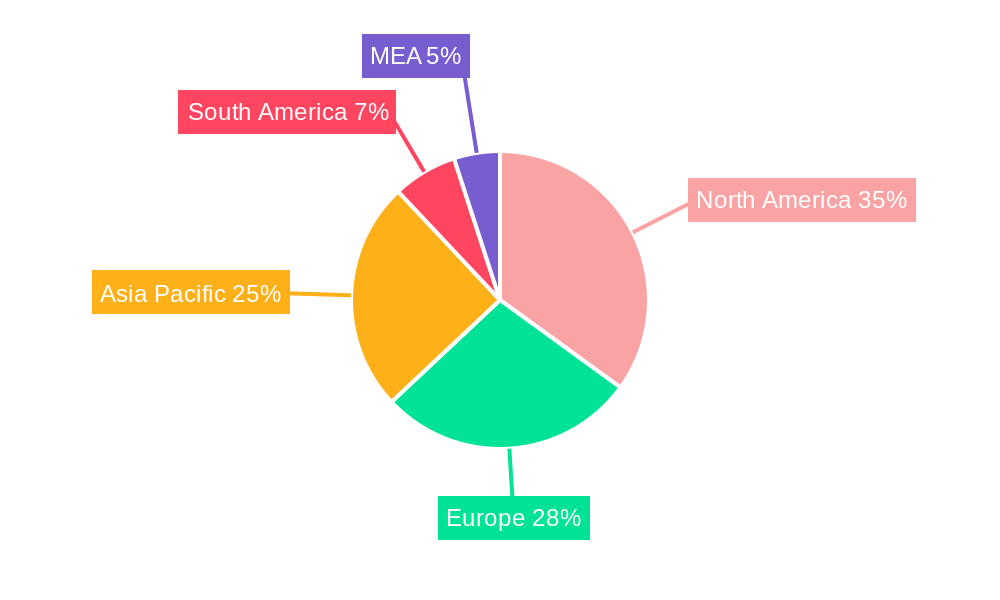
The global Architectural Services market is experiencing robust growth, projected to reach \$351.69 million in 2025 and exhibiting a Compound Annual Growth Rate (CAGR) of 5.35% from 2025 to 2033. This expansion is fueled by several key drivers. Firstly, the increasing demand for sustainable and energy-efficient buildings is driving innovation and investment in architectural design. Secondly, rapid urbanization and population growth, particularly in developing economies, are creating a significant need for new residential, commercial, and infrastructure projects, bolstering demand for architectural services. Furthermore, technological advancements, such as Building Information Modeling (BIM) and other digital design tools, are enhancing efficiency and accuracy in architectural design, leading to increased market adoption. The segment breakdown reveals significant contributions from Residential and Corporate end-users, with Healthcare and Education sectors also showing promising growth. North America and Asia Pacific are anticipated to be leading regional markets, driven by high construction activity and investments in infrastructure development. Competition in the market is intense, with established firms like HDR Architecture, Gensler, and AECOM competing with numerous regional players.
The market's growth trajectory, however, faces certain challenges. Fluctuations in construction material costs, economic downturns, and potential labor shortages can restrain market expansion. Furthermore, increasing regulatory compliance requirements and the need for specialized expertise in sustainable design could pose additional hurdles. Nevertheless, the long-term outlook remains positive, underpinned by ongoing urbanization, technological progress, and a global focus on sustainable development. The market is expected to benefit from rising disposable incomes, particularly in emerging markets, and a growing preference for aesthetically pleasing and functionally efficient buildings across various sectors. The competitive landscape is likely to further consolidate as firms leverage technological advancements and strategic partnerships to expand their market share.
Architectural Services Market: A Comprehensive Report (2019-2033)
This in-depth report provides a comprehensive analysis of the Architectural Services Market, encompassing market size, growth drivers, challenges, opportunities, and key players. The study period covers 2019-2033, with a base year of 2025 and a forecast period of 2025-2033. The report offers actionable insights for industry stakeholders, investors, and businesses operating within this dynamic sector.
Architectural Services Market Market Concentration & Innovation
The Architectural Services Market exhibits a moderately concentrated structure, with a few large multinational firms holding significant market share. However, a large number of smaller, specialized firms also contribute significantly, particularly in niche segments like residential design. The market share of the top five players is estimated at xx%, indicating a competitive landscape. Innovation is driven by technological advancements like Building Information Modeling (BIM), sustainable design practices, and the increasing adoption of Artificial Intelligence (AI) for design optimization and project management. Regulatory frameworks, varying by region, significantly influence market dynamics, impacting building codes, sustainability standards, and licensing requirements. Product substitutes, such as prefabricated building components, pose a growing challenge, but the demand for bespoke architectural design remains strong. End-user trends towards sustainability and smart buildings are reshaping market demands. Mergers and acquisitions (M&A) activity is substantial, with deal values exceeding xx Million in the past five years, reflecting consolidation within the industry and expansion into new markets. Key M&A activities include:
- The recent merger of AE Works and WTW Architects (March 2024), creating one of the largest architectural firms in the Pittsburgh region.
- The combination of Springhouse Architects and Studiyo-b Architects (February 2024), expanding their reach across the greater Cincinnati, Dayton, and Columbus areas.
- Other significant M&A deals (Specific details not available at this time, xx Million total estimated value in 2024).
Architectural Services Market Industry Trends & Insights
The Architectural Services Market is experiencing robust growth, with a projected Compound Annual Growth Rate (CAGR) of xx% during the forecast period (2025-2033). This growth is fueled by several factors, including increasing infrastructure development globally, rising urbanization, and a growing demand for sustainable and energy-efficient buildings. Technological disruptions, particularly the widespread adoption of BIM software and digital design tools, are improving efficiency and collaboration among design professionals. Consumer preferences are shifting towards personalized and sustainable design solutions, prompting architects to incorporate these elements into their projects. Competitive dynamics are shaping the market through innovation, strategic partnerships, and M&A activity. Market penetration of BIM software is steadily increasing, expected to reach xx% by 2033. The market is segmented by end-user, which is analyzed in detail below. The global market size is estimated to reach xx Million by 2033.
Dominant Markets & Segments in Architectural Services Market
The Asia-Pacific region is currently the dominant market for architectural services, driven by rapid economic growth, urbanization, and large-scale infrastructure projects. However, North America and Europe remain substantial markets, with significant potential for growth.
By End-User Segment Dominance:
- Residential: This segment is characterized by high demand for personalized and sustainable home designs. Key drivers include rising disposable incomes, changing lifestyle preferences, and technological advances in home automation.
- Education: Growth is driven by increasing investment in educational infrastructure, along with the need for innovative and environmentally-friendly school designs.
- Healthcare: The demand for specialized healthcare facilities, including hospitals and clinics, is fueling significant growth in this segment. Key drivers include aging populations and advancements in medical technology.
- Corporate: This segment experiences fluctuating growth tied to overall economic conditions and corporate investment in office spaces. Trends towards flexible workspaces and sustainable office designs are influencing demand.
- Other End-Users: This segment encompasses a wide range of projects, including retail spaces, hospitality facilities, and cultural institutions. Growth varies considerably depending on specific project types and economic conditions.
Architectural Services Market Product Developments
Recent product developments in the architectural services market focus on incorporating sustainable design principles, integrating BIM and digital technologies, and utilizing advanced materials for improved energy efficiency. This is fostering a competitive advantage for firms that can effectively leverage these technologies to deliver innovative and cost-effective solutions to clients. The adoption of virtual reality (VR) and augmented reality (AR) technologies for design visualization and client engagement is also gaining traction, increasing client satisfaction and project accuracy.
Report Scope & Segmentation Analysis
This report segments the Architectural Services Market primarily by End-User:
- Residential: The residential segment is projected to grow at a CAGR of xx% from 2025 to 2033, driven by increasing urbanization and demand for customized housing solutions. The market is highly competitive, with both large and small firms vying for projects.
- Education: The education segment is expected to show a CAGR of xx% during the forecast period, fueled by government investments in educational infrastructure improvements. Key players in this segment include firms specializing in school and university designs.
- Healthcare: With a projected CAGR of xx%, this segment shows strong growth driven by the expanding need for modern healthcare facilities. Competition is moderate, with a mix of specialized and generalist architectural firms.
- Corporate: This segment’s growth is projected at xx% CAGR, reflecting the changing needs of businesses regarding office spaces and workplace design. Competition is fierce, with firms specializing in high-rise buildings and large-scale commercial projects.
- Other End-Users: This diverse segment encompasses various project types and is anticipated to grow at a CAGR of xx%, driven by a wide range of factors and highly competitive dynamics.
Key Drivers of Architectural Services Market Growth
Several factors contribute to the growth of the Architectural Services Market:
- Infrastructure Development: Government investments in infrastructure projects worldwide stimulate demand for architectural services.
- Urbanization: Rapid urbanization in developing economies creates a significant need for new residential and commercial buildings.
- Technological Advancements: BIM, AI, and VR/AR technologies enhance design efficiency and client engagement.
- Sustainable Design: Increasing awareness of environmental concerns promotes demand for sustainable building practices.
- Economic Growth: Strong economic growth in key regions boosts investment in construction and real estate.
Challenges in the Architectural Services Market Sector
The Architectural Services Market faces several challenges:
- Economic Fluctuations: Economic downturns can significantly impact demand for architectural services, leading to project delays or cancellations. This has a quantifiable impact; for example, a 10% decrease in GDP may cause a xx% reduction in architectural services demand.
- Regulatory Hurdles: Complex building codes and regulations can increase project costs and timelines.
- Supply Chain Issues: Disruptions in the supply chain can cause material shortages and delays, impacting project timelines and budgets.
- Intense Competition: The industry is highly competitive, with numerous firms vying for projects.
Emerging Opportunities in Architectural Services Market
Emerging trends and opportunities include:
- Smart Buildings: The growing demand for smart and sustainable building designs creates significant opportunities for architectural firms.
- Prefabrication: Increased adoption of prefabricated building components offers potential for faster and more cost-effective construction.
- Green Building Certifications: Firms specializing in LEED or other green building certifications are well-positioned for growth.
- New Markets: Expanding into emerging economies with rapid infrastructure development offers considerable opportunities.
Leading Players in the Architectural Services Market Market
- HDR Architecture Inc
- DP Architects
- Hardlines Design Company
- Skidmore Owings & Merrill LLP
- CannonDesign
- IBI Group
- HKS Inc
- Gensler
- Aedas
- Stantec Inc
- AECOM
- CallisonRTKL
Key Developments in Architectural Services Market Industry
- March 2024: AE Works Ltd acquired WTW Architects, expanding its presence in the Pittsburgh region and strengthening its higher education design capabilities. This consolidation impacts the market by increasing competition and potentially affecting pricing in the Pittsburgh area.
- February 2024: Springhouse Architects merged with Studiyo-b Architects, creating a larger firm serving the Ohio market with a broadened range of services (residential, commercial, multi-family). This merger alters the competitive dynamics within the greater Cincinnati, Dayton, and Columbus areas.
Strategic Outlook for Architectural Services Market Market
The Architectural Services Market is poised for continued growth, driven by technological innovation, increasing urbanization, and a growing demand for sustainable building solutions. Firms that can adapt to these changes, invest in technological advancements, and focus on sustainable practices are best positioned to succeed. Emerging markets present significant opportunities for expansion, while strategic partnerships and M&A activity will continue to shape the industry landscape. The market's future growth is highly dependent on global economic stability and continued investment in infrastructure.
Architectural Services Market Segmentation
-
1. End User
- 1.1. Residential
- 1.2. Education
- 1.3. Healthcare
- 1.4. Corporate
- 1.5. Other End Users
Architectural Services Market Segmentation By Geography
- 1. North America
- 2. Europe
- 3. Asia Pacific
- 4. Latin America
- 5. Middle East and Africa
Architectural Services Market REPORT HIGHLIGHTS
| Aspects | Details |
|---|---|
| Study Period | 2019-2033 |
| Base Year | 2024 |
| Estimated Year | 2025 |
| Forecast Period | 2025-2033 |
| Historical Period | 2019-2024 |
| Growth Rate | CAGR of 5.35% from 2019-2033 |
| Segmentation |
|
Table of Contents
- 1. Introduction
- 1.1. Research Scope
- 1.2. Market Segmentation
- 1.3. Research Methodology
- 1.4. Definitions and Assumptions
- 2. Executive Summary
- 2.1. Introduction
- 3. Market Dynamics
- 3.1. Introduction
- 3.2. Market Drivers
- 3.2.1. Increasing Demand for Green Building; Adoption of 3D Printing
- 3.3. Market Restrains
- 3.3.1. Lack of New Skills and Knowledge in Designing
- 3.4. Market Trends
- 3.4.1. The Residential Segment is Expected to Register Significant Growth
- 4. Market Factor Analysis
- 4.1. Porters Five Forces
- 4.2. Supply/Value Chain
- 4.3. PESTEL analysis
- 4.4. Market Entropy
- 4.5. Patent/Trademark Analysis
- 5. Global Architectural Services Market Analysis, Insights and Forecast, 2019-2031
- 5.1. Market Analysis, Insights and Forecast - by End User
- 5.1.1. Residential
- 5.1.2. Education
- 5.1.3. Healthcare
- 5.1.4. Corporate
- 5.1.5. Other End Users
- 5.2. Market Analysis, Insights and Forecast - by Region
- 5.2.1. North America
- 5.2.2. Europe
- 5.2.3. Asia Pacific
- 5.2.4. Latin America
- 5.2.5. Middle East and Africa
- 5.1. Market Analysis, Insights and Forecast - by End User
- 6. North America Architectural Services Market Analysis, Insights and Forecast, 2019-2031
- 6.1. Market Analysis, Insights and Forecast - by End User
- 6.1.1. Residential
- 6.1.2. Education
- 6.1.3. Healthcare
- 6.1.4. Corporate
- 6.1.5. Other End Users
- 6.1. Market Analysis, Insights and Forecast - by End User
- 7. Europe Architectural Services Market Analysis, Insights and Forecast, 2019-2031
- 7.1. Market Analysis, Insights and Forecast - by End User
- 7.1.1. Residential
- 7.1.2. Education
- 7.1.3. Healthcare
- 7.1.4. Corporate
- 7.1.5. Other End Users
- 7.1. Market Analysis, Insights and Forecast - by End User
- 8. Asia Pacific Architectural Services Market Analysis, Insights and Forecast, 2019-2031
- 8.1. Market Analysis, Insights and Forecast - by End User
- 8.1.1. Residential
- 8.1.2. Education
- 8.1.3. Healthcare
- 8.1.4. Corporate
- 8.1.5. Other End Users
- 8.1. Market Analysis, Insights and Forecast - by End User
- 9. Latin America Architectural Services Market Analysis, Insights and Forecast, 2019-2031
- 9.1. Market Analysis, Insights and Forecast - by End User
- 9.1.1. Residential
- 9.1.2. Education
- 9.1.3. Healthcare
- 9.1.4. Corporate
- 9.1.5. Other End Users
- 9.1. Market Analysis, Insights and Forecast - by End User
- 10. Middle East and Africa Architectural Services Market Analysis, Insights and Forecast, 2019-2031
- 10.1. Market Analysis, Insights and Forecast - by End User
- 10.1.1. Residential
- 10.1.2. Education
- 10.1.3. Healthcare
- 10.1.4. Corporate
- 10.1.5. Other End Users
- 10.1. Market Analysis, Insights and Forecast - by End User
- 11. North America Architectural Services Market Analysis, Insights and Forecast, 2019-2031
- 11.1. Market Analysis, Insights and Forecast - By Country/Sub-region
- 11.1.1 United States
- 11.1.2 Canada
- 11.1.3 Mexico
- 12. Europe Architectural Services Market Analysis, Insights and Forecast, 2019-2031
- 12.1. Market Analysis, Insights and Forecast - By Country/Sub-region
- 12.1.1 Germany
- 12.1.2 United Kingdom
- 12.1.3 France
- 12.1.4 Spain
- 12.1.5 Italy
- 12.1.6 Spain
- 12.1.7 Belgium
- 12.1.8 Netherland
- 12.1.9 Nordics
- 12.1.10 Rest of Europe
- 13. Asia Pacific Architectural Services Market Analysis, Insights and Forecast, 2019-2031
- 13.1. Market Analysis, Insights and Forecast - By Country/Sub-region
- 13.1.1 China
- 13.1.2 Japan
- 13.1.3 India
- 13.1.4 South Korea
- 13.1.5 Southeast Asia
- 13.1.6 Australia
- 13.1.7 Indonesia
- 13.1.8 Phillipes
- 13.1.9 Singapore
- 13.1.10 Thailandc
- 13.1.11 Rest of Asia Pacific
- 14. South America Architectural Services Market Analysis, Insights and Forecast, 2019-2031
- 14.1. Market Analysis, Insights and Forecast - By Country/Sub-region
- 14.1.1 Brazil
- 14.1.2 Argentina
- 14.1.3 Peru
- 14.1.4 Chile
- 14.1.5 Colombia
- 14.1.6 Ecuador
- 14.1.7 Venezuela
- 14.1.8 Rest of South America
- 15. North America Architectural Services Market Analysis, Insights and Forecast, 2019-2031
- 15.1. Market Analysis, Insights and Forecast - By Country/Sub-region
- 15.1.1 United States
- 15.1.2 Canada
- 15.1.3 Mexico
- 16. MEA Architectural Services Market Analysis, Insights and Forecast, 2019-2031
- 16.1. Market Analysis, Insights and Forecast - By Country/Sub-region
- 16.1.1 United Arab Emirates
- 16.1.2 Saudi Arabia
- 16.1.3 South Africa
- 16.1.4 Rest of Middle East and Africa
- 17. Competitive Analysis
- 17.1. Global Market Share Analysis 2024
- 17.2. Company Profiles
- 17.2.1 HDR Architecture Inc
- 17.2.1.1. Overview
- 17.2.1.2. Products
- 17.2.1.3. SWOT Analysis
- 17.2.1.4. Recent Developments
- 17.2.1.5. Financials (Based on Availability)
- 17.2.2 DP Architects*List Not Exhaustive
- 17.2.2.1. Overview
- 17.2.2.2. Products
- 17.2.2.3. SWOT Analysis
- 17.2.2.4. Recent Developments
- 17.2.2.5. Financials (Based on Availability)
- 17.2.3 Hardlines Design Company
- 17.2.3.1. Overview
- 17.2.3.2. Products
- 17.2.3.3. SWOT Analysis
- 17.2.3.4. Recent Developments
- 17.2.3.5. Financials (Based on Availability)
- 17.2.4 Skidmore Owings & Merrill LLP
- 17.2.4.1. Overview
- 17.2.4.2. Products
- 17.2.4.3. SWOT Analysis
- 17.2.4.4. Recent Developments
- 17.2.4.5. Financials (Based on Availability)
- 17.2.5 CannonDesign
- 17.2.5.1. Overview
- 17.2.5.2. Products
- 17.2.5.3. SWOT Analysis
- 17.2.5.4. Recent Developments
- 17.2.5.5. Financials (Based on Availability)
- 17.2.6 IBI Group
- 17.2.6.1. Overview
- 17.2.6.2. Products
- 17.2.6.3. SWOT Analysis
- 17.2.6.4. Recent Developments
- 17.2.6.5. Financials (Based on Availability)
- 17.2.7 HKS Inc
- 17.2.7.1. Overview
- 17.2.7.2. Products
- 17.2.7.3. SWOT Analysis
- 17.2.7.4. Recent Developments
- 17.2.7.5. Financials (Based on Availability)
- 17.2.8 Gensler
- 17.2.8.1. Overview
- 17.2.8.2. Products
- 17.2.8.3. SWOT Analysis
- 17.2.8.4. Recent Developments
- 17.2.8.5. Financials (Based on Availability)
- 17.2.9 Aedas
- 17.2.9.1. Overview
- 17.2.9.2. Products
- 17.2.9.3. SWOT Analysis
- 17.2.9.4. Recent Developments
- 17.2.9.5. Financials (Based on Availability)
- 17.2.10 Stantec Inc
- 17.2.10.1. Overview
- 17.2.10.2. Products
- 17.2.10.3. SWOT Analysis
- 17.2.10.4. Recent Developments
- 17.2.10.5. Financials (Based on Availability)
- 17.2.11 AECOM
- 17.2.11.1. Overview
- 17.2.11.2. Products
- 17.2.11.3. SWOT Analysis
- 17.2.11.4. Recent Developments
- 17.2.11.5. Financials (Based on Availability)
- 17.2.12 CallisonRTKL
- 17.2.12.1. Overview
- 17.2.12.2. Products
- 17.2.12.3. SWOT Analysis
- 17.2.12.4. Recent Developments
- 17.2.12.5. Financials (Based on Availability)
- 17.2.1 HDR Architecture Inc
List of Figures
- Figure 1: Global Architectural Services Market Revenue Breakdown (Million, %) by Region 2024 & 2032
- Figure 2: North America Architectural Services Market Revenue (Million), by Country 2024 & 2032
- Figure 3: North America Architectural Services Market Revenue Share (%), by Country 2024 & 2032
- Figure 4: Europe Architectural Services Market Revenue (Million), by Country 2024 & 2032
- Figure 5: Europe Architectural Services Market Revenue Share (%), by Country 2024 & 2032
- Figure 6: Asia Pacific Architectural Services Market Revenue (Million), by Country 2024 & 2032
- Figure 7: Asia Pacific Architectural Services Market Revenue Share (%), by Country 2024 & 2032
- Figure 8: South America Architectural Services Market Revenue (Million), by Country 2024 & 2032
- Figure 9: South America Architectural Services Market Revenue Share (%), by Country 2024 & 2032
- Figure 10: North America Architectural Services Market Revenue (Million), by Country 2024 & 2032
- Figure 11: North America Architectural Services Market Revenue Share (%), by Country 2024 & 2032
- Figure 12: MEA Architectural Services Market Revenue (Million), by Country 2024 & 2032
- Figure 13: MEA Architectural Services Market Revenue Share (%), by Country 2024 & 2032
- Figure 14: North America Architectural Services Market Revenue (Million), by End User 2024 & 2032
- Figure 15: North America Architectural Services Market Revenue Share (%), by End User 2024 & 2032
- Figure 16: North America Architectural Services Market Revenue (Million), by Country 2024 & 2032
- Figure 17: North America Architectural Services Market Revenue Share (%), by Country 2024 & 2032
- Figure 18: Europe Architectural Services Market Revenue (Million), by End User 2024 & 2032
- Figure 19: Europe Architectural Services Market Revenue Share (%), by End User 2024 & 2032
- Figure 20: Europe Architectural Services Market Revenue (Million), by Country 2024 & 2032
- Figure 21: Europe Architectural Services Market Revenue Share (%), by Country 2024 & 2032
- Figure 22: Asia Pacific Architectural Services Market Revenue (Million), by End User 2024 & 2032
- Figure 23: Asia Pacific Architectural Services Market Revenue Share (%), by End User 2024 & 2032
- Figure 24: Asia Pacific Architectural Services Market Revenue (Million), by Country 2024 & 2032
- Figure 25: Asia Pacific Architectural Services Market Revenue Share (%), by Country 2024 & 2032
- Figure 26: Latin America Architectural Services Market Revenue (Million), by End User 2024 & 2032
- Figure 27: Latin America Architectural Services Market Revenue Share (%), by End User 2024 & 2032
- Figure 28: Latin America Architectural Services Market Revenue (Million), by Country 2024 & 2032
- Figure 29: Latin America Architectural Services Market Revenue Share (%), by Country 2024 & 2032
- Figure 30: Middle East and Africa Architectural Services Market Revenue (Million), by End User 2024 & 2032
- Figure 31: Middle East and Africa Architectural Services Market Revenue Share (%), by End User 2024 & 2032
- Figure 32: Middle East and Africa Architectural Services Market Revenue (Million), by Country 2024 & 2032
- Figure 33: Middle East and Africa Architectural Services Market Revenue Share (%), by Country 2024 & 2032
List of Tables
- Table 1: Global Architectural Services Market Revenue Million Forecast, by Region 2019 & 2032
- Table 2: Global Architectural Services Market Revenue Million Forecast, by End User 2019 & 2032
- Table 3: Global Architectural Services Market Revenue Million Forecast, by Region 2019 & 2032
- Table 4: Global Architectural Services Market Revenue Million Forecast, by Country 2019 & 2032
- Table 5: United States Architectural Services Market Revenue (Million) Forecast, by Application 2019 & 2032
- Table 6: Canada Architectural Services Market Revenue (Million) Forecast, by Application 2019 & 2032
- Table 7: Mexico Architectural Services Market Revenue (Million) Forecast, by Application 2019 & 2032
- Table 8: Global Architectural Services Market Revenue Million Forecast, by Country 2019 & 2032
- Table 9: Germany Architectural Services Market Revenue (Million) Forecast, by Application 2019 & 2032
- Table 10: United Kingdom Architectural Services Market Revenue (Million) Forecast, by Application 2019 & 2032
- Table 11: France Architectural Services Market Revenue (Million) Forecast, by Application 2019 & 2032
- Table 12: Spain Architectural Services Market Revenue (Million) Forecast, by Application 2019 & 2032
- Table 13: Italy Architectural Services Market Revenue (Million) Forecast, by Application 2019 & 2032
- Table 14: Spain Architectural Services Market Revenue (Million) Forecast, by Application 2019 & 2032
- Table 15: Belgium Architectural Services Market Revenue (Million) Forecast, by Application 2019 & 2032
- Table 16: Netherland Architectural Services Market Revenue (Million) Forecast, by Application 2019 & 2032
- Table 17: Nordics Architectural Services Market Revenue (Million) Forecast, by Application 2019 & 2032
- Table 18: Rest of Europe Architectural Services Market Revenue (Million) Forecast, by Application 2019 & 2032
- Table 19: Global Architectural Services Market Revenue Million Forecast, by Country 2019 & 2032
- Table 20: China Architectural Services Market Revenue (Million) Forecast, by Application 2019 & 2032
- Table 21: Japan Architectural Services Market Revenue (Million) Forecast, by Application 2019 & 2032
- Table 22: India Architectural Services Market Revenue (Million) Forecast, by Application 2019 & 2032
- Table 23: South Korea Architectural Services Market Revenue (Million) Forecast, by Application 2019 & 2032
- Table 24: Southeast Asia Architectural Services Market Revenue (Million) Forecast, by Application 2019 & 2032
- Table 25: Australia Architectural Services Market Revenue (Million) Forecast, by Application 2019 & 2032
- Table 26: Indonesia Architectural Services Market Revenue (Million) Forecast, by Application 2019 & 2032
- Table 27: Phillipes Architectural Services Market Revenue (Million) Forecast, by Application 2019 & 2032
- Table 28: Singapore Architectural Services Market Revenue (Million) Forecast, by Application 2019 & 2032
- Table 29: Thailandc Architectural Services Market Revenue (Million) Forecast, by Application 2019 & 2032
- Table 30: Rest of Asia Pacific Architectural Services Market Revenue (Million) Forecast, by Application 2019 & 2032
- Table 31: Global Architectural Services Market Revenue Million Forecast, by Country 2019 & 2032
- Table 32: Brazil Architectural Services Market Revenue (Million) Forecast, by Application 2019 & 2032
- Table 33: Argentina Architectural Services Market Revenue (Million) Forecast, by Application 2019 & 2032
- Table 34: Peru Architectural Services Market Revenue (Million) Forecast, by Application 2019 & 2032
- Table 35: Chile Architectural Services Market Revenue (Million) Forecast, by Application 2019 & 2032
- Table 36: Colombia Architectural Services Market Revenue (Million) Forecast, by Application 2019 & 2032
- Table 37: Ecuador Architectural Services Market Revenue (Million) Forecast, by Application 2019 & 2032
- Table 38: Venezuela Architectural Services Market Revenue (Million) Forecast, by Application 2019 & 2032
- Table 39: Rest of South America Architectural Services Market Revenue (Million) Forecast, by Application 2019 & 2032
- Table 40: Global Architectural Services Market Revenue Million Forecast, by Country 2019 & 2032
- Table 41: United States Architectural Services Market Revenue (Million) Forecast, by Application 2019 & 2032
- Table 42: Canada Architectural Services Market Revenue (Million) Forecast, by Application 2019 & 2032
- Table 43: Mexico Architectural Services Market Revenue (Million) Forecast, by Application 2019 & 2032
- Table 44: Global Architectural Services Market Revenue Million Forecast, by Country 2019 & 2032
- Table 45: United Arab Emirates Architectural Services Market Revenue (Million) Forecast, by Application 2019 & 2032
- Table 46: Saudi Arabia Architectural Services Market Revenue (Million) Forecast, by Application 2019 & 2032
- Table 47: South Africa Architectural Services Market Revenue (Million) Forecast, by Application 2019 & 2032
- Table 48: Rest of Middle East and Africa Architectural Services Market Revenue (Million) Forecast, by Application 2019 & 2032
- Table 49: Global Architectural Services Market Revenue Million Forecast, by End User 2019 & 2032
- Table 50: Global Architectural Services Market Revenue Million Forecast, by Country 2019 & 2032
- Table 51: Global Architectural Services Market Revenue Million Forecast, by End User 2019 & 2032
- Table 52: Global Architectural Services Market Revenue Million Forecast, by Country 2019 & 2032
- Table 53: Global Architectural Services Market Revenue Million Forecast, by End User 2019 & 2032
- Table 54: Global Architectural Services Market Revenue Million Forecast, by Country 2019 & 2032
- Table 55: Global Architectural Services Market Revenue Million Forecast, by End User 2019 & 2032
- Table 56: Global Architectural Services Market Revenue Million Forecast, by Country 2019 & 2032
- Table 57: Global Architectural Services Market Revenue Million Forecast, by End User 2019 & 2032
- Table 58: Global Architectural Services Market Revenue Million Forecast, by Country 2019 & 2032
Frequently Asked Questions
1. What is the projected Compound Annual Growth Rate (CAGR) of the Architectural Services Market?
The projected CAGR is approximately 5.35%.
2. Which companies are prominent players in the Architectural Services Market?
Key companies in the market include HDR Architecture Inc, DP Architects*List Not Exhaustive, Hardlines Design Company, Skidmore Owings & Merrill LLP, CannonDesign, IBI Group, HKS Inc, Gensler, Aedas, Stantec Inc, AECOM, CallisonRTKL.
3. What are the main segments of the Architectural Services Market?
The market segments include End User.
4. Can you provide details about the market size?
The market size is estimated to be USD 351.69 Million as of 2022.
5. What are some drivers contributing to market growth?
Increasing Demand for Green Building; Adoption of 3D Printing.
6. What are the notable trends driving market growth?
The Residential Segment is Expected to Register Significant Growth.
7. Are there any restraints impacting market growth?
Lack of New Skills and Knowledge in Designing.
8. Can you provide examples of recent developments in the market?
March 2024: AE Works Ltd (AE Works), a building design and consulting firm, announced that WTW Architects, a national provider of higher education design with a 65-year legacy of notable Pittsburgh projects, had become part of the company. This move brought together over 100 talented professionals, making it one of the largest architectural firms in the region.
9. What pricing options are available for accessing the report?
Pricing options include single-user, multi-user, and enterprise licenses priced at USD 4750, USD 5250, and USD 8750 respectively.
10. Is the market size provided in terms of value or volume?
The market size is provided in terms of value, measured in Million.
11. Are there any specific market keywords associated with the report?
Yes, the market keyword associated with the report is "Architectural Services Market," which aids in identifying and referencing the specific market segment covered.
12. How do I determine which pricing option suits my needs best?
The pricing options vary based on user requirements and access needs. Individual users may opt for single-user licenses, while businesses requiring broader access may choose multi-user or enterprise licenses for cost-effective access to the report.
13. Are there any additional resources or data provided in the Architectural Services Market report?
While the report offers comprehensive insights, it's advisable to review the specific contents or supplementary materials provided to ascertain if additional resources or data are available.
14. How can I stay updated on further developments or reports in the Architectural Services Market?
To stay informed about further developments, trends, and reports in the Architectural Services Market, consider subscribing to industry newsletters, following relevant companies and organizations, or regularly checking reputable industry news sources and publications.
Methodology
Step 1 - Identification of Relevant Samples Size from Population Database


Step 2 - Approaches for Defining Global Market Size (Value, Volume* & Price*)

Note*: In applicable scenarios
Step 3 - Data Sources
Primary Research
- Web Analytics
- Survey Reports
- Research Institute
- Latest Research Reports
- Opinion Leaders
Secondary Research
- Annual Reports
- White Paper
- Latest Press Release
- Industry Association
- Paid Database
- Investor Presentations

Step 4 - Data Triangulation
Involves using different sources of information in order to increase the validity of a study
These sources are likely to be stakeholders in a program - participants, other researchers, program staff, other community members, and so on.
Then we put all data in single framework & apply various statistical tools to find out the dynamic on the market.
During the analysis stage, feedback from the stakeholder groups would be compared to determine areas of agreement as well as areas of divergence


