
Key Insights
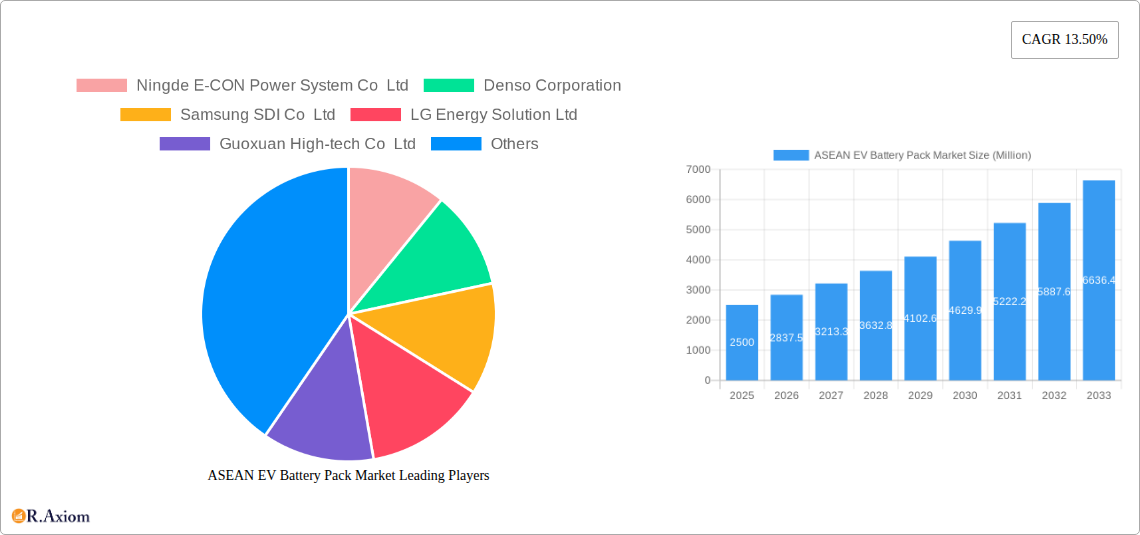
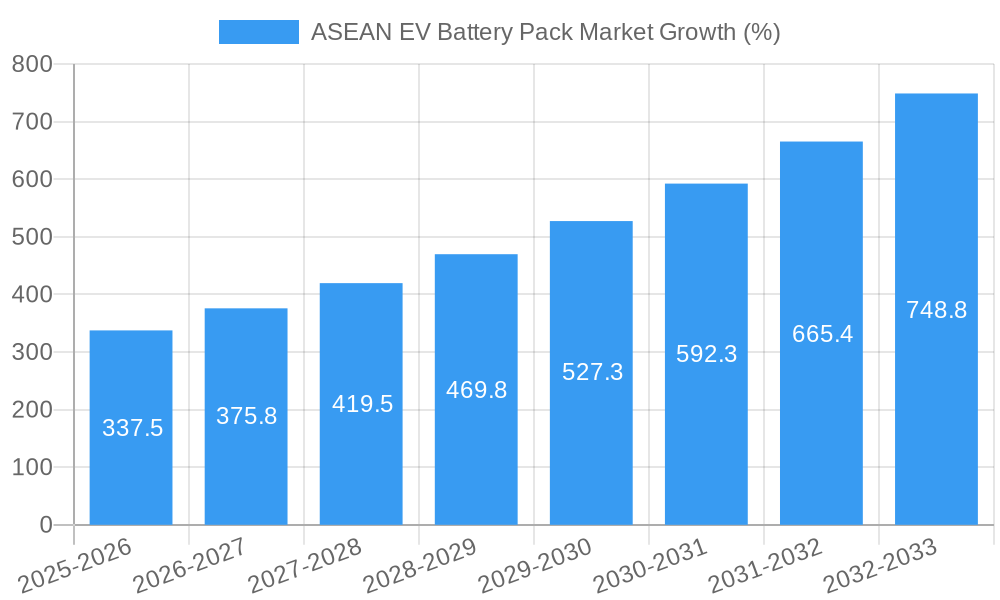
The ASEAN EV battery pack market is experiencing robust growth, driven by increasing electric vehicle (EV) adoption across the region. A 13.50% CAGR from 2019-2033 indicates a significant expansion, fueled by supportive government policies promoting EV infrastructure and incentivizing EV purchases. This growth is further propelled by rising environmental concerns and the decreasing cost of battery technology, making EVs more accessible to a wider consumer base. The market segmentation reveals a diverse landscape, with various battery chemistries (LFP, NCA, NMC, NCM) and form factors (cylindrical, pouch, prismatic) catering to different EV types – from passenger cars and light commercial vehicles (LCVs) to buses and medium & heavy-duty trucks (M&HDTs). The dominant battery capacities are expected to range from 40 kWh to 80 kWh, reflecting the increasing demand for longer-range EVs. Leading players like CATL, LG Energy Solution, and BYD are actively investing in manufacturing capacity and R&D within the ASEAN region to capitalize on this burgeoning market. Challenges include the reliance on imported raw materials, potential supply chain disruptions, and the need for robust recycling infrastructure to address the environmental impact of end-of-life batteries. However, the overall outlook remains positive, with significant growth potential expected throughout the forecast period.
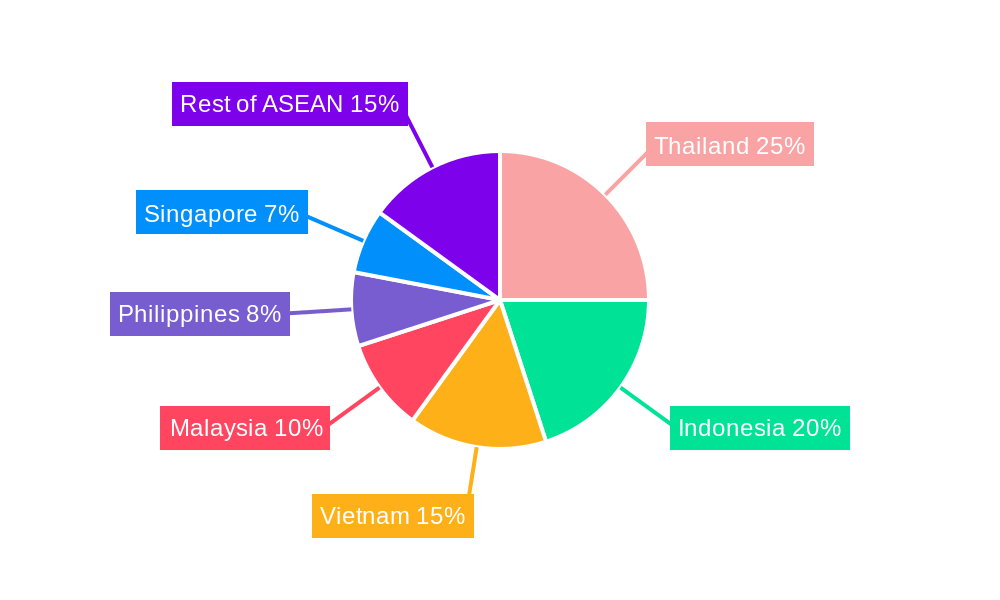
The ASEAN EV battery pack market's diverse segmentations offer both opportunities and challenges. The prevalence of specific battery chemistries and form factors will vary depending on factors such as vehicle type, cost considerations, and energy density requirements. Geographical distribution within ASEAN is likely to be uneven, with countries like Thailand and Indonesia potentially leading the charge due to their established automotive industries and proactive government initiatives. The competitive landscape is fiercely contested, with both established international players and emerging regional companies vying for market share. Future growth will hinge on technological advancements, particularly in battery energy density, charging speeds, and cost reduction, as well as the development of a sustainable battery lifecycle management system within the region. Further investment in research and development, coupled with strong collaboration between governments, manufacturers, and research institutions, will be crucial to fully realize the market's potential.
ASEAN EV Battery Pack Market: A Comprehensive Report (2019-2033)
This in-depth report provides a comprehensive analysis of the ASEAN EV battery pack market, offering invaluable insights for industry stakeholders, investors, and strategic decision-makers. Covering the period from 2019 to 2033, with a focus on 2025, this report delves into market dynamics, segment performance, competitive landscape, and future growth prospects. The study utilizes rigorous data analysis and forecasting methodologies to provide actionable intelligence for navigating this rapidly evolving market.
ASEAN EV Battery Pack Market Market Concentration & Innovation
The ASEAN EV battery pack market is experiencing significant growth, driven by increasing EV adoption and supportive government policies. Market concentration is moderate, with key players like CATL, LG Energy Solution, and BYD holding substantial market share, but a number of regional players are also emerging. Innovation is heavily focused on improving battery energy density, lifespan, and safety, alongside reducing costs. Stringent environmental regulations are pushing manufacturers towards sustainable battery chemistries and recycling initiatives.
- Market Share: CATL holds an estimated xx% market share in 2025, followed by LG Energy Solution with xx% and BYD with xx%. Smaller players collectively account for the remaining xx%.
- M&A Activity: The historical period (2019-2024) witnessed xx M&A deals, with a total value of approximately $xx Million. This activity is expected to accelerate in the forecast period (2025-2033), driven by the need for scale and technological advancements.
- Innovation Drivers: Government incentives, advancements in battery chemistry (e.g., LFP, NMC), and the development of fast-charging technologies are major drivers of innovation.
- Regulatory Frameworks: ASEAN countries are implementing various policies to support EV adoption, including tax breaks, subsidies, and charging infrastructure development. These policies significantly influence market growth and technology adoption.
- Product Substitutes: While there are currently limited direct substitutes for lithium-ion batteries, ongoing research into solid-state and other battery technologies presents potential long-term challenges.
- End-User Trends: The increasing demand for electric buses, passenger cars, and light commercial vehicles (LCVs) is driving growth across various battery pack segments.
ASEAN EV Battery Pack Market Industry Trends & Insights
The ASEAN EV battery pack market is projected to experience robust growth, with a CAGR of xx% during the forecast period (2025-2033). This growth is fueled by several key factors: the rising adoption of electric vehicles across various segments, supportive government policies promoting EV adoption, and decreasing battery costs. Technological advancements, such as improved battery energy density and faster charging capabilities, are further accelerating market expansion. Consumer preferences are shifting towards EVs due to environmental concerns and cost savings in the long run. The competitive landscape is dynamic, with both established global players and regional manufacturers vying for market share. Market penetration of EVs in the ASEAN region is currently at xx% but is anticipated to reach xx% by 2033. The shift toward sustainable transportation solutions and the increasing focus on reducing carbon emissions significantly contribute to this upward trajectory.
Dominant Markets & Segments in ASEAN EV Battery Pack Market
Thailand is currently the leading market in the ASEAN region for EV battery packs, owing to favorable government policies and a robust automotive industry. Within segments, the passenger car segment dominates, accounting for xx% of the total market in 2025. NCM/NMC battery chemistry holds a significant market share due to its high energy density, followed by LFP which offers cost advantages. Lithium is the dominant material type, reflecting its crucial role in lithium-ion battery technology.
- Key Drivers for Thailand's Dominance:
- Supportive government policies and incentives for EV adoption.
- Well-established automotive manufacturing base.
- Growing demand for passenger cars and LCVs.
- Passenger Car Segment Dominance:
- Higher consumer demand compared to other vehicle types.
- Significant investments from automakers in electric passenger car production.
- NCM/NMC Battery Chemistry:
- Superior energy density compared to other chemistries.
- Suitable for high-performance EVs.
- Lithium as the Dominant Material:
- Essential component of lithium-ion batteries.
- Growing investment in lithium mining and processing.
ASEAN EV Battery Pack Market Product Developments
Recent innovations focus on enhancing battery energy density, improving thermal management systems, and extending battery lifespan. New battery chemistries like solid-state and sodium-ion batteries are also emerging as potential disruptors. Manufacturers are also concentrating on developing battery management systems (BMS) for optimal battery performance and safety. These advancements directly impact market competitiveness by improving the overall performance and appeal of EVs, leading to higher adoption rates.
Report Scope & Segmentation Analysis
This report segments the ASEAN EV battery pack market based on body type (Bus, LCV, M&HDT, Passenger Car), battery chemistry (LFP, NCA, NCM, NMC), material type (Cobalt, Lithium, Manganese, Natural Graphite, Nickel, Other Materials), country (Thailand, etc.), propulsion type (BEV, PHEV), capacity (Less than 15 kWh, 15 kWh to 40 kWh, 40 kWh to 80 kWh, Above 80 kWh), battery form (Cylindrical, Pouch, Prismatic), method (Laser, Wire), and component (Anode, Cathode, Electrolyte, Separator). Each segment's growth projections, market size, and competitive dynamics are thoroughly analyzed. The market size for 2025 is estimated at $xx Million, expected to grow to $xx Million by 2033.
Key Drivers of ASEAN EV Battery Pack Market Growth
Several factors are driving the growth of the ASEAN EV battery pack market, including: stringent emission regulations pushing for electric vehicle adoption; government incentives and subsidies encouraging EV purchases; decreasing battery costs making EVs more affordable; increasing consumer awareness of environmental issues; technological advancements improving battery performance and range; and expansion of charging infrastructure supporting wider EV usage.
Challenges in the ASEAN EV Battery Pack Market Sector
Challenges include: the high initial cost of EVs compared to internal combustion engine vehicles; the limited availability of charging infrastructure in certain regions; concerns about battery lifespan and degradation; reliance on critical raw materials with geopolitical risks; and the need for robust battery recycling infrastructure to ensure sustainable practices. These factors collectively impact market expansion and necessitate the development of mitigation strategies.
Emerging Opportunities in ASEAN EV Battery Pack Market
Significant opportunities exist in: developing advanced battery chemistries with higher energy density and longer lifespans; investing in battery recycling and sustainable sourcing of raw materials; expanding charging infrastructure across the ASEAN region; promoting partnerships between automakers and battery manufacturers; and developing innovative battery management systems to enhance battery performance and safety. These emerging trends open avenues for significant growth and innovation in the market.
Leading Players in the ASEAN EV Battery Pack Market Market
- Ningde E-CON Power System Co Ltd
- Denso Corporation
- Samsung SDI Co Ltd
- LG Energy Solution Ltd
- Guoxuan High-tech Co Ltd
- SVOLT Energy Technology Co Ltd (SVOLT)
- Deutsche ACCUmotive GmbH & Co KG
- Contemporary Amperex Technology Co Ltd (CATL)
- BYD Company Ltd
- SK Innovation Co Ltd
- Do-Fluoride (Jiaozuo) New Energy Technology
- Panasonic Holdings Corporation
Key Developments in ASEAN EV Battery Pack Market Industry
- March 2023: Contemporary Amperex Technology Co., Ltd. (CATL) established a joint venture (JV) named Jiefang Shidai New Energy Technology Co., Ltd. with FAW Jiefang Automotive Co., Ltd. (FAW Jiefang).
- March 2023: CATL signed a strategic cooperation agreement with Beijing Automotive Group Co., Ltd. (BAIC Group).
- April 2023: CATL announced the launch of its sodium-ion battery in Chery models and the joint creation of the ENER-Q battery brand. These developments demonstrate the ongoing strategic partnerships and technological innovations shaping the market.
Strategic Outlook for ASEAN EV Battery Pack Market Market
The ASEAN EV battery pack market is poised for substantial growth, driven by favorable government policies, increasing EV adoption, and continuous technological advancements. The focus on sustainable energy solutions and the decreasing cost of batteries will further propel market expansion. Companies that can leverage strategic partnerships, invest in innovation, and address supply chain challenges effectively are well-positioned to capture significant market share in the years to come.
ASEAN EV Battery Pack Market Segmentation
-
1. Body Type
- 1.1. Bus
- 1.2. LCV
- 1.3. M&HDT
- 1.4. Passenger Car
-
2. Propulsion Type
- 2.1. BEV
- 2.2. PHEV
-
3. Battery Chemistry
- 3.1. LFP
- 3.2. NCA
- 3.3. NCM
- 3.4. NMC
-
4. Capacity
- 4.1. 15 kWh to 40 kWh
- 4.2. 40 kWh to 80 kWh
- 4.3. Above 80 kWh
- 4.4. Less than 15 kWh
-
5. Battery Form
- 5.1. Cylindrical
- 5.2. Pouch
- 5.3. Prismatic
-
6. Method
- 6.1. Laser
- 6.2. Wire
-
7. Component
- 7.1. Anode
- 7.2. Cathode
- 7.3. Electrolyte
- 7.4. Separator
-
8. Material Type
- 8.1. Cobalt
- 8.2. Lithium
- 8.3. Manganese
- 8.4. Natural Graphite
- 8.5. Nickel
- 8.6. Other Materials
ASEAN EV Battery Pack Market Segmentation By Geography
-
1. North America
- 1.1. United States
- 1.2. Canada
- 1.3. Mexico
-
2. South America
- 2.1. Brazil
- 2.2. Argentina
- 2.3. Rest of South America
-
3. Europe
- 3.1. United Kingdom
- 3.2. Germany
- 3.3. France
- 3.4. Italy
- 3.5. Spain
- 3.6. Russia
- 3.7. Benelux
- 3.8. Nordics
- 3.9. Rest of Europe
-
4. Middle East & Africa
- 4.1. Turkey
- 4.2. Israel
- 4.3. GCC
- 4.4. North Africa
- 4.5. South Africa
- 4.6. Rest of Middle East & Africa
-
5. Asia Pacific
- 5.1. China
- 5.2. India
- 5.3. Japan
- 5.4. South Korea
- 5.5. ASEAN
- 5.6. Oceania
- 5.7. Rest of Asia Pacific
ASEAN EV Battery Pack Market REPORT HIGHLIGHTS
| Aspects | Details |
|---|---|
| Study Period | 2019-2033 |
| Base Year | 2024 |
| Estimated Year | 2025 |
| Forecast Period | 2025-2033 |
| Historical Period | 2019-2024 |
| Growth Rate | CAGR of 13.50% from 2019-2033 |
| Segmentation |
|
Table of Contents
- 1. Introduction
- 1.1. Research Scope
- 1.2. Market Segmentation
- 1.3. Research Methodology
- 1.4. Definitions and Assumptions
- 2. Executive Summary
- 2.1. Introduction
- 3. Market Dynamics
- 3.1. Introduction
- 3.2. Market Drivers
- 3.2.1. Governments worldwide are implementing strict regulations and providing incentives to promote the adoption of electric vehicles; Others
- 3.3. Market Restrains
- 3.3.1. High Initial Costs; Others
- 3.4. Market Trends
- 3.4.1. OTHER KEY INDUSTRY TRENDS COVERED IN THE REPORT
- 4. Market Factor Analysis
- 4.1. Porters Five Forces
- 4.2. Supply/Value Chain
- 4.3. PESTEL analysis
- 4.4. Market Entropy
- 4.5. Patent/Trademark Analysis
- 5. Global ASEAN EV Battery Pack Market Analysis, Insights and Forecast, 2019-2031
- 5.1. Market Analysis, Insights and Forecast - by Body Type
- 5.1.1. Bus
- 5.1.2. LCV
- 5.1.3. M&HDT
- 5.1.4. Passenger Car
- 5.2. Market Analysis, Insights and Forecast - by Propulsion Type
- 5.2.1. BEV
- 5.2.2. PHEV
- 5.3. Market Analysis, Insights and Forecast - by Battery Chemistry
- 5.3.1. LFP
- 5.3.2. NCA
- 5.3.3. NCM
- 5.3.4. NMC
- 5.4. Market Analysis, Insights and Forecast - by Capacity
- 5.4.1. 15 kWh to 40 kWh
- 5.4.2. 40 kWh to 80 kWh
- 5.4.3. Above 80 kWh
- 5.4.4. Less than 15 kWh
- 5.5. Market Analysis, Insights and Forecast - by Battery Form
- 5.5.1. Cylindrical
- 5.5.2. Pouch
- 5.5.3. Prismatic
- 5.6. Market Analysis, Insights and Forecast - by Method
- 5.6.1. Laser
- 5.6.2. Wire
- 5.7. Market Analysis, Insights and Forecast - by Component
- 5.7.1. Anode
- 5.7.2. Cathode
- 5.7.3. Electrolyte
- 5.7.4. Separator
- 5.8. Market Analysis, Insights and Forecast - by Material Type
- 5.8.1. Cobalt
- 5.8.2. Lithium
- 5.8.3. Manganese
- 5.8.4. Natural Graphite
- 5.8.5. Nickel
- 5.8.6. Other Materials
- 5.9. Market Analysis, Insights and Forecast - by Region
- 5.9.1. North America
- 5.9.2. South America
- 5.9.3. Europe
- 5.9.4. Middle East & Africa
- 5.9.5. Asia Pacific
- 5.1. Market Analysis, Insights and Forecast - by Body Type
- 6. North America ASEAN EV Battery Pack Market Analysis, Insights and Forecast, 2019-2031
- 6.1. Market Analysis, Insights and Forecast - by Body Type
- 6.1.1. Bus
- 6.1.2. LCV
- 6.1.3. M&HDT
- 6.1.4. Passenger Car
- 6.2. Market Analysis, Insights and Forecast - by Propulsion Type
- 6.2.1. BEV
- 6.2.2. PHEV
- 6.3. Market Analysis, Insights and Forecast - by Battery Chemistry
- 6.3.1. LFP
- 6.3.2. NCA
- 6.3.3. NCM
- 6.3.4. NMC
- 6.4. Market Analysis, Insights and Forecast - by Capacity
- 6.4.1. 15 kWh to 40 kWh
- 6.4.2. 40 kWh to 80 kWh
- 6.4.3. Above 80 kWh
- 6.4.4. Less than 15 kWh
- 6.5. Market Analysis, Insights and Forecast - by Battery Form
- 6.5.1. Cylindrical
- 6.5.2. Pouch
- 6.5.3. Prismatic
- 6.6. Market Analysis, Insights and Forecast - by Method
- 6.6.1. Laser
- 6.6.2. Wire
- 6.7. Market Analysis, Insights and Forecast - by Component
- 6.7.1. Anode
- 6.7.2. Cathode
- 6.7.3. Electrolyte
- 6.7.4. Separator
- 6.8. Market Analysis, Insights and Forecast - by Material Type
- 6.8.1. Cobalt
- 6.8.2. Lithium
- 6.8.3. Manganese
- 6.8.4. Natural Graphite
- 6.8.5. Nickel
- 6.8.6. Other Materials
- 6.1. Market Analysis, Insights and Forecast - by Body Type
- 7. South America ASEAN EV Battery Pack Market Analysis, Insights and Forecast, 2019-2031
- 7.1. Market Analysis, Insights and Forecast - by Body Type
- 7.1.1. Bus
- 7.1.2. LCV
- 7.1.3. M&HDT
- 7.1.4. Passenger Car
- 7.2. Market Analysis, Insights and Forecast - by Propulsion Type
- 7.2.1. BEV
- 7.2.2. PHEV
- 7.3. Market Analysis, Insights and Forecast - by Battery Chemistry
- 7.3.1. LFP
- 7.3.2. NCA
- 7.3.3. NCM
- 7.3.4. NMC
- 7.4. Market Analysis, Insights and Forecast - by Capacity
- 7.4.1. 15 kWh to 40 kWh
- 7.4.2. 40 kWh to 80 kWh
- 7.4.3. Above 80 kWh
- 7.4.4. Less than 15 kWh
- 7.5. Market Analysis, Insights and Forecast - by Battery Form
- 7.5.1. Cylindrical
- 7.5.2. Pouch
- 7.5.3. Prismatic
- 7.6. Market Analysis, Insights and Forecast - by Method
- 7.6.1. Laser
- 7.6.2. Wire
- 7.7. Market Analysis, Insights and Forecast - by Component
- 7.7.1. Anode
- 7.7.2. Cathode
- 7.7.3. Electrolyte
- 7.7.4. Separator
- 7.8. Market Analysis, Insights and Forecast - by Material Type
- 7.8.1. Cobalt
- 7.8.2. Lithium
- 7.8.3. Manganese
- 7.8.4. Natural Graphite
- 7.8.5. Nickel
- 7.8.6. Other Materials
- 7.1. Market Analysis, Insights and Forecast - by Body Type
- 8. Europe ASEAN EV Battery Pack Market Analysis, Insights and Forecast, 2019-2031
- 8.1. Market Analysis, Insights and Forecast - by Body Type
- 8.1.1. Bus
- 8.1.2. LCV
- 8.1.3. M&HDT
- 8.1.4. Passenger Car
- 8.2. Market Analysis, Insights and Forecast - by Propulsion Type
- 8.2.1. BEV
- 8.2.2. PHEV
- 8.3. Market Analysis, Insights and Forecast - by Battery Chemistry
- 8.3.1. LFP
- 8.3.2. NCA
- 8.3.3. NCM
- 8.3.4. NMC
- 8.4. Market Analysis, Insights and Forecast - by Capacity
- 8.4.1. 15 kWh to 40 kWh
- 8.4.2. 40 kWh to 80 kWh
- 8.4.3. Above 80 kWh
- 8.4.4. Less than 15 kWh
- 8.5. Market Analysis, Insights and Forecast - by Battery Form
- 8.5.1. Cylindrical
- 8.5.2. Pouch
- 8.5.3. Prismatic
- 8.6. Market Analysis, Insights and Forecast - by Method
- 8.6.1. Laser
- 8.6.2. Wire
- 8.7. Market Analysis, Insights and Forecast - by Component
- 8.7.1. Anode
- 8.7.2. Cathode
- 8.7.3. Electrolyte
- 8.7.4. Separator
- 8.8. Market Analysis, Insights and Forecast - by Material Type
- 8.8.1. Cobalt
- 8.8.2. Lithium
- 8.8.3. Manganese
- 8.8.4. Natural Graphite
- 8.8.5. Nickel
- 8.8.6. Other Materials
- 8.1. Market Analysis, Insights and Forecast - by Body Type
- 9. Middle East & Africa ASEAN EV Battery Pack Market Analysis, Insights and Forecast, 2019-2031
- 9.1. Market Analysis, Insights and Forecast - by Body Type
- 9.1.1. Bus
- 9.1.2. LCV
- 9.1.3. M&HDT
- 9.1.4. Passenger Car
- 9.2. Market Analysis, Insights and Forecast - by Propulsion Type
- 9.2.1. BEV
- 9.2.2. PHEV
- 9.3. Market Analysis, Insights and Forecast - by Battery Chemistry
- 9.3.1. LFP
- 9.3.2. NCA
- 9.3.3. NCM
- 9.3.4. NMC
- 9.4. Market Analysis, Insights and Forecast - by Capacity
- 9.4.1. 15 kWh to 40 kWh
- 9.4.2. 40 kWh to 80 kWh
- 9.4.3. Above 80 kWh
- 9.4.4. Less than 15 kWh
- 9.5. Market Analysis, Insights and Forecast - by Battery Form
- 9.5.1. Cylindrical
- 9.5.2. Pouch
- 9.5.3. Prismatic
- 9.6. Market Analysis, Insights and Forecast - by Method
- 9.6.1. Laser
- 9.6.2. Wire
- 9.7. Market Analysis, Insights and Forecast - by Component
- 9.7.1. Anode
- 9.7.2. Cathode
- 9.7.3. Electrolyte
- 9.7.4. Separator
- 9.8. Market Analysis, Insights and Forecast - by Material Type
- 9.8.1. Cobalt
- 9.8.2. Lithium
- 9.8.3. Manganese
- 9.8.4. Natural Graphite
- 9.8.5. Nickel
- 9.8.6. Other Materials
- 9.1. Market Analysis, Insights and Forecast - by Body Type
- 10. Asia Pacific ASEAN EV Battery Pack Market Analysis, Insights and Forecast, 2019-2031
- 10.1. Market Analysis, Insights and Forecast - by Body Type
- 10.1.1. Bus
- 10.1.2. LCV
- 10.1.3. M&HDT
- 10.1.4. Passenger Car
- 10.2. Market Analysis, Insights and Forecast - by Propulsion Type
- 10.2.1. BEV
- 10.2.2. PHEV
- 10.3. Market Analysis, Insights and Forecast - by Battery Chemistry
- 10.3.1. LFP
- 10.3.2. NCA
- 10.3.3. NCM
- 10.3.4. NMC
- 10.4. Market Analysis, Insights and Forecast - by Capacity
- 10.4.1. 15 kWh to 40 kWh
- 10.4.2. 40 kWh to 80 kWh
- 10.4.3. Above 80 kWh
- 10.4.4. Less than 15 kWh
- 10.5. Market Analysis, Insights and Forecast - by Battery Form
- 10.5.1. Cylindrical
- 10.5.2. Pouch
- 10.5.3. Prismatic
- 10.6. Market Analysis, Insights and Forecast - by Method
- 10.6.1. Laser
- 10.6.2. Wire
- 10.7. Market Analysis, Insights and Forecast - by Component
- 10.7.1. Anode
- 10.7.2. Cathode
- 10.7.3. Electrolyte
- 10.7.4. Separator
- 10.8. Market Analysis, Insights and Forecast - by Material Type
- 10.8.1. Cobalt
- 10.8.2. Lithium
- 10.8.3. Manganese
- 10.8.4. Natural Graphite
- 10.8.5. Nickel
- 10.8.6. Other Materials
- 10.1. Market Analysis, Insights and Forecast - by Body Type
- 11. North America ASEAN EV Battery Pack Market Analysis, Insights and Forecast, 2019-2031
- 11.1. Market Analysis, Insights and Forecast - By Country/Sub-region
- 11.1.1 United States
- 11.1.2 Canada
- 11.1.3 Mexico
- 11.1.4 Rest of North America
- 12. Europe ASEAN EV Battery Pack Market Analysis, Insights and Forecast, 2019-2031
- 12.1. Market Analysis, Insights and Forecast - By Country/Sub-region
- 12.1.1 Germany
- 12.1.2 United Kingdom
- 12.1.3 France
- 12.1.4 Italy
- 12.1.5 Rest of Europe
- 13. Asia Pacific ASEAN EV Battery Pack Market Analysis, Insights and Forecast, 2019-2031
- 13.1. Market Analysis, Insights and Forecast - By Country/Sub-region
- 13.1.1 China
- 13.1.2 Japan
- 13.1.3 India
- 13.1.4 Australia
- 13.1.5 Rest of Asia Pacific
- 14. South America ASEAN EV Battery Pack Market Analysis, Insights and Forecast, 2019-2031
- 14.1. Market Analysis, Insights and Forecast - By Country/Sub-region
- 14.1.1 Brazil
- 14.1.2 Argentina
- 14.1.3 Rest of South America
- 15. Middle East and Africa ASEAN EV Battery Pack Market Analysis, Insights and Forecast, 2019-2031
- 15.1. Market Analysis, Insights and Forecast - By Country/Sub-region
- 15.1.1 United Arab Emirates
- 15.1.2 Saudi Arabia
- 15.1.3 Rest of Middle East and Africa
- 16. Competitive Analysis
- 16.1. Global Market Share Analysis 2024
- 16.2. Company Profiles
- 16.2.1 Ningde E-CON Power System Co Ltd
- 16.2.1.1. Overview
- 16.2.1.2. Products
- 16.2.1.3. SWOT Analysis
- 16.2.1.4. Recent Developments
- 16.2.1.5. Financials (Based on Availability)
- 16.2.2 Denso Corporation
- 16.2.2.1. Overview
- 16.2.2.2. Products
- 16.2.2.3. SWOT Analysis
- 16.2.2.4. Recent Developments
- 16.2.2.5. Financials (Based on Availability)
- 16.2.3 Samsung SDI Co Ltd
- 16.2.3.1. Overview
- 16.2.3.2. Products
- 16.2.3.3. SWOT Analysis
- 16.2.3.4. Recent Developments
- 16.2.3.5. Financials (Based on Availability)
- 16.2.4 LG Energy Solution Ltd
- 16.2.4.1. Overview
- 16.2.4.2. Products
- 16.2.4.3. SWOT Analysis
- 16.2.4.4. Recent Developments
- 16.2.4.5. Financials (Based on Availability)
- 16.2.5 Guoxuan High-tech Co Ltd
- 16.2.5.1. Overview
- 16.2.5.2. Products
- 16.2.5.3. SWOT Analysis
- 16.2.5.4. Recent Developments
- 16.2.5.5. Financials (Based on Availability)
- 16.2.6 SVOLT Energy Technology Co Ltd (SVOLT
- 16.2.6.1. Overview
- 16.2.6.2. Products
- 16.2.6.3. SWOT Analysis
- 16.2.6.4. Recent Developments
- 16.2.6.5. Financials (Based on Availability)
- 16.2.7 Deutsche ACCUmotive GmbH & Co KG
- 16.2.7.1. Overview
- 16.2.7.2. Products
- 16.2.7.3. SWOT Analysis
- 16.2.7.4. Recent Developments
- 16.2.7.5. Financials (Based on Availability)
- 16.2.8 Contemporary Amperex Technology Co Ltd (CATL)
- 16.2.8.1. Overview
- 16.2.8.2. Products
- 16.2.8.3. SWOT Analysis
- 16.2.8.4. Recent Developments
- 16.2.8.5. Financials (Based on Availability)
- 16.2.9 BYD Company Ltd
- 16.2.9.1. Overview
- 16.2.9.2. Products
- 16.2.9.3. SWOT Analysis
- 16.2.9.4. Recent Developments
- 16.2.9.5. Financials (Based on Availability)
- 16.2.10 SK Innovation Co Ltd
- 16.2.10.1. Overview
- 16.2.10.2. Products
- 16.2.10.3. SWOT Analysis
- 16.2.10.4. Recent Developments
- 16.2.10.5. Financials (Based on Availability)
- 16.2.11 Do-Fluoride (Jiaozuo) New Energy Technology
- 16.2.11.1. Overview
- 16.2.11.2. Products
- 16.2.11.3. SWOT Analysis
- 16.2.11.4. Recent Developments
- 16.2.11.5. Financials (Based on Availability)
- 16.2.12 Panasonic Holdings Corporation
- 16.2.12.1. Overview
- 16.2.12.2. Products
- 16.2.12.3. SWOT Analysis
- 16.2.12.4. Recent Developments
- 16.2.12.5. Financials (Based on Availability)
- 16.2.1 Ningde E-CON Power System Co Ltd
List of Figures
- Figure 1: Global ASEAN EV Battery Pack Market Revenue Breakdown (Million, %) by Region 2024 & 2032
- Figure 2: North America ASEAN EV Battery Pack Market Revenue (Million), by Country 2024 & 2032
- Figure 3: North America ASEAN EV Battery Pack Market Revenue Share (%), by Country 2024 & 2032
- Figure 4: Europe ASEAN EV Battery Pack Market Revenue (Million), by Country 2024 & 2032
- Figure 5: Europe ASEAN EV Battery Pack Market Revenue Share (%), by Country 2024 & 2032
- Figure 6: Asia Pacific ASEAN EV Battery Pack Market Revenue (Million), by Country 2024 & 2032
- Figure 7: Asia Pacific ASEAN EV Battery Pack Market Revenue Share (%), by Country 2024 & 2032
- Figure 8: South America ASEAN EV Battery Pack Market Revenue (Million), by Country 2024 & 2032
- Figure 9: South America ASEAN EV Battery Pack Market Revenue Share (%), by Country 2024 & 2032
- Figure 10: Middle East and Africa ASEAN EV Battery Pack Market Revenue (Million), by Country 2024 & 2032
- Figure 11: Middle East and Africa ASEAN EV Battery Pack Market Revenue Share (%), by Country 2024 & 2032
- Figure 12: North America ASEAN EV Battery Pack Market Revenue (Million), by Body Type 2024 & 2032
- Figure 13: North America ASEAN EV Battery Pack Market Revenue Share (%), by Body Type 2024 & 2032
- Figure 14: North America ASEAN EV Battery Pack Market Revenue (Million), by Propulsion Type 2024 & 2032
- Figure 15: North America ASEAN EV Battery Pack Market Revenue Share (%), by Propulsion Type 2024 & 2032
- Figure 16: North America ASEAN EV Battery Pack Market Revenue (Million), by Battery Chemistry 2024 & 2032
- Figure 17: North America ASEAN EV Battery Pack Market Revenue Share (%), by Battery Chemistry 2024 & 2032
- Figure 18: North America ASEAN EV Battery Pack Market Revenue (Million), by Capacity 2024 & 2032
- Figure 19: North America ASEAN EV Battery Pack Market Revenue Share (%), by Capacity 2024 & 2032
- Figure 20: North America ASEAN EV Battery Pack Market Revenue (Million), by Battery Form 2024 & 2032
- Figure 21: North America ASEAN EV Battery Pack Market Revenue Share (%), by Battery Form 2024 & 2032
- Figure 22: North America ASEAN EV Battery Pack Market Revenue (Million), by Method 2024 & 2032
- Figure 23: North America ASEAN EV Battery Pack Market Revenue Share (%), by Method 2024 & 2032
- Figure 24: North America ASEAN EV Battery Pack Market Revenue (Million), by Component 2024 & 2032
- Figure 25: North America ASEAN EV Battery Pack Market Revenue Share (%), by Component 2024 & 2032
- Figure 26: North America ASEAN EV Battery Pack Market Revenue (Million), by Material Type 2024 & 2032
- Figure 27: North America ASEAN EV Battery Pack Market Revenue Share (%), by Material Type 2024 & 2032
- Figure 28: North America ASEAN EV Battery Pack Market Revenue (Million), by Country 2024 & 2032
- Figure 29: North America ASEAN EV Battery Pack Market Revenue Share (%), by Country 2024 & 2032
- Figure 30: South America ASEAN EV Battery Pack Market Revenue (Million), by Body Type 2024 & 2032
- Figure 31: South America ASEAN EV Battery Pack Market Revenue Share (%), by Body Type 2024 & 2032
- Figure 32: South America ASEAN EV Battery Pack Market Revenue (Million), by Propulsion Type 2024 & 2032
- Figure 33: South America ASEAN EV Battery Pack Market Revenue Share (%), by Propulsion Type 2024 & 2032
- Figure 34: South America ASEAN EV Battery Pack Market Revenue (Million), by Battery Chemistry 2024 & 2032
- Figure 35: South America ASEAN EV Battery Pack Market Revenue Share (%), by Battery Chemistry 2024 & 2032
- Figure 36: South America ASEAN EV Battery Pack Market Revenue (Million), by Capacity 2024 & 2032
- Figure 37: South America ASEAN EV Battery Pack Market Revenue Share (%), by Capacity 2024 & 2032
- Figure 38: South America ASEAN EV Battery Pack Market Revenue (Million), by Battery Form 2024 & 2032
- Figure 39: South America ASEAN EV Battery Pack Market Revenue Share (%), by Battery Form 2024 & 2032
- Figure 40: South America ASEAN EV Battery Pack Market Revenue (Million), by Method 2024 & 2032
- Figure 41: South America ASEAN EV Battery Pack Market Revenue Share (%), by Method 2024 & 2032
- Figure 42: South America ASEAN EV Battery Pack Market Revenue (Million), by Component 2024 & 2032
- Figure 43: South America ASEAN EV Battery Pack Market Revenue Share (%), by Component 2024 & 2032
- Figure 44: South America ASEAN EV Battery Pack Market Revenue (Million), by Material Type 2024 & 2032
- Figure 45: South America ASEAN EV Battery Pack Market Revenue Share (%), by Material Type 2024 & 2032
- Figure 46: South America ASEAN EV Battery Pack Market Revenue (Million), by Country 2024 & 2032
- Figure 47: South America ASEAN EV Battery Pack Market Revenue Share (%), by Country 2024 & 2032
- Figure 48: Europe ASEAN EV Battery Pack Market Revenue (Million), by Body Type 2024 & 2032
- Figure 49: Europe ASEAN EV Battery Pack Market Revenue Share (%), by Body Type 2024 & 2032
- Figure 50: Europe ASEAN EV Battery Pack Market Revenue (Million), by Propulsion Type 2024 & 2032
- Figure 51: Europe ASEAN EV Battery Pack Market Revenue Share (%), by Propulsion Type 2024 & 2032
- Figure 52: Europe ASEAN EV Battery Pack Market Revenue (Million), by Battery Chemistry 2024 & 2032
- Figure 53: Europe ASEAN EV Battery Pack Market Revenue Share (%), by Battery Chemistry 2024 & 2032
- Figure 54: Europe ASEAN EV Battery Pack Market Revenue (Million), by Capacity 2024 & 2032
- Figure 55: Europe ASEAN EV Battery Pack Market Revenue Share (%), by Capacity 2024 & 2032
- Figure 56: Europe ASEAN EV Battery Pack Market Revenue (Million), by Battery Form 2024 & 2032
- Figure 57: Europe ASEAN EV Battery Pack Market Revenue Share (%), by Battery Form 2024 & 2032
- Figure 58: Europe ASEAN EV Battery Pack Market Revenue (Million), by Method 2024 & 2032
- Figure 59: Europe ASEAN EV Battery Pack Market Revenue Share (%), by Method 2024 & 2032
- Figure 60: Europe ASEAN EV Battery Pack Market Revenue (Million), by Component 2024 & 2032
- Figure 61: Europe ASEAN EV Battery Pack Market Revenue Share (%), by Component 2024 & 2032
- Figure 62: Europe ASEAN EV Battery Pack Market Revenue (Million), by Material Type 2024 & 2032
- Figure 63: Europe ASEAN EV Battery Pack Market Revenue Share (%), by Material Type 2024 & 2032
- Figure 64: Europe ASEAN EV Battery Pack Market Revenue (Million), by Country 2024 & 2032
- Figure 65: Europe ASEAN EV Battery Pack Market Revenue Share (%), by Country 2024 & 2032
- Figure 66: Middle East & Africa ASEAN EV Battery Pack Market Revenue (Million), by Body Type 2024 & 2032
- Figure 67: Middle East & Africa ASEAN EV Battery Pack Market Revenue Share (%), by Body Type 2024 & 2032
- Figure 68: Middle East & Africa ASEAN EV Battery Pack Market Revenue (Million), by Propulsion Type 2024 & 2032
- Figure 69: Middle East & Africa ASEAN EV Battery Pack Market Revenue Share (%), by Propulsion Type 2024 & 2032
- Figure 70: Middle East & Africa ASEAN EV Battery Pack Market Revenue (Million), by Battery Chemistry 2024 & 2032
- Figure 71: Middle East & Africa ASEAN EV Battery Pack Market Revenue Share (%), by Battery Chemistry 2024 & 2032
- Figure 72: Middle East & Africa ASEAN EV Battery Pack Market Revenue (Million), by Capacity 2024 & 2032
- Figure 73: Middle East & Africa ASEAN EV Battery Pack Market Revenue Share (%), by Capacity 2024 & 2032
- Figure 74: Middle East & Africa ASEAN EV Battery Pack Market Revenue (Million), by Battery Form 2024 & 2032
- Figure 75: Middle East & Africa ASEAN EV Battery Pack Market Revenue Share (%), by Battery Form 2024 & 2032
- Figure 76: Middle East & Africa ASEAN EV Battery Pack Market Revenue (Million), by Method 2024 & 2032
- Figure 77: Middle East & Africa ASEAN EV Battery Pack Market Revenue Share (%), by Method 2024 & 2032
- Figure 78: Middle East & Africa ASEAN EV Battery Pack Market Revenue (Million), by Component 2024 & 2032
- Figure 79: Middle East & Africa ASEAN EV Battery Pack Market Revenue Share (%), by Component 2024 & 2032
- Figure 80: Middle East & Africa ASEAN EV Battery Pack Market Revenue (Million), by Material Type 2024 & 2032
- Figure 81: Middle East & Africa ASEAN EV Battery Pack Market Revenue Share (%), by Material Type 2024 & 2032
- Figure 82: Middle East & Africa ASEAN EV Battery Pack Market Revenue (Million), by Country 2024 & 2032
- Figure 83: Middle East & Africa ASEAN EV Battery Pack Market Revenue Share (%), by Country 2024 & 2032
- Figure 84: Asia Pacific ASEAN EV Battery Pack Market Revenue (Million), by Body Type 2024 & 2032
- Figure 85: Asia Pacific ASEAN EV Battery Pack Market Revenue Share (%), by Body Type 2024 & 2032
- Figure 86: Asia Pacific ASEAN EV Battery Pack Market Revenue (Million), by Propulsion Type 2024 & 2032
- Figure 87: Asia Pacific ASEAN EV Battery Pack Market Revenue Share (%), by Propulsion Type 2024 & 2032
- Figure 88: Asia Pacific ASEAN EV Battery Pack Market Revenue (Million), by Battery Chemistry 2024 & 2032
- Figure 89: Asia Pacific ASEAN EV Battery Pack Market Revenue Share (%), by Battery Chemistry 2024 & 2032
- Figure 90: Asia Pacific ASEAN EV Battery Pack Market Revenue (Million), by Capacity 2024 & 2032
- Figure 91: Asia Pacific ASEAN EV Battery Pack Market Revenue Share (%), by Capacity 2024 & 2032
- Figure 92: Asia Pacific ASEAN EV Battery Pack Market Revenue (Million), by Battery Form 2024 & 2032
- Figure 93: Asia Pacific ASEAN EV Battery Pack Market Revenue Share (%), by Battery Form 2024 & 2032
- Figure 94: Asia Pacific ASEAN EV Battery Pack Market Revenue (Million), by Method 2024 & 2032
- Figure 95: Asia Pacific ASEAN EV Battery Pack Market Revenue Share (%), by Method 2024 & 2032
- Figure 96: Asia Pacific ASEAN EV Battery Pack Market Revenue (Million), by Component 2024 & 2032
- Figure 97: Asia Pacific ASEAN EV Battery Pack Market Revenue Share (%), by Component 2024 & 2032
- Figure 98: Asia Pacific ASEAN EV Battery Pack Market Revenue (Million), by Material Type 2024 & 2032
- Figure 99: Asia Pacific ASEAN EV Battery Pack Market Revenue Share (%), by Material Type 2024 & 2032
- Figure 100: Asia Pacific ASEAN EV Battery Pack Market Revenue (Million), by Country 2024 & 2032
- Figure 101: Asia Pacific ASEAN EV Battery Pack Market Revenue Share (%), by Country 2024 & 2032
List of Tables
- Table 1: Global ASEAN EV Battery Pack Market Revenue Million Forecast, by Region 2019 & 2032
- Table 2: Global ASEAN EV Battery Pack Market Revenue Million Forecast, by Body Type 2019 & 2032
- Table 3: Global ASEAN EV Battery Pack Market Revenue Million Forecast, by Propulsion Type 2019 & 2032
- Table 4: Global ASEAN EV Battery Pack Market Revenue Million Forecast, by Battery Chemistry 2019 & 2032
- Table 5: Global ASEAN EV Battery Pack Market Revenue Million Forecast, by Capacity 2019 & 2032
- Table 6: Global ASEAN EV Battery Pack Market Revenue Million Forecast, by Battery Form 2019 & 2032
- Table 7: Global ASEAN EV Battery Pack Market Revenue Million Forecast, by Method 2019 & 2032
- Table 8: Global ASEAN EV Battery Pack Market Revenue Million Forecast, by Component 2019 & 2032
- Table 9: Global ASEAN EV Battery Pack Market Revenue Million Forecast, by Material Type 2019 & 2032
- Table 10: Global ASEAN EV Battery Pack Market Revenue Million Forecast, by Region 2019 & 2032
- Table 11: Global ASEAN EV Battery Pack Market Revenue Million Forecast, by Country 2019 & 2032
- Table 12: United States ASEAN EV Battery Pack Market Revenue (Million) Forecast, by Application 2019 & 2032
- Table 13: Canada ASEAN EV Battery Pack Market Revenue (Million) Forecast, by Application 2019 & 2032
- Table 14: Mexico ASEAN EV Battery Pack Market Revenue (Million) Forecast, by Application 2019 & 2032
- Table 15: Rest of North America ASEAN EV Battery Pack Market Revenue (Million) Forecast, by Application 2019 & 2032
- Table 16: Global ASEAN EV Battery Pack Market Revenue Million Forecast, by Country 2019 & 2032
- Table 17: Germany ASEAN EV Battery Pack Market Revenue (Million) Forecast, by Application 2019 & 2032
- Table 18: United Kingdom ASEAN EV Battery Pack Market Revenue (Million) Forecast, by Application 2019 & 2032
- Table 19: France ASEAN EV Battery Pack Market Revenue (Million) Forecast, by Application 2019 & 2032
- Table 20: Italy ASEAN EV Battery Pack Market Revenue (Million) Forecast, by Application 2019 & 2032
- Table 21: Rest of Europe ASEAN EV Battery Pack Market Revenue (Million) Forecast, by Application 2019 & 2032
- Table 22: Global ASEAN EV Battery Pack Market Revenue Million Forecast, by Country 2019 & 2032
- Table 23: China ASEAN EV Battery Pack Market Revenue (Million) Forecast, by Application 2019 & 2032
- Table 24: Japan ASEAN EV Battery Pack Market Revenue (Million) Forecast, by Application 2019 & 2032
- Table 25: India ASEAN EV Battery Pack Market Revenue (Million) Forecast, by Application 2019 & 2032
- Table 26: Australia ASEAN EV Battery Pack Market Revenue (Million) Forecast, by Application 2019 & 2032
- Table 27: Rest of Asia Pacific ASEAN EV Battery Pack Market Revenue (Million) Forecast, by Application 2019 & 2032
- Table 28: Global ASEAN EV Battery Pack Market Revenue Million Forecast, by Country 2019 & 2032
- Table 29: Brazil ASEAN EV Battery Pack Market Revenue (Million) Forecast, by Application 2019 & 2032
- Table 30: Argentina ASEAN EV Battery Pack Market Revenue (Million) Forecast, by Application 2019 & 2032
- Table 31: Rest of South America ASEAN EV Battery Pack Market Revenue (Million) Forecast, by Application 2019 & 2032
- Table 32: Global ASEAN EV Battery Pack Market Revenue Million Forecast, by Country 2019 & 2032
- Table 33: United Arab Emirates ASEAN EV Battery Pack Market Revenue (Million) Forecast, by Application 2019 & 2032
- Table 34: Saudi Arabia ASEAN EV Battery Pack Market Revenue (Million) Forecast, by Application 2019 & 2032
- Table 35: Rest of Middle East and Africa ASEAN EV Battery Pack Market Revenue (Million) Forecast, by Application 2019 & 2032
- Table 36: Global ASEAN EV Battery Pack Market Revenue Million Forecast, by Body Type 2019 & 2032
- Table 37: Global ASEAN EV Battery Pack Market Revenue Million Forecast, by Propulsion Type 2019 & 2032
- Table 38: Global ASEAN EV Battery Pack Market Revenue Million Forecast, by Battery Chemistry 2019 & 2032
- Table 39: Global ASEAN EV Battery Pack Market Revenue Million Forecast, by Capacity 2019 & 2032
- Table 40: Global ASEAN EV Battery Pack Market Revenue Million Forecast, by Battery Form 2019 & 2032
- Table 41: Global ASEAN EV Battery Pack Market Revenue Million Forecast, by Method 2019 & 2032
- Table 42: Global ASEAN EV Battery Pack Market Revenue Million Forecast, by Component 2019 & 2032
- Table 43: Global ASEAN EV Battery Pack Market Revenue Million Forecast, by Material Type 2019 & 2032
- Table 44: Global ASEAN EV Battery Pack Market Revenue Million Forecast, by Country 2019 & 2032
- Table 45: United States ASEAN EV Battery Pack Market Revenue (Million) Forecast, by Application 2019 & 2032
- Table 46: Canada ASEAN EV Battery Pack Market Revenue (Million) Forecast, by Application 2019 & 2032
- Table 47: Mexico ASEAN EV Battery Pack Market Revenue (Million) Forecast, by Application 2019 & 2032
- Table 48: Global ASEAN EV Battery Pack Market Revenue Million Forecast, by Body Type 2019 & 2032
- Table 49: Global ASEAN EV Battery Pack Market Revenue Million Forecast, by Propulsion Type 2019 & 2032
- Table 50: Global ASEAN EV Battery Pack Market Revenue Million Forecast, by Battery Chemistry 2019 & 2032
- Table 51: Global ASEAN EV Battery Pack Market Revenue Million Forecast, by Capacity 2019 & 2032
- Table 52: Global ASEAN EV Battery Pack Market Revenue Million Forecast, by Battery Form 2019 & 2032
- Table 53: Global ASEAN EV Battery Pack Market Revenue Million Forecast, by Method 2019 & 2032
- Table 54: Global ASEAN EV Battery Pack Market Revenue Million Forecast, by Component 2019 & 2032
- Table 55: Global ASEAN EV Battery Pack Market Revenue Million Forecast, by Material Type 2019 & 2032
- Table 56: Global ASEAN EV Battery Pack Market Revenue Million Forecast, by Country 2019 & 2032
- Table 57: Brazil ASEAN EV Battery Pack Market Revenue (Million) Forecast, by Application 2019 & 2032
- Table 58: Argentina ASEAN EV Battery Pack Market Revenue (Million) Forecast, by Application 2019 & 2032
- Table 59: Rest of South America ASEAN EV Battery Pack Market Revenue (Million) Forecast, by Application 2019 & 2032
- Table 60: Global ASEAN EV Battery Pack Market Revenue Million Forecast, by Body Type 2019 & 2032
- Table 61: Global ASEAN EV Battery Pack Market Revenue Million Forecast, by Propulsion Type 2019 & 2032
- Table 62: Global ASEAN EV Battery Pack Market Revenue Million Forecast, by Battery Chemistry 2019 & 2032
- Table 63: Global ASEAN EV Battery Pack Market Revenue Million Forecast, by Capacity 2019 & 2032
- Table 64: Global ASEAN EV Battery Pack Market Revenue Million Forecast, by Battery Form 2019 & 2032
- Table 65: Global ASEAN EV Battery Pack Market Revenue Million Forecast, by Method 2019 & 2032
- Table 66: Global ASEAN EV Battery Pack Market Revenue Million Forecast, by Component 2019 & 2032
- Table 67: Global ASEAN EV Battery Pack Market Revenue Million Forecast, by Material Type 2019 & 2032
- Table 68: Global ASEAN EV Battery Pack Market Revenue Million Forecast, by Country 2019 & 2032
- Table 69: United Kingdom ASEAN EV Battery Pack Market Revenue (Million) Forecast, by Application 2019 & 2032
- Table 70: Germany ASEAN EV Battery Pack Market Revenue (Million) Forecast, by Application 2019 & 2032
- Table 71: France ASEAN EV Battery Pack Market Revenue (Million) Forecast, by Application 2019 & 2032
- Table 72: Italy ASEAN EV Battery Pack Market Revenue (Million) Forecast, by Application 2019 & 2032
- Table 73: Spain ASEAN EV Battery Pack Market Revenue (Million) Forecast, by Application 2019 & 2032
- Table 74: Russia ASEAN EV Battery Pack Market Revenue (Million) Forecast, by Application 2019 & 2032
- Table 75: Benelux ASEAN EV Battery Pack Market Revenue (Million) Forecast, by Application 2019 & 2032
- Table 76: Nordics ASEAN EV Battery Pack Market Revenue (Million) Forecast, by Application 2019 & 2032
- Table 77: Rest of Europe ASEAN EV Battery Pack Market Revenue (Million) Forecast, by Application 2019 & 2032
- Table 78: Global ASEAN EV Battery Pack Market Revenue Million Forecast, by Body Type 2019 & 2032
- Table 79: Global ASEAN EV Battery Pack Market Revenue Million Forecast, by Propulsion Type 2019 & 2032
- Table 80: Global ASEAN EV Battery Pack Market Revenue Million Forecast, by Battery Chemistry 2019 & 2032
- Table 81: Global ASEAN EV Battery Pack Market Revenue Million Forecast, by Capacity 2019 & 2032
- Table 82: Global ASEAN EV Battery Pack Market Revenue Million Forecast, by Battery Form 2019 & 2032
- Table 83: Global ASEAN EV Battery Pack Market Revenue Million Forecast, by Method 2019 & 2032
- Table 84: Global ASEAN EV Battery Pack Market Revenue Million Forecast, by Component 2019 & 2032
- Table 85: Global ASEAN EV Battery Pack Market Revenue Million Forecast, by Material Type 2019 & 2032
- Table 86: Global ASEAN EV Battery Pack Market Revenue Million Forecast, by Country 2019 & 2032
- Table 87: Turkey ASEAN EV Battery Pack Market Revenue (Million) Forecast, by Application 2019 & 2032
- Table 88: Israel ASEAN EV Battery Pack Market Revenue (Million) Forecast, by Application 2019 & 2032
- Table 89: GCC ASEAN EV Battery Pack Market Revenue (Million) Forecast, by Application 2019 & 2032
- Table 90: North Africa ASEAN EV Battery Pack Market Revenue (Million) Forecast, by Application 2019 & 2032
- Table 91: South Africa ASEAN EV Battery Pack Market Revenue (Million) Forecast, by Application 2019 & 2032
- Table 92: Rest of Middle East & Africa ASEAN EV Battery Pack Market Revenue (Million) Forecast, by Application 2019 & 2032
- Table 93: Global ASEAN EV Battery Pack Market Revenue Million Forecast, by Body Type 2019 & 2032
- Table 94: Global ASEAN EV Battery Pack Market Revenue Million Forecast, by Propulsion Type 2019 & 2032
- Table 95: Global ASEAN EV Battery Pack Market Revenue Million Forecast, by Battery Chemistry 2019 & 2032
- Table 96: Global ASEAN EV Battery Pack Market Revenue Million Forecast, by Capacity 2019 & 2032
- Table 97: Global ASEAN EV Battery Pack Market Revenue Million Forecast, by Battery Form 2019 & 2032
- Table 98: Global ASEAN EV Battery Pack Market Revenue Million Forecast, by Method 2019 & 2032
- Table 99: Global ASEAN EV Battery Pack Market Revenue Million Forecast, by Component 2019 & 2032
- Table 100: Global ASEAN EV Battery Pack Market Revenue Million Forecast, by Material Type 2019 & 2032
- Table 101: Global ASEAN EV Battery Pack Market Revenue Million Forecast, by Country 2019 & 2032
- Table 102: China ASEAN EV Battery Pack Market Revenue (Million) Forecast, by Application 2019 & 2032
- Table 103: India ASEAN EV Battery Pack Market Revenue (Million) Forecast, by Application 2019 & 2032
- Table 104: Japan ASEAN EV Battery Pack Market Revenue (Million) Forecast, by Application 2019 & 2032
- Table 105: South Korea ASEAN EV Battery Pack Market Revenue (Million) Forecast, by Application 2019 & 2032
- Table 106: ASEAN ASEAN EV Battery Pack Market Revenue (Million) Forecast, by Application 2019 & 2032
- Table 107: Oceania ASEAN EV Battery Pack Market Revenue (Million) Forecast, by Application 2019 & 2032
- Table 108: Rest of Asia Pacific ASEAN EV Battery Pack Market Revenue (Million) Forecast, by Application 2019 & 2032
Frequently Asked Questions
1. What is the projected Compound Annual Growth Rate (CAGR) of the ASEAN EV Battery Pack Market?
The projected CAGR is approximately 13.50%.
2. Which companies are prominent players in the ASEAN EV Battery Pack Market?
Key companies in the market include Ningde E-CON Power System Co Ltd, Denso Corporation, Samsung SDI Co Ltd, LG Energy Solution Ltd, Guoxuan High-tech Co Ltd, SVOLT Energy Technology Co Ltd (SVOLT, Deutsche ACCUmotive GmbH & Co KG, Contemporary Amperex Technology Co Ltd (CATL), BYD Company Ltd, SK Innovation Co Ltd, Do-Fluoride (Jiaozuo) New Energy Technology, Panasonic Holdings Corporation.
3. What are the main segments of the ASEAN EV Battery Pack Market?
The market segments include Body Type, Propulsion Type, Battery Chemistry, Capacity, Battery Form, Method, Component, Material Type.
4. Can you provide details about the market size?
The market size is estimated to be USD XX Million as of 2022.
5. What are some drivers contributing to market growth?
Governments worldwide are implementing strict regulations and providing incentives to promote the adoption of electric vehicles; Others.
6. What are the notable trends driving market growth?
OTHER KEY INDUSTRY TRENDS COVERED IN THE REPORT.
7. Are there any restraints impacting market growth?
High Initial Costs; Others.
8. Can you provide examples of recent developments in the market?
April 2023: CATL announced that it will launch its sodium-ion battery in Chery models first. In addition, the two parties will jointly build the new ENER-Q battery brand, covering all application scenarios of all power types and all material systems.March 2023: Contemporary Amperex Technology Co., Ltd. (CATL) announced that it signed a strategic cooperation agreement on business cooperation and advanced technology development with Beijing Automotive Group Co., Ltd. (BAIC Group).March 2023: Contemporary Amperex Technology Co., Ltd. (CATL) announced that it has established a joint venture (JV) named Jiefang Shidai New Energy Technology Co., Ltd. with FAW Jiefang Automotive Co., Ltd. (FAW Jiefang). The JV has a registered capital of CNY 90 million, with CATL and FAW Jiefang each holding a 50% share.
9. What pricing options are available for accessing the report?
Pricing options include single-user, multi-user, and enterprise licenses priced at USD 3800, USD 4500, and USD 5800 respectively.
10. Is the market size provided in terms of value or volume?
The market size is provided in terms of value, measured in Million.
11. Are there any specific market keywords associated with the report?
Yes, the market keyword associated with the report is "ASEAN EV Battery Pack Market," which aids in identifying and referencing the specific market segment covered.
12. How do I determine which pricing option suits my needs best?
The pricing options vary based on user requirements and access needs. Individual users may opt for single-user licenses, while businesses requiring broader access may choose multi-user or enterprise licenses for cost-effective access to the report.
13. Are there any additional resources or data provided in the ASEAN EV Battery Pack Market report?
While the report offers comprehensive insights, it's advisable to review the specific contents or supplementary materials provided to ascertain if additional resources or data are available.
14. How can I stay updated on further developments or reports in the ASEAN EV Battery Pack Market?
To stay informed about further developments, trends, and reports in the ASEAN EV Battery Pack Market, consider subscribing to industry newsletters, following relevant companies and organizations, or regularly checking reputable industry news sources and publications.
Methodology
Step 1 - Identification of Relevant Samples Size from Population Database


Step 2 - Approaches for Defining Global Market Size (Value, Volume* & Price*)

Note*: In applicable scenarios
Step 3 - Data Sources
Primary Research
- Web Analytics
- Survey Reports
- Research Institute
- Latest Research Reports
- Opinion Leaders
Secondary Research
- Annual Reports
- White Paper
- Latest Press Release
- Industry Association
- Paid Database
- Investor Presentations

Step 4 - Data Triangulation
Involves using different sources of information in order to increase the validity of a study
These sources are likely to be stakeholders in a program - participants, other researchers, program staff, other community members, and so on.
Then we put all data in single framework & apply various statistical tools to find out the dynamic on the market.
During the analysis stage, feedback from the stakeholder groups would be compared to determine areas of agreement as well as areas of divergence


