
Key Insights
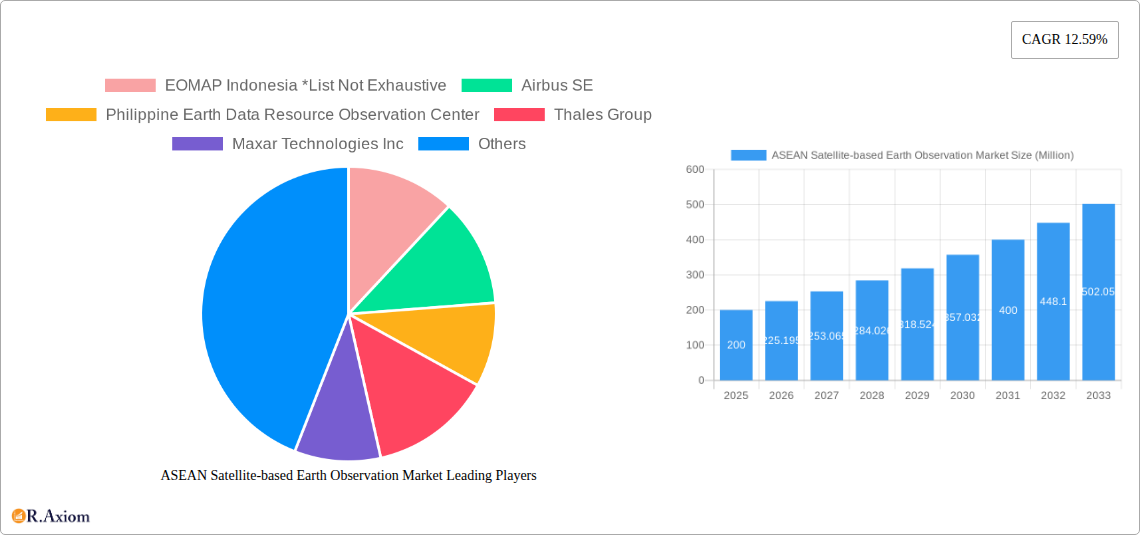
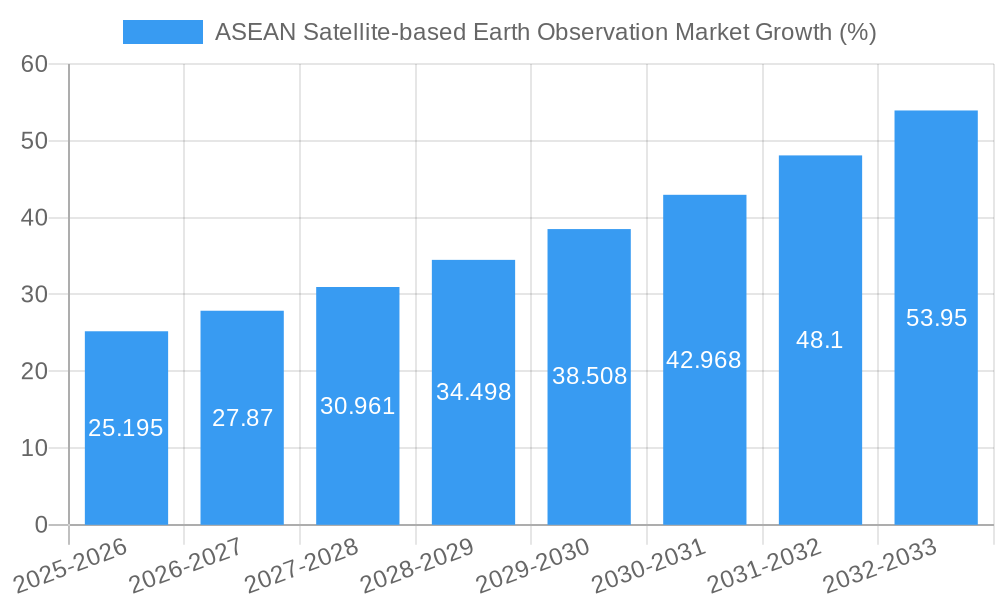
The ASEAN satellite-based Earth observation market, valued at $200 million in 2025, is poised for significant growth, projected to expand at a Compound Annual Growth Rate (CAGR) of 12.59% from 2025 to 2033. This robust expansion is driven by increasing government investments in infrastructure development, a rising demand for precise agricultural data to optimize yields, and the growing need for effective disaster management and climate change mitigation strategies across the region. The market's segmentation reveals strong potential across various sectors: Urban development and cultural heritage initiatives are leveraging satellite imagery for detailed mapping and preservation efforts. The agricultural sector benefits immensely from high-resolution data for precision farming, crop monitoring, and yield prediction. Climate services are increasingly reliant on satellite data for weather forecasting, environmental monitoring, and climate modeling, contributing significantly to market growth. Furthermore, the energy and raw materials sectors employ satellite imagery for exploration, resource management, and infrastructure monitoring, while the infrastructure sector benefits from efficient planning and construction management. Key players in this market include established international companies like Airbus SE and Maxar Technologies Inc., along with regional firms such as EOMAP Indonesia and the Philippine Earth Data Resource Observation Center, indicating a mix of global expertise and local market knowledge.
The dominance of specific satellite orbits and data types is expected to evolve. Low Earth Orbit (LEO) satellites are currently favored for their high-resolution imagery, crucial for applications demanding detailed analysis. However, the market is likely to witness increased adoption of Medium Earth Orbit (MEO) and Geostationary Orbit (GEO) satellites for specific applications requiring continuous monitoring. The value-added services segment, encompassing data analytics, processing, and interpretation, is anticipated to grow rapidly, driven by the increasing demand for actionable insights from raw satellite data. Geographic growth will be uneven, with countries like Thailand, Indonesia, and the Philippines showing particularly strong growth due to their large land areas, diverse economies, and escalating need for advanced technologies in various sectors. The "Others" segment, encompassing smaller ASEAN nations, presents a substantial opportunity for future expansion.
ASEAN Satellite-based Earth Observation Market: A Comprehensive Report (2019-2033)
This comprehensive report provides an in-depth analysis of the ASEAN satellite-based Earth observation market, offering valuable insights for industry stakeholders, investors, and policymakers. Covering the period 2019-2033, with a focus on 2025, this report delves into market size, segmentation, growth drivers, challenges, and future opportunities. The report leverages data-driven analysis to provide actionable intelligence, enabling informed decision-making in this rapidly evolving sector.
ASEAN Satellite-based Earth Observation Market Concentration & Innovation
The ASEAN satellite-based Earth observation market exhibits a moderately concentrated landscape, with a few major players holding significant market share. Airbus SE, Maxar Technologies Inc, and Thales Group are prominent examples, commanding xx% of the market in 2025 (estimated). However, the presence of numerous smaller, specialized companies like EOMAP Indonesia and Spire Global Inc indicates a dynamic competitive environment. Innovation is a key driver, fueled by advancements in satellite technology, data analytics, and AI-powered applications. The market witnesses continuous product development, pushing the boundaries of Earth observation capabilities. Mergers and acquisitions (M&A) activity plays a significant role in shaping the market landscape. Recent M&A deals have been valued at approximately xx Million, facilitating consolidation and expanding service offerings. Regulatory frameworks, while generally supportive of space technology development in the region, vary across ASEAN countries, presenting both opportunities and challenges for market participants. The increasing availability of alternative data sources (e.g., drone imagery) presents a moderate level of substitution, yet the unique advantages of satellite data, such as wide-area coverage and consistent temporal resolution, maintain its dominant position. End-user trends show a growing demand for value-added services and customized solutions, driving innovation in data processing and analytical capabilities.
- Market Concentration: Moderately concentrated, with a few major players holding xx% market share in 2025 (estimated).
- Innovation Drivers: Advancements in satellite technology, data analytics, AI, and increasing demand for value-added services.
- Regulatory Frameworks: Vary across ASEAN countries, presenting both opportunities and challenges.
- Product Substitutes: Moderate substitution from alternative data sources, but satellite data retains its strengths.
- M&A Activity: Significant, with recent deals valued at approximately xx Million.
- End-User Trends: Growing demand for value-added services and customized solutions.
ASEAN Satellite-based Earth Observation Market Industry Trends & Insights
The ASEAN satellite-based Earth observation market is experiencing robust growth, driven by increasing government investments in space technology, rising awareness of the value of Earth observation data across various sectors, and the accelerating adoption of advanced analytics. The market is projected to register a Compound Annual Growth Rate (CAGR) of xx% during the forecast period (2025-2033), reaching a value of xx Million by 2033. Technological disruptions, such as the proliferation of smaller, more affordable satellites and advancements in high-resolution imagery, are further boosting market expansion. Consumer preferences are shifting towards real-time data access, cloud-based solutions, and integrated platforms. Competitive dynamics are characterized by a mix of established players and emerging startups, leading to innovation and price competition. Market penetration is increasing across all major segments, although there remains significant untapped potential, especially in smaller ASEAN countries. The rising adoption of satellite-based solutions for monitoring deforestation, managing natural resources, and improving disaster response capabilities is driving market growth. The increasing demand for accurate and timely information for improved decision-making is another significant driver. Government initiatives are stimulating investments in satellite infrastructure and data processing capabilities.
Dominant Markets & Segments in ASEAN Satellite-based Earth Observation Market
- By Type: Earth Observation Data currently dominates, followed by Value-Added Services, which is experiencing faster growth.
- By Satellite Orbit: Low Earth Orbit (LEO) is the most dominant segment due to higher resolution and frequent revisit times.
- By End-use: Agriculture and Urban Development & Cultural Heritage are leading segments, driven by high demand and government initiatives. Climate Services is also a rapidly growing sector.
- By Country: Indonesia and Thailand represent the largest markets, fueled by significant investments and government support for space technology.
Indonesia's robust economy and focus on infrastructure development fuels high demand for satellite data across multiple sectors. Thailand's proactive space policy and investments in satellite infrastructure have positioned it as a regional leader. Malaysia's burgeoning space sector and collaborations with international companies such as Airbus are driving market growth within the country. The Philippines exhibits growing interest and investment in this domain, yet lags behind Indonesia and Thailand in market maturity.
Key Drivers:
- Economic Growth: Strong economic growth across ASEAN countries drives demand for infrastructure development and resource management.
- Government Initiatives: Increasing government support for space technology and investment in infrastructure stimulates market expansion.
- Technological Advancements: Developments in satellite technology and data analytics continuously expand market applications and possibilities.
- Infrastructure Development: Extensive ongoing infrastructure projects create a strong demand for satellite-based monitoring and planning tools.
ASEAN Satellite-based Earth Observation Market Product Developments
The ASEAN satellite-based Earth observation market is witnessing significant product innovations, marked by the emergence of advanced sensors, improved data processing techniques, and the integration of AI and machine learning capabilities. New products offer enhanced resolution, wider coverage areas, and faster data delivery. These advancements enable more precise applications in various fields, including agriculture (precision farming), urban planning (smart cities), and environmental monitoring (climate change mitigation). The focus is on developing user-friendly platforms and providing tailored solutions to cater to specific end-user needs. The competitive advantage lies in providing higher resolution data, advanced analytics, and cost-effective solutions.
Report Scope & Segmentation Analysis
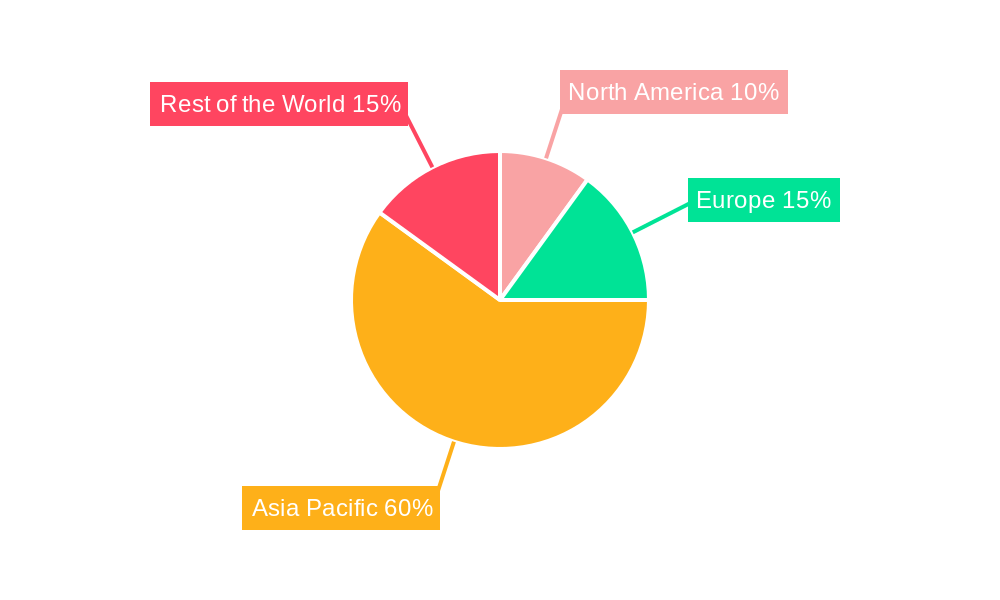
This report segments the ASEAN satellite-based Earth observation market by Type (Earth Observation Data and Value-Added Services), Satellite Orbit (Low Earth Orbit, Medium Earth Orbit, and Geostationary Orbit), End-use (Urban Development and Cultural Heritage, Agriculture, Climate Services, Energy and Raw Materials, Infrastructure, and Others), and Country (Thailand, Indonesia, Malaysia, Philippines, and Others). Each segment is analyzed in detail, considering market size, growth projections, and competitive dynamics. The market is expected to witness significant growth across all segments, with value-added services and LEO-based solutions showing particularly strong growth potential. Competitive landscapes vary across segments and countries, reflecting the diverse range of players and their specific capabilities.
Key Drivers of ASEAN Satellite-based Earth Observation Market Growth
The ASEAN satellite-based Earth observation market's growth is primarily driven by a confluence of technological advancements, supportive government policies, and increasing awareness of the applications of Earth observation data. The region's rapid economic expansion and urbanization necessitates effective resource management and infrastructure development, leading to a heightened demand for sophisticated Earth observation solutions. Technological breakthroughs, such as the development of high-resolution sensors and advanced data analytics capabilities, enhance the accuracy and versatility of Earth observation applications. Moreover, government initiatives focusing on improving disaster response, environmental protection, and sustainable development propel the sector's growth.
Challenges in the ASEAN Satellite-based Earth Observation Market Sector
The ASEAN satellite-based Earth observation market faces challenges such as the high cost of satellite technology, data processing, and specialized expertise. Data security and privacy concerns, coupled with varying regulatory frameworks across ASEAN countries, pose significant hurdles. The lack of standardized data formats and interoperability issues also hinder seamless data integration and analysis. Furthermore, competition from other data sources, such as aerial photography and drone imagery, presents a competitive challenge. These factors necessitate strategic planning and adaptation by market participants.
Emerging Opportunities in ASEAN Satellite-based Earth Observation Market
Emerging opportunities abound in the ASEAN satellite-based Earth observation market, driven by technological advancements and evolving market needs. The increasing adoption of cloud computing and AI-powered analytics will open new avenues for data processing and interpretation. The growing demand for real-time data in areas such as disaster management and environmental monitoring creates significant opportunities for timely and accurate data delivery. Furthermore, the increasing focus on sustainability and climate change mitigation drives demand for satellite-based solutions in carbon monitoring and resource management.
Leading Players in the ASEAN Satellite-based Earth Observation Market Market
- EOMAP Indonesia
- Airbus SE
- Philippine Earth Data Resource Observation Center
- Thales Group
- Maxar Technologies Inc
- Boeing Co
- NEC Corporation
- ST Engineering
- Spire Global Inc
Key Developments in ASEAN Satellite-based Earth Observation Market Industry
- February 2023: An MOU was signed between Thailand's GISTDA and Singapore's OSTIn to foster collaboration on Earth observation applications, creating new market opportunities for vendors.
- May 2023: Airbus announced its expansion of satellite services in Malaysia, leveraging the country's growing space sector and its partnership with MYSA for a constellation of Earth observation satellites. This strengthens Airbus' position in the region and boosts the availability of satellite-based services.
Strategic Outlook for ASEAN Satellite-based Earth Observation Market Market
The ASEAN satellite-based Earth observation market exhibits significant growth potential, driven by continuous technological advancements, increasing government support, and expanding applications across various sectors. The market is poised for further consolidation through mergers and acquisitions, leading to larger, more integrated players offering comprehensive solutions. The focus on developing value-added services, tailored solutions, and user-friendly platforms will further propel market growth. The adoption of innovative technologies such as AI and machine learning will play a crucial role in enhancing data analysis and interpretation capabilities, unlocking new possibilities for market expansion and unlocking the potential of the region's vast geographic area.
ASEAN Satellite-based Earth Observation Market Segmentation
-
1. Type
- 1.1. Earth Observation Data
- 1.2. Value Added Services
-
2. Satellite Orbit
- 2.1. Low Earth Orbit
- 2.2. Medium Earth Orbit
- 2.3. Geostationary Orbit
-
3. End-use
- 3.1. Urban Development and Cultural Heritage
- 3.2. Agriculture
- 3.3. Climate Services
- 3.4. Energy and Raw Materials
- 3.5. Infrastructure
- 3.6. Others
ASEAN Satellite-based Earth Observation Market Segmentation By Geography
-
1. North America
- 1.1. United States
- 1.2. Canada
- 1.3. Mexico
-
2. South America
- 2.1. Brazil
- 2.2. Argentina
- 2.3. Rest of South America
-
3. Europe
- 3.1. United Kingdom
- 3.2. Germany
- 3.3. France
- 3.4. Italy
- 3.5. Spain
- 3.6. Russia
- 3.7. Benelux
- 3.8. Nordics
- 3.9. Rest of Europe
-
4. Middle East & Africa
- 4.1. Turkey
- 4.2. Israel
- 4.3. GCC
- 4.4. North Africa
- 4.5. South Africa
- 4.6. Rest of Middle East & Africa
-
5. Asia Pacific
- 5.1. China
- 5.2. India
- 5.3. Japan
- 5.4. South Korea
- 5.5. ASEAN
- 5.6. Oceania
- 5.7. Rest of Asia Pacific
ASEAN Satellite-based Earth Observation Market REPORT HIGHLIGHTS
| Aspects | Details |
|---|---|
| Study Period | 2019-2033 |
| Base Year | 2024 |
| Estimated Year | 2025 |
| Forecast Period | 2025-2033 |
| Historical Period | 2019-2024 |
| Growth Rate | CAGR of 12.59% from 2019-2033 |
| Segmentation |
|
Table of Contents
- 1. Introduction
- 1.1. Research Scope
- 1.2. Market Segmentation
- 1.3. Research Methodology
- 1.4. Definitions and Assumptions
- 2. Executive Summary
- 2.1. Introduction
- 3. Market Dynamics
- 3.1. Introduction
- 3.2. Market Drivers
- 3.2.1. Government Initiatives and Investments; Technological Advancements
- 3.3. Market Restrains
- 3.3.1. Budget Constraints and Technological Limitations; Regulatory and Legal Challenges
- 3.4. Market Trends
- 3.4.1. Government Initiatives and Investments is Driving the Market
- 4. Market Factor Analysis
- 4.1. Porters Five Forces
- 4.2. Supply/Value Chain
- 4.3. PESTEL analysis
- 4.4. Market Entropy
- 4.5. Patent/Trademark Analysis
- 5. Global ASEAN Satellite-based Earth Observation Market Analysis, Insights and Forecast, 2019-2031
- 5.1. Market Analysis, Insights and Forecast - by Type
- 5.1.1. Earth Observation Data
- 5.1.2. Value Added Services
- 5.2. Market Analysis, Insights and Forecast - by Satellite Orbit
- 5.2.1. Low Earth Orbit
- 5.2.2. Medium Earth Orbit
- 5.2.3. Geostationary Orbit
- 5.3. Market Analysis, Insights and Forecast - by End-use
- 5.3.1. Urban Development and Cultural Heritage
- 5.3.2. Agriculture
- 5.3.3. Climate Services
- 5.3.4. Energy and Raw Materials
- 5.3.5. Infrastructure
- 5.3.6. Others
- 5.4. Market Analysis, Insights and Forecast - by Region
- 5.4.1. North America
- 5.4.2. South America
- 5.4.3. Europe
- 5.4.4. Middle East & Africa
- 5.4.5. Asia Pacific
- 5.1. Market Analysis, Insights and Forecast - by Type
- 6. North America ASEAN Satellite-based Earth Observation Market Analysis, Insights and Forecast, 2019-2031
- 6.1. Market Analysis, Insights and Forecast - by Type
- 6.1.1. Earth Observation Data
- 6.1.2. Value Added Services
- 6.2. Market Analysis, Insights and Forecast - by Satellite Orbit
- 6.2.1. Low Earth Orbit
- 6.2.2. Medium Earth Orbit
- 6.2.3. Geostationary Orbit
- 6.3. Market Analysis, Insights and Forecast - by End-use
- 6.3.1. Urban Development and Cultural Heritage
- 6.3.2. Agriculture
- 6.3.3. Climate Services
- 6.3.4. Energy and Raw Materials
- 6.3.5. Infrastructure
- 6.3.6. Others
- 6.1. Market Analysis, Insights and Forecast - by Type
- 7. South America ASEAN Satellite-based Earth Observation Market Analysis, Insights and Forecast, 2019-2031
- 7.1. Market Analysis, Insights and Forecast - by Type
- 7.1.1. Earth Observation Data
- 7.1.2. Value Added Services
- 7.2. Market Analysis, Insights and Forecast - by Satellite Orbit
- 7.2.1. Low Earth Orbit
- 7.2.2. Medium Earth Orbit
- 7.2.3. Geostationary Orbit
- 7.3. Market Analysis, Insights and Forecast - by End-use
- 7.3.1. Urban Development and Cultural Heritage
- 7.3.2. Agriculture
- 7.3.3. Climate Services
- 7.3.4. Energy and Raw Materials
- 7.3.5. Infrastructure
- 7.3.6. Others
- 7.1. Market Analysis, Insights and Forecast - by Type
- 8. Europe ASEAN Satellite-based Earth Observation Market Analysis, Insights and Forecast, 2019-2031
- 8.1. Market Analysis, Insights and Forecast - by Type
- 8.1.1. Earth Observation Data
- 8.1.2. Value Added Services
- 8.2. Market Analysis, Insights and Forecast - by Satellite Orbit
- 8.2.1. Low Earth Orbit
- 8.2.2. Medium Earth Orbit
- 8.2.3. Geostationary Orbit
- 8.3. Market Analysis, Insights and Forecast - by End-use
- 8.3.1. Urban Development and Cultural Heritage
- 8.3.2. Agriculture
- 8.3.3. Climate Services
- 8.3.4. Energy and Raw Materials
- 8.3.5. Infrastructure
- 8.3.6. Others
- 8.1. Market Analysis, Insights and Forecast - by Type
- 9. Middle East & Africa ASEAN Satellite-based Earth Observation Market Analysis, Insights and Forecast, 2019-2031
- 9.1. Market Analysis, Insights and Forecast - by Type
- 9.1.1. Earth Observation Data
- 9.1.2. Value Added Services
- 9.2. Market Analysis, Insights and Forecast - by Satellite Orbit
- 9.2.1. Low Earth Orbit
- 9.2.2. Medium Earth Orbit
- 9.2.3. Geostationary Orbit
- 9.3. Market Analysis, Insights and Forecast - by End-use
- 9.3.1. Urban Development and Cultural Heritage
- 9.3.2. Agriculture
- 9.3.3. Climate Services
- 9.3.4. Energy and Raw Materials
- 9.3.5. Infrastructure
- 9.3.6. Others
- 9.1. Market Analysis, Insights and Forecast - by Type
- 10. Asia Pacific ASEAN Satellite-based Earth Observation Market Analysis, Insights and Forecast, 2019-2031
- 10.1. Market Analysis, Insights and Forecast - by Type
- 10.1.1. Earth Observation Data
- 10.1.2. Value Added Services
- 10.2. Market Analysis, Insights and Forecast - by Satellite Orbit
- 10.2.1. Low Earth Orbit
- 10.2.2. Medium Earth Orbit
- 10.2.3. Geostationary Orbit
- 10.3. Market Analysis, Insights and Forecast - by End-use
- 10.3.1. Urban Development and Cultural Heritage
- 10.3.2. Agriculture
- 10.3.3. Climate Services
- 10.3.4. Energy and Raw Materials
- 10.3.5. Infrastructure
- 10.3.6. Others
- 10.1. Market Analysis, Insights and Forecast - by Type
- 11. North America ASEAN Satellite-based Earth Observation Market Analysis, Insights and Forecast, 2019-2031
- 11.1. Market Analysis, Insights and Forecast - By Country/Sub-region
- 11.1.1.
- 12. Europe ASEAN Satellite-based Earth Observation Market Analysis, Insights and Forecast, 2019-2031
- 12.1. Market Analysis, Insights and Forecast - By Country/Sub-region
- 12.1.1.
- 13. Asia Pacific ASEAN Satellite-based Earth Observation Market Analysis, Insights and Forecast, 2019-2031
- 13.1. Market Analysis, Insights and Forecast - By Country/Sub-region
- 13.1.1.
- 14. Rest of the World ASEAN Satellite-based Earth Observation Market Analysis, Insights and Forecast, 2019-2031
- 14.1. Market Analysis, Insights and Forecast - By Country/Sub-region
- 14.1.1.
- 15. Competitive Analysis
- 15.1. Global Market Share Analysis 2024
- 15.2. Company Profiles
- 15.2.1 EOMAP Indonesia *List Not Exhaustive
- 15.2.1.1. Overview
- 15.2.1.2. Products
- 15.2.1.3. SWOT Analysis
- 15.2.1.4. Recent Developments
- 15.2.1.5. Financials (Based on Availability)
- 15.2.2 Airbus SE
- 15.2.2.1. Overview
- 15.2.2.2. Products
- 15.2.2.3. SWOT Analysis
- 15.2.2.4. Recent Developments
- 15.2.2.5. Financials (Based on Availability)
- 15.2.3 Philippine Earth Data Resource Observation Center
- 15.2.3.1. Overview
- 15.2.3.2. Products
- 15.2.3.3. SWOT Analysis
- 15.2.3.4. Recent Developments
- 15.2.3.5. Financials (Based on Availability)
- 15.2.4 Thales Group
- 15.2.4.1. Overview
- 15.2.4.2. Products
- 15.2.4.3. SWOT Analysis
- 15.2.4.4. Recent Developments
- 15.2.4.5. Financials (Based on Availability)
- 15.2.5 Maxar Technologies Inc
- 15.2.5.1. Overview
- 15.2.5.2. Products
- 15.2.5.3. SWOT Analysis
- 15.2.5.4. Recent Developments
- 15.2.5.5. Financials (Based on Availability)
- 15.2.6 Boeing Co
- 15.2.6.1. Overview
- 15.2.6.2. Products
- 15.2.6.3. SWOT Analysis
- 15.2.6.4. Recent Developments
- 15.2.6.5. Financials (Based on Availability)
- 15.2.7 NEC Corporation
- 15.2.7.1. Overview
- 15.2.7.2. Products
- 15.2.7.3. SWOT Analysis
- 15.2.7.4. Recent Developments
- 15.2.7.5. Financials (Based on Availability)
- 15.2.8 ST Engineering
- 15.2.8.1. Overview
- 15.2.8.2. Products
- 15.2.8.3. SWOT Analysis
- 15.2.8.4. Recent Developments
- 15.2.8.5. Financials (Based on Availability)
- 15.2.9 Spire Global Inc
- 15.2.9.1. Overview
- 15.2.9.2. Products
- 15.2.9.3. SWOT Analysis
- 15.2.9.4. Recent Developments
- 15.2.9.5. Financials (Based on Availability)
- 15.2.1 EOMAP Indonesia *List Not Exhaustive
List of Figures
- Figure 1: Global ASEAN Satellite-based Earth Observation Market Revenue Breakdown (Million, %) by Region 2024 & 2032
- Figure 2: North America ASEAN Satellite-based Earth Observation Market Revenue (Million), by Country 2024 & 2032
- Figure 3: North America ASEAN Satellite-based Earth Observation Market Revenue Share (%), by Country 2024 & 2032
- Figure 4: Europe ASEAN Satellite-based Earth Observation Market Revenue (Million), by Country 2024 & 2032
- Figure 5: Europe ASEAN Satellite-based Earth Observation Market Revenue Share (%), by Country 2024 & 2032
- Figure 6: Asia Pacific ASEAN Satellite-based Earth Observation Market Revenue (Million), by Country 2024 & 2032
- Figure 7: Asia Pacific ASEAN Satellite-based Earth Observation Market Revenue Share (%), by Country 2024 & 2032
- Figure 8: Rest of the World ASEAN Satellite-based Earth Observation Market Revenue (Million), by Country 2024 & 2032
- Figure 9: Rest of the World ASEAN Satellite-based Earth Observation Market Revenue Share (%), by Country 2024 & 2032
- Figure 10: North America ASEAN Satellite-based Earth Observation Market Revenue (Million), by Type 2024 & 2032
- Figure 11: North America ASEAN Satellite-based Earth Observation Market Revenue Share (%), by Type 2024 & 2032
- Figure 12: North America ASEAN Satellite-based Earth Observation Market Revenue (Million), by Satellite Orbit 2024 & 2032
- Figure 13: North America ASEAN Satellite-based Earth Observation Market Revenue Share (%), by Satellite Orbit 2024 & 2032
- Figure 14: North America ASEAN Satellite-based Earth Observation Market Revenue (Million), by End-use 2024 & 2032
- Figure 15: North America ASEAN Satellite-based Earth Observation Market Revenue Share (%), by End-use 2024 & 2032
- Figure 16: North America ASEAN Satellite-based Earth Observation Market Revenue (Million), by Country 2024 & 2032
- Figure 17: North America ASEAN Satellite-based Earth Observation Market Revenue Share (%), by Country 2024 & 2032
- Figure 18: South America ASEAN Satellite-based Earth Observation Market Revenue (Million), by Type 2024 & 2032
- Figure 19: South America ASEAN Satellite-based Earth Observation Market Revenue Share (%), by Type 2024 & 2032
- Figure 20: South America ASEAN Satellite-based Earth Observation Market Revenue (Million), by Satellite Orbit 2024 & 2032
- Figure 21: South America ASEAN Satellite-based Earth Observation Market Revenue Share (%), by Satellite Orbit 2024 & 2032
- Figure 22: South America ASEAN Satellite-based Earth Observation Market Revenue (Million), by End-use 2024 & 2032
- Figure 23: South America ASEAN Satellite-based Earth Observation Market Revenue Share (%), by End-use 2024 & 2032
- Figure 24: South America ASEAN Satellite-based Earth Observation Market Revenue (Million), by Country 2024 & 2032
- Figure 25: South America ASEAN Satellite-based Earth Observation Market Revenue Share (%), by Country 2024 & 2032
- Figure 26: Europe ASEAN Satellite-based Earth Observation Market Revenue (Million), by Type 2024 & 2032
- Figure 27: Europe ASEAN Satellite-based Earth Observation Market Revenue Share (%), by Type 2024 & 2032
- Figure 28: Europe ASEAN Satellite-based Earth Observation Market Revenue (Million), by Satellite Orbit 2024 & 2032
- Figure 29: Europe ASEAN Satellite-based Earth Observation Market Revenue Share (%), by Satellite Orbit 2024 & 2032
- Figure 30: Europe ASEAN Satellite-based Earth Observation Market Revenue (Million), by End-use 2024 & 2032
- Figure 31: Europe ASEAN Satellite-based Earth Observation Market Revenue Share (%), by End-use 2024 & 2032
- Figure 32: Europe ASEAN Satellite-based Earth Observation Market Revenue (Million), by Country 2024 & 2032
- Figure 33: Europe ASEAN Satellite-based Earth Observation Market Revenue Share (%), by Country 2024 & 2032
- Figure 34: Middle East & Africa ASEAN Satellite-based Earth Observation Market Revenue (Million), by Type 2024 & 2032
- Figure 35: Middle East & Africa ASEAN Satellite-based Earth Observation Market Revenue Share (%), by Type 2024 & 2032
- Figure 36: Middle East & Africa ASEAN Satellite-based Earth Observation Market Revenue (Million), by Satellite Orbit 2024 & 2032
- Figure 37: Middle East & Africa ASEAN Satellite-based Earth Observation Market Revenue Share (%), by Satellite Orbit 2024 & 2032
- Figure 38: Middle East & Africa ASEAN Satellite-based Earth Observation Market Revenue (Million), by End-use 2024 & 2032
- Figure 39: Middle East & Africa ASEAN Satellite-based Earth Observation Market Revenue Share (%), by End-use 2024 & 2032
- Figure 40: Middle East & Africa ASEAN Satellite-based Earth Observation Market Revenue (Million), by Country 2024 & 2032
- Figure 41: Middle East & Africa ASEAN Satellite-based Earth Observation Market Revenue Share (%), by Country 2024 & 2032
- Figure 42: Asia Pacific ASEAN Satellite-based Earth Observation Market Revenue (Million), by Type 2024 & 2032
- Figure 43: Asia Pacific ASEAN Satellite-based Earth Observation Market Revenue Share (%), by Type 2024 & 2032
- Figure 44: Asia Pacific ASEAN Satellite-based Earth Observation Market Revenue (Million), by Satellite Orbit 2024 & 2032
- Figure 45: Asia Pacific ASEAN Satellite-based Earth Observation Market Revenue Share (%), by Satellite Orbit 2024 & 2032
- Figure 46: Asia Pacific ASEAN Satellite-based Earth Observation Market Revenue (Million), by End-use 2024 & 2032
- Figure 47: Asia Pacific ASEAN Satellite-based Earth Observation Market Revenue Share (%), by End-use 2024 & 2032
- Figure 48: Asia Pacific ASEAN Satellite-based Earth Observation Market Revenue (Million), by Country 2024 & 2032
- Figure 49: Asia Pacific ASEAN Satellite-based Earth Observation Market Revenue Share (%), by Country 2024 & 2032
List of Tables
- Table 1: Global ASEAN Satellite-based Earth Observation Market Revenue Million Forecast, by Region 2019 & 2032
- Table 2: Global ASEAN Satellite-based Earth Observation Market Revenue Million Forecast, by Type 2019 & 2032
- Table 3: Global ASEAN Satellite-based Earth Observation Market Revenue Million Forecast, by Satellite Orbit 2019 & 2032
- Table 4: Global ASEAN Satellite-based Earth Observation Market Revenue Million Forecast, by End-use 2019 & 2032
- Table 5: Global ASEAN Satellite-based Earth Observation Market Revenue Million Forecast, by Region 2019 & 2032
- Table 6: Global ASEAN Satellite-based Earth Observation Market Revenue Million Forecast, by Country 2019 & 2032
- Table 7: ASEAN Satellite-based Earth Observation Market Revenue (Million) Forecast, by Application 2019 & 2032
- Table 8: Global ASEAN Satellite-based Earth Observation Market Revenue Million Forecast, by Country 2019 & 2032
- Table 9: ASEAN Satellite-based Earth Observation Market Revenue (Million) Forecast, by Application 2019 & 2032
- Table 10: Global ASEAN Satellite-based Earth Observation Market Revenue Million Forecast, by Country 2019 & 2032
- Table 11: ASEAN Satellite-based Earth Observation Market Revenue (Million) Forecast, by Application 2019 & 2032
- Table 12: Global ASEAN Satellite-based Earth Observation Market Revenue Million Forecast, by Country 2019 & 2032
- Table 13: ASEAN Satellite-based Earth Observation Market Revenue (Million) Forecast, by Application 2019 & 2032
- Table 14: Global ASEAN Satellite-based Earth Observation Market Revenue Million Forecast, by Type 2019 & 2032
- Table 15: Global ASEAN Satellite-based Earth Observation Market Revenue Million Forecast, by Satellite Orbit 2019 & 2032
- Table 16: Global ASEAN Satellite-based Earth Observation Market Revenue Million Forecast, by End-use 2019 & 2032
- Table 17: Global ASEAN Satellite-based Earth Observation Market Revenue Million Forecast, by Country 2019 & 2032
- Table 18: United States ASEAN Satellite-based Earth Observation Market Revenue (Million) Forecast, by Application 2019 & 2032
- Table 19: Canada ASEAN Satellite-based Earth Observation Market Revenue (Million) Forecast, by Application 2019 & 2032
- Table 20: Mexico ASEAN Satellite-based Earth Observation Market Revenue (Million) Forecast, by Application 2019 & 2032
- Table 21: Global ASEAN Satellite-based Earth Observation Market Revenue Million Forecast, by Type 2019 & 2032
- Table 22: Global ASEAN Satellite-based Earth Observation Market Revenue Million Forecast, by Satellite Orbit 2019 & 2032
- Table 23: Global ASEAN Satellite-based Earth Observation Market Revenue Million Forecast, by End-use 2019 & 2032
- Table 24: Global ASEAN Satellite-based Earth Observation Market Revenue Million Forecast, by Country 2019 & 2032
- Table 25: Brazil ASEAN Satellite-based Earth Observation Market Revenue (Million) Forecast, by Application 2019 & 2032
- Table 26: Argentina ASEAN Satellite-based Earth Observation Market Revenue (Million) Forecast, by Application 2019 & 2032
- Table 27: Rest of South America ASEAN Satellite-based Earth Observation Market Revenue (Million) Forecast, by Application 2019 & 2032
- Table 28: Global ASEAN Satellite-based Earth Observation Market Revenue Million Forecast, by Type 2019 & 2032
- Table 29: Global ASEAN Satellite-based Earth Observation Market Revenue Million Forecast, by Satellite Orbit 2019 & 2032
- Table 30: Global ASEAN Satellite-based Earth Observation Market Revenue Million Forecast, by End-use 2019 & 2032
- Table 31: Global ASEAN Satellite-based Earth Observation Market Revenue Million Forecast, by Country 2019 & 2032
- Table 32: United Kingdom ASEAN Satellite-based Earth Observation Market Revenue (Million) Forecast, by Application 2019 & 2032
- Table 33: Germany ASEAN Satellite-based Earth Observation Market Revenue (Million) Forecast, by Application 2019 & 2032
- Table 34: France ASEAN Satellite-based Earth Observation Market Revenue (Million) Forecast, by Application 2019 & 2032
- Table 35: Italy ASEAN Satellite-based Earth Observation Market Revenue (Million) Forecast, by Application 2019 & 2032
- Table 36: Spain ASEAN Satellite-based Earth Observation Market Revenue (Million) Forecast, by Application 2019 & 2032
- Table 37: Russia ASEAN Satellite-based Earth Observation Market Revenue (Million) Forecast, by Application 2019 & 2032
- Table 38: Benelux ASEAN Satellite-based Earth Observation Market Revenue (Million) Forecast, by Application 2019 & 2032
- Table 39: Nordics ASEAN Satellite-based Earth Observation Market Revenue (Million) Forecast, by Application 2019 & 2032
- Table 40: Rest of Europe ASEAN Satellite-based Earth Observation Market Revenue (Million) Forecast, by Application 2019 & 2032
- Table 41: Global ASEAN Satellite-based Earth Observation Market Revenue Million Forecast, by Type 2019 & 2032
- Table 42: Global ASEAN Satellite-based Earth Observation Market Revenue Million Forecast, by Satellite Orbit 2019 & 2032
- Table 43: Global ASEAN Satellite-based Earth Observation Market Revenue Million Forecast, by End-use 2019 & 2032
- Table 44: Global ASEAN Satellite-based Earth Observation Market Revenue Million Forecast, by Country 2019 & 2032
- Table 45: Turkey ASEAN Satellite-based Earth Observation Market Revenue (Million) Forecast, by Application 2019 & 2032
- Table 46: Israel ASEAN Satellite-based Earth Observation Market Revenue (Million) Forecast, by Application 2019 & 2032
- Table 47: GCC ASEAN Satellite-based Earth Observation Market Revenue (Million) Forecast, by Application 2019 & 2032
- Table 48: North Africa ASEAN Satellite-based Earth Observation Market Revenue (Million) Forecast, by Application 2019 & 2032
- Table 49: South Africa ASEAN Satellite-based Earth Observation Market Revenue (Million) Forecast, by Application 2019 & 2032
- Table 50: Rest of Middle East & Africa ASEAN Satellite-based Earth Observation Market Revenue (Million) Forecast, by Application 2019 & 2032
- Table 51: Global ASEAN Satellite-based Earth Observation Market Revenue Million Forecast, by Type 2019 & 2032
- Table 52: Global ASEAN Satellite-based Earth Observation Market Revenue Million Forecast, by Satellite Orbit 2019 & 2032
- Table 53: Global ASEAN Satellite-based Earth Observation Market Revenue Million Forecast, by End-use 2019 & 2032
- Table 54: Global ASEAN Satellite-based Earth Observation Market Revenue Million Forecast, by Country 2019 & 2032
- Table 55: China ASEAN Satellite-based Earth Observation Market Revenue (Million) Forecast, by Application 2019 & 2032
- Table 56: India ASEAN Satellite-based Earth Observation Market Revenue (Million) Forecast, by Application 2019 & 2032
- Table 57: Japan ASEAN Satellite-based Earth Observation Market Revenue (Million) Forecast, by Application 2019 & 2032
- Table 58: South Korea ASEAN Satellite-based Earth Observation Market Revenue (Million) Forecast, by Application 2019 & 2032
- Table 59: ASEAN ASEAN Satellite-based Earth Observation Market Revenue (Million) Forecast, by Application 2019 & 2032
- Table 60: Oceania ASEAN Satellite-based Earth Observation Market Revenue (Million) Forecast, by Application 2019 & 2032
- Table 61: Rest of Asia Pacific ASEAN Satellite-based Earth Observation Market Revenue (Million) Forecast, by Application 2019 & 2032
Frequently Asked Questions
1. What is the projected Compound Annual Growth Rate (CAGR) of the ASEAN Satellite-based Earth Observation Market?
The projected CAGR is approximately 12.59%.
2. Which companies are prominent players in the ASEAN Satellite-based Earth Observation Market?
Key companies in the market include EOMAP Indonesia *List Not Exhaustive, Airbus SE, Philippine Earth Data Resource Observation Center, Thales Group, Maxar Technologies Inc, Boeing Co, NEC Corporation, ST Engineering, Spire Global Inc.
3. What are the main segments of the ASEAN Satellite-based Earth Observation Market?
The market segments include Type, Satellite Orbit, End-use.
4. Can you provide details about the market size?
The market size is estimated to be USD 0.2 Million as of 2022.
5. What are some drivers contributing to market growth?
Government Initiatives and Investments; Technological Advancements.
6. What are the notable trends driving market growth?
Government Initiatives and Investments is Driving the Market.
7. Are there any restraints impacting market growth?
Budget Constraints and Technological Limitations; Regulatory and Legal Challenges.
8. Can you provide examples of recent developments in the market?
February 2023: An MOU was formed to establish an international space collaboration between the Geo-Informatics and Space Technology Development Agency (GISTDA) of Thailand and the Office for Space Technology & Industry, Singapore (OSTIn) to develop a framework for close collaboration on Earth observation (EO) applications between the two countries of the ASEAN region, which would create an opportunity for the market vendors.
9. What pricing options are available for accessing the report?
Pricing options include single-user, multi-user, and enterprise licenses priced at USD 3800, USD 4500, and USD 5800 respectively.
10. Is the market size provided in terms of value or volume?
The market size is provided in terms of value, measured in Million.
11. Are there any specific market keywords associated with the report?
Yes, the market keyword associated with the report is "ASEAN Satellite-based Earth Observation Market," which aids in identifying and referencing the specific market segment covered.
12. How do I determine which pricing option suits my needs best?
The pricing options vary based on user requirements and access needs. Individual users may opt for single-user licenses, while businesses requiring broader access may choose multi-user or enterprise licenses for cost-effective access to the report.
13. Are there any additional resources or data provided in the ASEAN Satellite-based Earth Observation Market report?
While the report offers comprehensive insights, it's advisable to review the specific contents or supplementary materials provided to ascertain if additional resources or data are available.
14. How can I stay updated on further developments or reports in the ASEAN Satellite-based Earth Observation Market?
To stay informed about further developments, trends, and reports in the ASEAN Satellite-based Earth Observation Market, consider subscribing to industry newsletters, following relevant companies and organizations, or regularly checking reputable industry news sources and publications.
Methodology
Step 1 - Identification of Relevant Samples Size from Population Database


Step 2 - Approaches for Defining Global Market Size (Value, Volume* & Price*)

Note*: In applicable scenarios
Step 3 - Data Sources
Primary Research
- Web Analytics
- Survey Reports
- Research Institute
- Latest Research Reports
- Opinion Leaders
Secondary Research
- Annual Reports
- White Paper
- Latest Press Release
- Industry Association
- Paid Database
- Investor Presentations

Step 4 - Data Triangulation
Involves using different sources of information in order to increase the validity of a study
These sources are likely to be stakeholders in a program - participants, other researchers, program staff, other community members, and so on.
Then we put all data in single framework & apply various statistical tools to find out the dynamic on the market.
During the analysis stage, feedback from the stakeholder groups would be compared to determine areas of agreement as well as areas of divergence


