
Key Insights
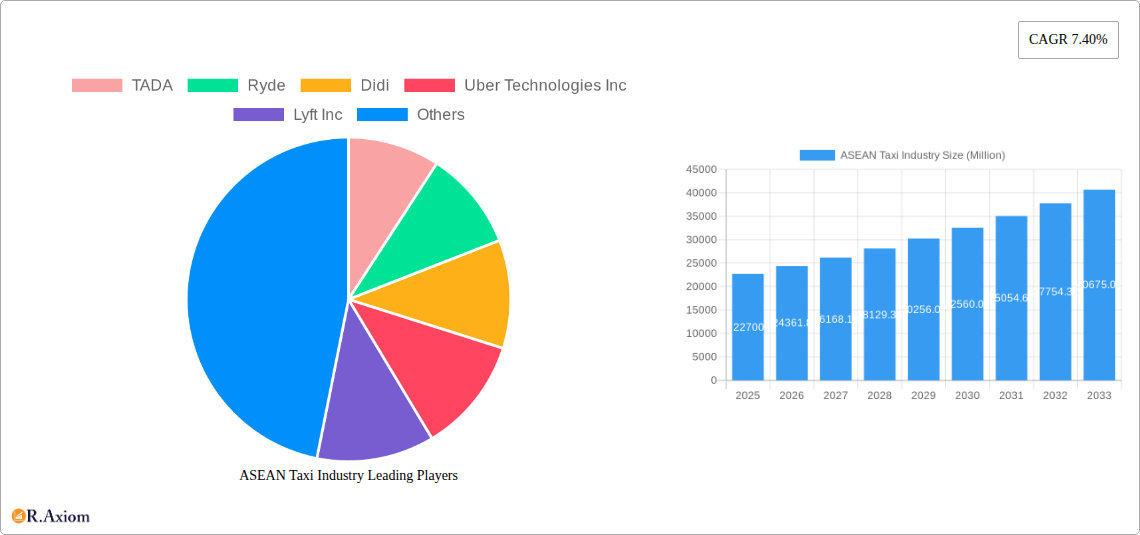
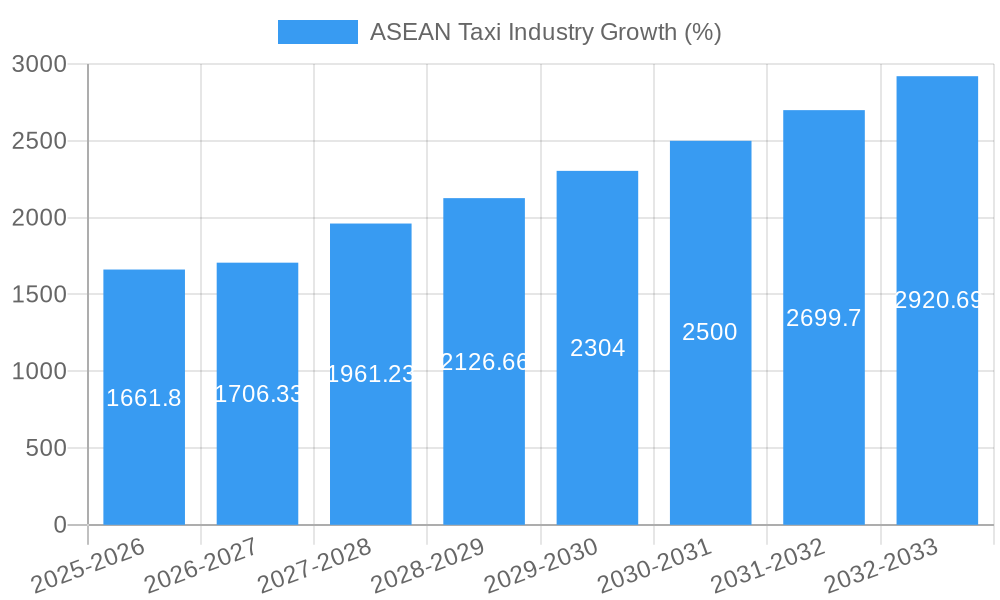
The ASEAN taxi industry, valued at $22.70 billion in 2025, is experiencing robust growth, projected to expand at a compound annual growth rate (CAGR) of 7.40% from 2025 to 2033. This expansion is fueled by several key factors. The increasing urbanization and rising middle class across the region are driving demand for convenient and affordable transportation options. Technological advancements, particularly in ride-hailing apps like Grab and Gojek, have significantly improved accessibility and efficiency, further stimulating market growth. Furthermore, government initiatives aimed at improving public transportation infrastructure and promoting digital adoption are contributing positively to the industry's trajectory. Competition among established players like Grab, Gojek, and Uber, alongside emerging local companies, is driving innovation and enhancing service quality. However, challenges remain, including regulatory hurdles in some countries, fluctuating fuel prices, and the need for continuous improvement in driver safety and training.
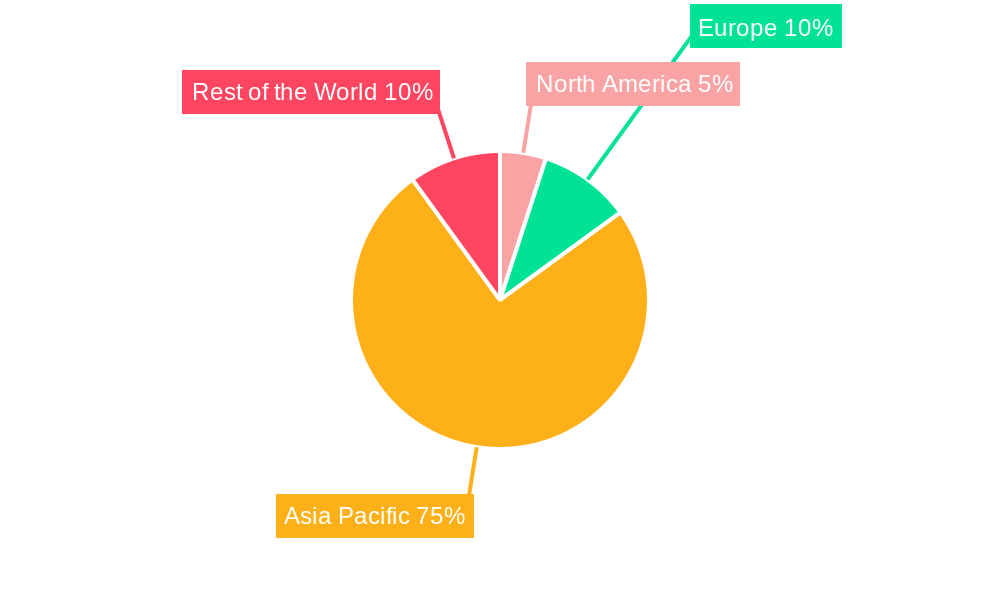
The segmentation of the ASEAN taxi market reveals significant variations across countries and service types. While the Philippines, Malaysia, Thailand, and Singapore represent major markets, the “Rest of ASEAN” segment also exhibits substantial growth potential. Online bookings are increasingly dominant over offline methods, reflecting the growing reliance on mobile technology. Motorcycles remain a significant mode of transportation in certain regions, coexisting with cars and other vehicles. Ride-hailing services have captured a substantial market share, showcasing the transformative impact of the digital economy on transportation. The forecast period (2025-2033) promises sustained growth, driven by continued technological innovation, evolving consumer preferences, and the ongoing expansion of the regional economy. Analyzing this multifaceted market requires a nuanced understanding of the interplay between these factors to accurately predict future market trends.
This comprehensive report provides a detailed analysis of the ASEAN taxi industry, encompassing market size, segmentation, key players, growth drivers, and future outlook. The study period covers 2019-2033, with 2025 as the base and estimated year. The forecast period spans 2025-2033, while the historical period analyzed is 2019-2024. This report is invaluable for industry stakeholders, investors, and anyone seeking a deep understanding of this dynamic market. Millions (M) are used for all values.
ASEAN Taxi Industry Market Concentration & Innovation
This section analyzes the competitive landscape of the ASEAN taxi industry, examining market concentration, innovation drivers, regulatory frameworks, and M&A activities. The industry is characterized by a mix of established players and emerging entrants, resulting in a dynamic competitive environment.
Market Concentration: Grab Holdings Inc. holds a significant market share, estimated at xxM in 2025, followed by Gojek (xxM) and Uber Technologies Inc. (xxM). The remaining market share is distributed among regional and local players.
Innovation Drivers: Technological advancements, such as ride-hailing apps and GPS integration, have revolutionized the taxi industry. Furthermore, the rise of electric vehicles and autonomous driving technologies are driving further innovation.
Regulatory Frameworks: Varying regulations across ASEAN countries significantly impact market dynamics. Some countries have stricter regulations regarding licensing and pricing, while others have embraced a more liberal approach.
Product Substitutes: Public transportation systems, private car ownership, and motorcycle taxis pose significant competition, particularly in densely populated urban areas.
End-User Trends: Growing urban populations, increasing disposable incomes, and changing consumer preferences towards convenience and affordability are driving market growth.
M&A Activities: The ASEAN taxi industry has witnessed several significant mergers and acquisitions (M&A) deals in recent years. For example, Grab's acquisitions of local players have strengthened its market dominance. The total M&A deal value during the historical period is estimated at xxM.
ASEAN Taxi Industry Industry Trends & Insights
This section explores key trends and insights shaping the ASEAN taxi industry. The market is experiencing significant growth fueled by technological advancements, changing consumer preferences, and evolving business models.
The ASEAN taxi industry is exhibiting a Compound Annual Growth Rate (CAGR) of xx% during the forecast period (2025-2033). Market penetration for online booking systems is steadily rising, exceeding xx% in several key markets by 2025. Technological disruptions, such as the introduction of ride-hailing apps, have significantly impacted the industry, transforming how consumers access taxi services. Consumer preferences are shifting towards convenient, affordable, and technology-enabled options. Competitive dynamics remain fierce, with established players vying for market share against emerging competitors. The market size in 2025 is estimated at xxM, projected to reach xxM by 2033.
Dominant Markets & Segments in ASEAN Taxi Industry
This section identifies the dominant markets and segments within the ASEAN taxi industry. The analysis considers factors such as economic policies, infrastructure development, and consumer demand.
Dominant Country: Indonesia is expected to be the leading market in terms of market size and growth, due to its large population and rapidly expanding middle class. Singapore demonstrates high per-capita usage.
Dominant Booking Type: Online booking is the dominant segment, experiencing significantly faster growth compared to offline bookings due to the convenience and features offered by ride-hailing apps.
Dominant Vehicle Type: Cars dominate the market in most countries. However, motorcycles are significantly important in several ASEAN nations, particularly for short-distance commutes.
Dominant Service Type: Ride-hailing accounts for the largest segment share, given the popularity and accessibility of ride-hailing apps and the convenience they offer.
Key Drivers:
- Economic Growth: Strong economic growth in many ASEAN countries drives increasing disposable incomes and consumer spending, thus boosting demand for taxi services.
- Infrastructure Development: Investments in transportation infrastructure, such as improved roads and public transit, create better conditions for the taxi industry.
- Government Policies: Supportive government policies that encourage innovation and competition help create a thriving taxi industry ecosystem.
ASEAN Taxi Industry Product Developments
The ASEAN taxi industry is witnessing a continuous evolution in product offerings driven by technological advancements. Ride-hailing apps offer features like fare estimates, cashless payments, and real-time tracking, enhancing user experience. The integration of electric vehicles (EVs) and efforts to promote sustainability are also shaping product offerings. These developments cater to consumer preferences for convenience, affordability, and environmental responsibility. The introduction of premium ride options and specialized services such as carpooling is contributing to market diversification.
Report Scope & Segmentation Analysis
This report segments the ASEAN taxi industry based on the following criteria:
Country: Philippines, Malaysia, Thailand, Singapore, Rest of ASEAN. Each country has its unique market dynamics based on regulations, demographics and competitive landscapes. Growth projections vary accordingly, with higher projected growth rates in countries with stronger economic growth and larger populations.
Booking Type: Online and Offline. Online bookings are projected to maintain faster growth and increased market share, due to the adoption of smartphones and the convenience provided by app-based ride-hailing services.
Vehicle Type: Motorcycles, Cars, Other Vehicle Types (e.g., vans, MPVs). The market share for each vehicle type varies by country depending on consumer preferences and infrastructure conditions.
Service Type: Ride-hailing and Ride-sharing. Ride-hailing is projected to maintain its dominance driven by individual users' convenience, while ride-sharing is expected to see growth particularly in areas with high congestion.
Key Drivers of ASEAN Taxi Industry Growth
The growth of the ASEAN taxi industry is driven by several key factors:
- Rapid Urbanization: The increasing concentration of population in urban centers fuels the demand for convenient and efficient transportation solutions.
- Rising Middle Class: The expanding middle class has increased disposable incomes, leading to higher spending on transportation services.
- Technological Advancements: Smartphone penetration, GPS technology, and the emergence of ride-hailing apps have transformed the industry, driving both convenience and efficiency.
- Government Support: Supportive government policies promoting technological innovation and competition encourage the growth of the taxi industry.
Challenges in the ASEAN Taxi Industry Sector
The ASEAN taxi industry faces several challenges:
- Regulatory Hurdles: Inconsistencies in regulations across different countries create complexities for operators.
- Intense Competition: The market is highly competitive, with established players and new entrants vying for market share, resulting in potential price wars.
- Infrastructure Limitations: Inadequate infrastructure in some areas poses operational challenges and limits service expansion.
- Driver Shortages: In some areas, a shortage of drivers can limit service availability.
Emerging Opportunities in ASEAN Taxi Industry
The ASEAN taxi industry presents several emerging opportunities:
- Expansion into Underserved Areas: Extending services to rural and underserved areas can tap into substantial untapped demand.
- Technological Innovation: Exploring new technologies such as autonomous vehicles and EV integration offers significant growth potential.
- Specialized Services: Catering to niche market segments through services such as airport transfers or premium ride options can increase revenue streams.
Leading Players in the ASEAN Taxi Industry Market
- Grab Holdings Inc.
- PT Gojek
- Uber Technologies Inc
- Lyft Inc
- TADA
- Ryde
- Didi
- Public Cab Sdn Bhd
- Blue Cab Malaysia
Key Developments in ASEAN Taxi Industry Industry
- 2022 Q4: Grab Holdings Inc. launched a new electric vehicle initiative in Singapore.
- 2023 Q1: Gojek partnered with a local EV manufacturer to expand its fleet of electric vehicles in Indonesia.
- 2023 Q2: New ride-sharing regulations were implemented in Thailand, impacting market dynamics. (Further specific examples needed)
Strategic Outlook for ASEAN Taxi Industry Market
The ASEAN taxi industry holds significant growth potential driven by urbanization, technological advancements, and rising disposable incomes. Expanding into underserved markets, embracing sustainable technologies, and creating specialized services are key strategies for capturing future market share. The industry is projected to witness continuous innovation and consolidation, with established players further consolidating their dominance while new players enter with unique value propositions. The integration of technology will be paramount for achieving efficiency and driving growth in the coming decade.
ASEAN Taxi Industry Segmentation
-
1. Booking Type
- 1.1. Online
- 1.2. Offline
-
2. Vehicle Type
- 2.1. Motorcycles
- 2.2. Cars
- 2.3. Other Vehicle Types
-
3. Service Type
- 3.1. Ride Hailing
- 3.2. Ride Sharing
ASEAN Taxi Industry Segmentation By Geography
-
1. North America
- 1.1. United States
- 1.2. Canada
- 1.3. Mexico
-
2. South America
- 2.1. Brazil
- 2.2. Argentina
- 2.3. Rest of South America
-
3. Europe
- 3.1. United Kingdom
- 3.2. Germany
- 3.3. France
- 3.4. Italy
- 3.5. Spain
- 3.6. Russia
- 3.7. Benelux
- 3.8. Nordics
- 3.9. Rest of Europe
-
4. Middle East & Africa
- 4.1. Turkey
- 4.2. Israel
- 4.3. GCC
- 4.4. North Africa
- 4.5. South Africa
- 4.6. Rest of Middle East & Africa
-
5. Asia Pacific
- 5.1. China
- 5.2. India
- 5.3. Japan
- 5.4. South Korea
- 5.5. ASEAN
- 5.6. Oceania
- 5.7. Rest of Asia Pacific
ASEAN Taxi Industry REPORT HIGHLIGHTS
| Aspects | Details |
|---|---|
| Study Period | 2019-2033 |
| Base Year | 2024 |
| Estimated Year | 2025 |
| Forecast Period | 2025-2033 |
| Historical Period | 2019-2024 |
| Growth Rate | CAGR of 7.40% from 2019-2033 |
| Segmentation |
|
Table of Contents
- 1. Introduction
- 1.1. Research Scope
- 1.2. Market Segmentation
- 1.3. Research Methodology
- 1.4. Definitions and Assumptions
- 2. Executive Summary
- 2.1. Introduction
- 3. Market Dynamics
- 3.1. Introduction
- 3.2. Market Drivers
- 3.2.1. Increasing Demand From Online Channel
- 3.3. Market Restrains
- 3.3.1. Increasing Traffic Problems And Reliability Issues
- 3.4. Market Trends
- 3.4.1. Increasing Penetration of Online Channels for Booking Taxis
- 4. Market Factor Analysis
- 4.1. Porters Five Forces
- 4.2. Supply/Value Chain
- 4.3. PESTEL analysis
- 4.4. Market Entropy
- 4.5. Patent/Trademark Analysis
- 5. Global ASEAN Taxi Industry Analysis, Insights and Forecast, 2019-2031
- 5.1. Market Analysis, Insights and Forecast - by Booking Type
- 5.1.1. Online
- 5.1.2. Offline
- 5.2. Market Analysis, Insights and Forecast - by Vehicle Type
- 5.2.1. Motorcycles
- 5.2.2. Cars
- 5.2.3. Other Vehicle Types
- 5.3. Market Analysis, Insights and Forecast - by Service Type
- 5.3.1. Ride Hailing
- 5.3.2. Ride Sharing
- 5.4. Market Analysis, Insights and Forecast - by Region
- 5.4.1. North America
- 5.4.2. South America
- 5.4.3. Europe
- 5.4.4. Middle East & Africa
- 5.4.5. Asia Pacific
- 5.1. Market Analysis, Insights and Forecast - by Booking Type
- 6. North America ASEAN Taxi Industry Analysis, Insights and Forecast, 2019-2031
- 6.1. Market Analysis, Insights and Forecast - by Booking Type
- 6.1.1. Online
- 6.1.2. Offline
- 6.2. Market Analysis, Insights and Forecast - by Vehicle Type
- 6.2.1. Motorcycles
- 6.2.2. Cars
- 6.2.3. Other Vehicle Types
- 6.3. Market Analysis, Insights and Forecast - by Service Type
- 6.3.1. Ride Hailing
- 6.3.2. Ride Sharing
- 6.1. Market Analysis, Insights and Forecast - by Booking Type
- 7. South America ASEAN Taxi Industry Analysis, Insights and Forecast, 2019-2031
- 7.1. Market Analysis, Insights and Forecast - by Booking Type
- 7.1.1. Online
- 7.1.2. Offline
- 7.2. Market Analysis, Insights and Forecast - by Vehicle Type
- 7.2.1. Motorcycles
- 7.2.2. Cars
- 7.2.3. Other Vehicle Types
- 7.3. Market Analysis, Insights and Forecast - by Service Type
- 7.3.1. Ride Hailing
- 7.3.2. Ride Sharing
- 7.1. Market Analysis, Insights and Forecast - by Booking Type
- 8. Europe ASEAN Taxi Industry Analysis, Insights and Forecast, 2019-2031
- 8.1. Market Analysis, Insights and Forecast - by Booking Type
- 8.1.1. Online
- 8.1.2. Offline
- 8.2. Market Analysis, Insights and Forecast - by Vehicle Type
- 8.2.1. Motorcycles
- 8.2.2. Cars
- 8.2.3. Other Vehicle Types
- 8.3. Market Analysis, Insights and Forecast - by Service Type
- 8.3.1. Ride Hailing
- 8.3.2. Ride Sharing
- 8.1. Market Analysis, Insights and Forecast - by Booking Type
- 9. Middle East & Africa ASEAN Taxi Industry Analysis, Insights and Forecast, 2019-2031
- 9.1. Market Analysis, Insights and Forecast - by Booking Type
- 9.1.1. Online
- 9.1.2. Offline
- 9.2. Market Analysis, Insights and Forecast - by Vehicle Type
- 9.2.1. Motorcycles
- 9.2.2. Cars
- 9.2.3. Other Vehicle Types
- 9.3. Market Analysis, Insights and Forecast - by Service Type
- 9.3.1. Ride Hailing
- 9.3.2. Ride Sharing
- 9.1. Market Analysis, Insights and Forecast - by Booking Type
- 10. Asia Pacific ASEAN Taxi Industry Analysis, Insights and Forecast, 2019-2031
- 10.1. Market Analysis, Insights and Forecast - by Booking Type
- 10.1.1. Online
- 10.1.2. Offline
- 10.2. Market Analysis, Insights and Forecast - by Vehicle Type
- 10.2.1. Motorcycles
- 10.2.2. Cars
- 10.2.3. Other Vehicle Types
- 10.3. Market Analysis, Insights and Forecast - by Service Type
- 10.3.1. Ride Hailing
- 10.3.2. Ride Sharing
- 10.1. Market Analysis, Insights and Forecast - by Booking Type
- 11. North America ASEAN Taxi Industry Analysis, Insights and Forecast, 2019-2031
- 11.1. Market Analysis, Insights and Forecast - By Country/Sub-region
- 11.1.1 United States
- 11.1.2 Canada
- 11.1.3 Rest of North America
- 12. Europe ASEAN Taxi Industry Analysis, Insights and Forecast, 2019-2031
- 12.1. Market Analysis, Insights and Forecast - By Country/Sub-region
- 12.1.1 Germany
- 12.1.2 United Kingdom
- 12.1.3 France
- 12.1.4 Italy
- 12.1.5 Rest of Europe
- 13. Asia Pacific ASEAN Taxi Industry Analysis, Insights and Forecast, 2019-2031
- 13.1. Market Analysis, Insights and Forecast - By Country/Sub-region
- 13.1.1 China
- 13.1.2 Japan
- 13.1.3 India
- 13.1.4 South Korea
- 13.1.5 Rest of Asia Pacific
- 14. Rest of the World ASEAN Taxi Industry Analysis, Insights and Forecast, 2019-2031
- 14.1. Market Analysis, Insights and Forecast - By Country/Sub-region
- 14.1.1 Brazil
- 14.1.2 South Africa
- 14.1.3 United Arab Emirates
- 14.1.4 Other Countries
- 15. Competitive Analysis
- 15.1. Global Market Share Analysis 2024
- 15.2. Company Profiles
- 15.2.1 TADA
- 15.2.1.1. Overview
- 15.2.1.2. Products
- 15.2.1.3. SWOT Analysis
- 15.2.1.4. Recent Developments
- 15.2.1.5. Financials (Based on Availability)
- 15.2.2 Ryde
- 15.2.2.1. Overview
- 15.2.2.2. Products
- 15.2.2.3. SWOT Analysis
- 15.2.2.4. Recent Developments
- 15.2.2.5. Financials (Based on Availability)
- 15.2.3 Didi
- 15.2.3.1. Overview
- 15.2.3.2. Products
- 15.2.3.3. SWOT Analysis
- 15.2.3.4. Recent Developments
- 15.2.3.5. Financials (Based on Availability)
- 15.2.4 Uber Technologies Inc
- 15.2.4.1. Overview
- 15.2.4.2. Products
- 15.2.4.3. SWOT Analysis
- 15.2.4.4. Recent Developments
- 15.2.4.5. Financials (Based on Availability)
- 15.2.5 Lyft Inc
- 15.2.5.1. Overview
- 15.2.5.2. Products
- 15.2.5.3. SWOT Analysis
- 15.2.5.4. Recent Developments
- 15.2.5.5. Financials (Based on Availability)
- 15.2.6 Public Cab Sdn Bhd
- 15.2.6.1. Overview
- 15.2.6.2. Products
- 15.2.6.3. SWOT Analysis
- 15.2.6.4. Recent Developments
- 15.2.6.5. Financials (Based on Availability)
- 15.2.7 PT Gojek
- 15.2.7.1. Overview
- 15.2.7.2. Products
- 15.2.7.3. SWOT Analysis
- 15.2.7.4. Recent Developments
- 15.2.7.5. Financials (Based on Availability)
- 15.2.8 Blue Cab Malaysi
- 15.2.8.1. Overview
- 15.2.8.2. Products
- 15.2.8.3. SWOT Analysis
- 15.2.8.4. Recent Developments
- 15.2.8.5. Financials (Based on Availability)
- 15.2.9 Grab Holdings Inc
- 15.2.9.1. Overview
- 15.2.9.2. Products
- 15.2.9.3. SWOT Analysis
- 15.2.9.4. Recent Developments
- 15.2.9.5. Financials (Based on Availability)
- 15.2.1 TADA
List of Figures
- Figure 1: Global ASEAN Taxi Industry Revenue Breakdown (Million, %) by Region 2024 & 2032
- Figure 2: North America ASEAN Taxi Industry Revenue (Million), by Country 2024 & 2032
- Figure 3: North America ASEAN Taxi Industry Revenue Share (%), by Country 2024 & 2032
- Figure 4: Europe ASEAN Taxi Industry Revenue (Million), by Country 2024 & 2032
- Figure 5: Europe ASEAN Taxi Industry Revenue Share (%), by Country 2024 & 2032
- Figure 6: Asia Pacific ASEAN Taxi Industry Revenue (Million), by Country 2024 & 2032
- Figure 7: Asia Pacific ASEAN Taxi Industry Revenue Share (%), by Country 2024 & 2032
- Figure 8: Rest of the World ASEAN Taxi Industry Revenue (Million), by Country 2024 & 2032
- Figure 9: Rest of the World ASEAN Taxi Industry Revenue Share (%), by Country 2024 & 2032
- Figure 10: North America ASEAN Taxi Industry Revenue (Million), by Booking Type 2024 & 2032
- Figure 11: North America ASEAN Taxi Industry Revenue Share (%), by Booking Type 2024 & 2032
- Figure 12: North America ASEAN Taxi Industry Revenue (Million), by Vehicle Type 2024 & 2032
- Figure 13: North America ASEAN Taxi Industry Revenue Share (%), by Vehicle Type 2024 & 2032
- Figure 14: North America ASEAN Taxi Industry Revenue (Million), by Service Type 2024 & 2032
- Figure 15: North America ASEAN Taxi Industry Revenue Share (%), by Service Type 2024 & 2032
- Figure 16: North America ASEAN Taxi Industry Revenue (Million), by Country 2024 & 2032
- Figure 17: North America ASEAN Taxi Industry Revenue Share (%), by Country 2024 & 2032
- Figure 18: South America ASEAN Taxi Industry Revenue (Million), by Booking Type 2024 & 2032
- Figure 19: South America ASEAN Taxi Industry Revenue Share (%), by Booking Type 2024 & 2032
- Figure 20: South America ASEAN Taxi Industry Revenue (Million), by Vehicle Type 2024 & 2032
- Figure 21: South America ASEAN Taxi Industry Revenue Share (%), by Vehicle Type 2024 & 2032
- Figure 22: South America ASEAN Taxi Industry Revenue (Million), by Service Type 2024 & 2032
- Figure 23: South America ASEAN Taxi Industry Revenue Share (%), by Service Type 2024 & 2032
- Figure 24: South America ASEAN Taxi Industry Revenue (Million), by Country 2024 & 2032
- Figure 25: South America ASEAN Taxi Industry Revenue Share (%), by Country 2024 & 2032
- Figure 26: Europe ASEAN Taxi Industry Revenue (Million), by Booking Type 2024 & 2032
- Figure 27: Europe ASEAN Taxi Industry Revenue Share (%), by Booking Type 2024 & 2032
- Figure 28: Europe ASEAN Taxi Industry Revenue (Million), by Vehicle Type 2024 & 2032
- Figure 29: Europe ASEAN Taxi Industry Revenue Share (%), by Vehicle Type 2024 & 2032
- Figure 30: Europe ASEAN Taxi Industry Revenue (Million), by Service Type 2024 & 2032
- Figure 31: Europe ASEAN Taxi Industry Revenue Share (%), by Service Type 2024 & 2032
- Figure 32: Europe ASEAN Taxi Industry Revenue (Million), by Country 2024 & 2032
- Figure 33: Europe ASEAN Taxi Industry Revenue Share (%), by Country 2024 & 2032
- Figure 34: Middle East & Africa ASEAN Taxi Industry Revenue (Million), by Booking Type 2024 & 2032
- Figure 35: Middle East & Africa ASEAN Taxi Industry Revenue Share (%), by Booking Type 2024 & 2032
- Figure 36: Middle East & Africa ASEAN Taxi Industry Revenue (Million), by Vehicle Type 2024 & 2032
- Figure 37: Middle East & Africa ASEAN Taxi Industry Revenue Share (%), by Vehicle Type 2024 & 2032
- Figure 38: Middle East & Africa ASEAN Taxi Industry Revenue (Million), by Service Type 2024 & 2032
- Figure 39: Middle East & Africa ASEAN Taxi Industry Revenue Share (%), by Service Type 2024 & 2032
- Figure 40: Middle East & Africa ASEAN Taxi Industry Revenue (Million), by Country 2024 & 2032
- Figure 41: Middle East & Africa ASEAN Taxi Industry Revenue Share (%), by Country 2024 & 2032
- Figure 42: Asia Pacific ASEAN Taxi Industry Revenue (Million), by Booking Type 2024 & 2032
- Figure 43: Asia Pacific ASEAN Taxi Industry Revenue Share (%), by Booking Type 2024 & 2032
- Figure 44: Asia Pacific ASEAN Taxi Industry Revenue (Million), by Vehicle Type 2024 & 2032
- Figure 45: Asia Pacific ASEAN Taxi Industry Revenue Share (%), by Vehicle Type 2024 & 2032
- Figure 46: Asia Pacific ASEAN Taxi Industry Revenue (Million), by Service Type 2024 & 2032
- Figure 47: Asia Pacific ASEAN Taxi Industry Revenue Share (%), by Service Type 2024 & 2032
- Figure 48: Asia Pacific ASEAN Taxi Industry Revenue (Million), by Country 2024 & 2032
- Figure 49: Asia Pacific ASEAN Taxi Industry Revenue Share (%), by Country 2024 & 2032
List of Tables
- Table 1: Global ASEAN Taxi Industry Revenue Million Forecast, by Region 2019 & 2032
- Table 2: Global ASEAN Taxi Industry Revenue Million Forecast, by Booking Type 2019 & 2032
- Table 3: Global ASEAN Taxi Industry Revenue Million Forecast, by Vehicle Type 2019 & 2032
- Table 4: Global ASEAN Taxi Industry Revenue Million Forecast, by Service Type 2019 & 2032
- Table 5: Global ASEAN Taxi Industry Revenue Million Forecast, by Region 2019 & 2032
- Table 6: Global ASEAN Taxi Industry Revenue Million Forecast, by Country 2019 & 2032
- Table 7: United States ASEAN Taxi Industry Revenue (Million) Forecast, by Application 2019 & 2032
- Table 8: Canada ASEAN Taxi Industry Revenue (Million) Forecast, by Application 2019 & 2032
- Table 9: Rest of North America ASEAN Taxi Industry Revenue (Million) Forecast, by Application 2019 & 2032
- Table 10: Global ASEAN Taxi Industry Revenue Million Forecast, by Country 2019 & 2032
- Table 11: Germany ASEAN Taxi Industry Revenue (Million) Forecast, by Application 2019 & 2032
- Table 12: United Kingdom ASEAN Taxi Industry Revenue (Million) Forecast, by Application 2019 & 2032
- Table 13: France ASEAN Taxi Industry Revenue (Million) Forecast, by Application 2019 & 2032
- Table 14: Italy ASEAN Taxi Industry Revenue (Million) Forecast, by Application 2019 & 2032
- Table 15: Rest of Europe ASEAN Taxi Industry Revenue (Million) Forecast, by Application 2019 & 2032
- Table 16: Global ASEAN Taxi Industry Revenue Million Forecast, by Country 2019 & 2032
- Table 17: China ASEAN Taxi Industry Revenue (Million) Forecast, by Application 2019 & 2032
- Table 18: Japan ASEAN Taxi Industry Revenue (Million) Forecast, by Application 2019 & 2032
- Table 19: India ASEAN Taxi Industry Revenue (Million) Forecast, by Application 2019 & 2032
- Table 20: South Korea ASEAN Taxi Industry Revenue (Million) Forecast, by Application 2019 & 2032
- Table 21: Rest of Asia Pacific ASEAN Taxi Industry Revenue (Million) Forecast, by Application 2019 & 2032
- Table 22: Global ASEAN Taxi Industry Revenue Million Forecast, by Country 2019 & 2032
- Table 23: Brazil ASEAN Taxi Industry Revenue (Million) Forecast, by Application 2019 & 2032
- Table 24: South Africa ASEAN Taxi Industry Revenue (Million) Forecast, by Application 2019 & 2032
- Table 25: United Arab Emirates ASEAN Taxi Industry Revenue (Million) Forecast, by Application 2019 & 2032
- Table 26: Other Countries ASEAN Taxi Industry Revenue (Million) Forecast, by Application 2019 & 2032
- Table 27: Global ASEAN Taxi Industry Revenue Million Forecast, by Booking Type 2019 & 2032
- Table 28: Global ASEAN Taxi Industry Revenue Million Forecast, by Vehicle Type 2019 & 2032
- Table 29: Global ASEAN Taxi Industry Revenue Million Forecast, by Service Type 2019 & 2032
- Table 30: Global ASEAN Taxi Industry Revenue Million Forecast, by Country 2019 & 2032
- Table 31: United States ASEAN Taxi Industry Revenue (Million) Forecast, by Application 2019 & 2032
- Table 32: Canada ASEAN Taxi Industry Revenue (Million) Forecast, by Application 2019 & 2032
- Table 33: Mexico ASEAN Taxi Industry Revenue (Million) Forecast, by Application 2019 & 2032
- Table 34: Global ASEAN Taxi Industry Revenue Million Forecast, by Booking Type 2019 & 2032
- Table 35: Global ASEAN Taxi Industry Revenue Million Forecast, by Vehicle Type 2019 & 2032
- Table 36: Global ASEAN Taxi Industry Revenue Million Forecast, by Service Type 2019 & 2032
- Table 37: Global ASEAN Taxi Industry Revenue Million Forecast, by Country 2019 & 2032
- Table 38: Brazil ASEAN Taxi Industry Revenue (Million) Forecast, by Application 2019 & 2032
- Table 39: Argentina ASEAN Taxi Industry Revenue (Million) Forecast, by Application 2019 & 2032
- Table 40: Rest of South America ASEAN Taxi Industry Revenue (Million) Forecast, by Application 2019 & 2032
- Table 41: Global ASEAN Taxi Industry Revenue Million Forecast, by Booking Type 2019 & 2032
- Table 42: Global ASEAN Taxi Industry Revenue Million Forecast, by Vehicle Type 2019 & 2032
- Table 43: Global ASEAN Taxi Industry Revenue Million Forecast, by Service Type 2019 & 2032
- Table 44: Global ASEAN Taxi Industry Revenue Million Forecast, by Country 2019 & 2032
- Table 45: United Kingdom ASEAN Taxi Industry Revenue (Million) Forecast, by Application 2019 & 2032
- Table 46: Germany ASEAN Taxi Industry Revenue (Million) Forecast, by Application 2019 & 2032
- Table 47: France ASEAN Taxi Industry Revenue (Million) Forecast, by Application 2019 & 2032
- Table 48: Italy ASEAN Taxi Industry Revenue (Million) Forecast, by Application 2019 & 2032
- Table 49: Spain ASEAN Taxi Industry Revenue (Million) Forecast, by Application 2019 & 2032
- Table 50: Russia ASEAN Taxi Industry Revenue (Million) Forecast, by Application 2019 & 2032
- Table 51: Benelux ASEAN Taxi Industry Revenue (Million) Forecast, by Application 2019 & 2032
- Table 52: Nordics ASEAN Taxi Industry Revenue (Million) Forecast, by Application 2019 & 2032
- Table 53: Rest of Europe ASEAN Taxi Industry Revenue (Million) Forecast, by Application 2019 & 2032
- Table 54: Global ASEAN Taxi Industry Revenue Million Forecast, by Booking Type 2019 & 2032
- Table 55: Global ASEAN Taxi Industry Revenue Million Forecast, by Vehicle Type 2019 & 2032
- Table 56: Global ASEAN Taxi Industry Revenue Million Forecast, by Service Type 2019 & 2032
- Table 57: Global ASEAN Taxi Industry Revenue Million Forecast, by Country 2019 & 2032
- Table 58: Turkey ASEAN Taxi Industry Revenue (Million) Forecast, by Application 2019 & 2032
- Table 59: Israel ASEAN Taxi Industry Revenue (Million) Forecast, by Application 2019 & 2032
- Table 60: GCC ASEAN Taxi Industry Revenue (Million) Forecast, by Application 2019 & 2032
- Table 61: North Africa ASEAN Taxi Industry Revenue (Million) Forecast, by Application 2019 & 2032
- Table 62: South Africa ASEAN Taxi Industry Revenue (Million) Forecast, by Application 2019 & 2032
- Table 63: Rest of Middle East & Africa ASEAN Taxi Industry Revenue (Million) Forecast, by Application 2019 & 2032
- Table 64: Global ASEAN Taxi Industry Revenue Million Forecast, by Booking Type 2019 & 2032
- Table 65: Global ASEAN Taxi Industry Revenue Million Forecast, by Vehicle Type 2019 & 2032
- Table 66: Global ASEAN Taxi Industry Revenue Million Forecast, by Service Type 2019 & 2032
- Table 67: Global ASEAN Taxi Industry Revenue Million Forecast, by Country 2019 & 2032
- Table 68: China ASEAN Taxi Industry Revenue (Million) Forecast, by Application 2019 & 2032
- Table 69: India ASEAN Taxi Industry Revenue (Million) Forecast, by Application 2019 & 2032
- Table 70: Japan ASEAN Taxi Industry Revenue (Million) Forecast, by Application 2019 & 2032
- Table 71: South Korea ASEAN Taxi Industry Revenue (Million) Forecast, by Application 2019 & 2032
- Table 72: ASEAN ASEAN Taxi Industry Revenue (Million) Forecast, by Application 2019 & 2032
- Table 73: Oceania ASEAN Taxi Industry Revenue (Million) Forecast, by Application 2019 & 2032
- Table 74: Rest of Asia Pacific ASEAN Taxi Industry Revenue (Million) Forecast, by Application 2019 & 2032
Frequently Asked Questions
1. What is the projected Compound Annual Growth Rate (CAGR) of the ASEAN Taxi Industry?
The projected CAGR is approximately 7.40%.
2. Which companies are prominent players in the ASEAN Taxi Industry?
Key companies in the market include TADA, Ryde, Didi, Uber Technologies Inc, Lyft Inc, Public Cab Sdn Bhd, PT Gojek, Blue Cab Malaysi, Grab Holdings Inc.
3. What are the main segments of the ASEAN Taxi Industry?
The market segments include Booking Type, Vehicle Type, Service Type.
4. Can you provide details about the market size?
The market size is estimated to be USD 22.70 Million as of 2022.
5. What are some drivers contributing to market growth?
Increasing Demand From Online Channel.
6. What are the notable trends driving market growth?
Increasing Penetration of Online Channels for Booking Taxis.
7. Are there any restraints impacting market growth?
Increasing Traffic Problems And Reliability Issues.
8. Can you provide examples of recent developments in the market?
N/A
9. What pricing options are available for accessing the report?
Pricing options include single-user, multi-user, and enterprise licenses priced at USD 3800, USD 4500, and USD 5800 respectively.
10. Is the market size provided in terms of value or volume?
The market size is provided in terms of value, measured in Million.
11. Are there any specific market keywords associated with the report?
Yes, the market keyword associated with the report is "ASEAN Taxi Industry," which aids in identifying and referencing the specific market segment covered.
12. How do I determine which pricing option suits my needs best?
The pricing options vary based on user requirements and access needs. Individual users may opt for single-user licenses, while businesses requiring broader access may choose multi-user or enterprise licenses for cost-effective access to the report.
13. Are there any additional resources or data provided in the ASEAN Taxi Industry report?
While the report offers comprehensive insights, it's advisable to review the specific contents or supplementary materials provided to ascertain if additional resources or data are available.
14. How can I stay updated on further developments or reports in the ASEAN Taxi Industry?
To stay informed about further developments, trends, and reports in the ASEAN Taxi Industry, consider subscribing to industry newsletters, following relevant companies and organizations, or regularly checking reputable industry news sources and publications.
Methodology
Step 1 - Identification of Relevant Samples Size from Population Database


Step 2 - Approaches for Defining Global Market Size (Value, Volume* & Price*)

Note*: In applicable scenarios
Step 3 - Data Sources
Primary Research
- Web Analytics
- Survey Reports
- Research Institute
- Latest Research Reports
- Opinion Leaders
Secondary Research
- Annual Reports
- White Paper
- Latest Press Release
- Industry Association
- Paid Database
- Investor Presentations

Step 4 - Data Triangulation
Involves using different sources of information in order to increase the validity of a study
These sources are likely to be stakeholders in a program - participants, other researchers, program staff, other community members, and so on.
Then we put all data in single framework & apply various statistical tools to find out the dynamic on the market.
During the analysis stage, feedback from the stakeholder groups would be compared to determine areas of agreement as well as areas of divergence


