
Key Insights
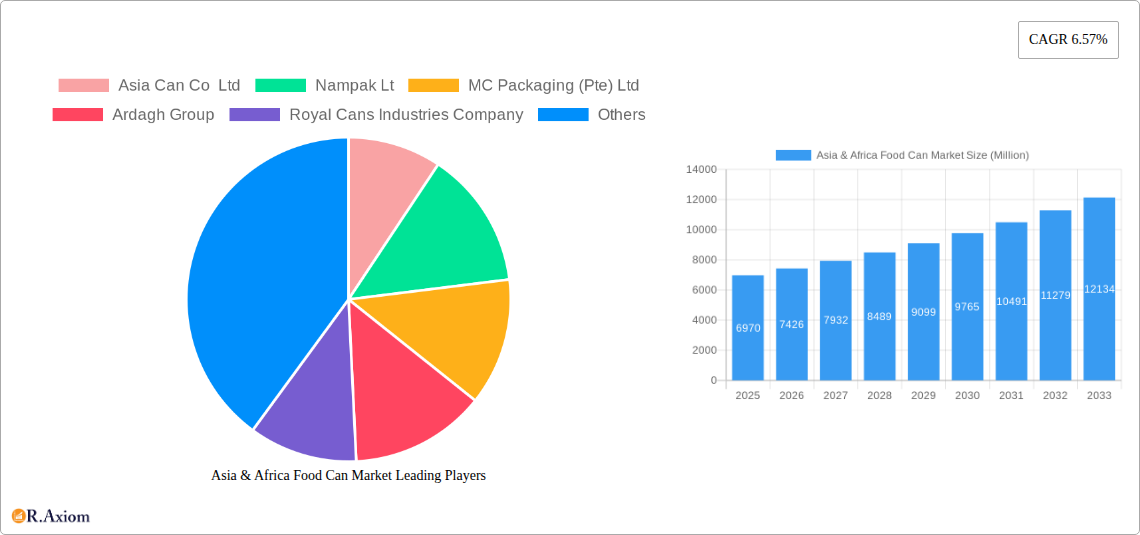
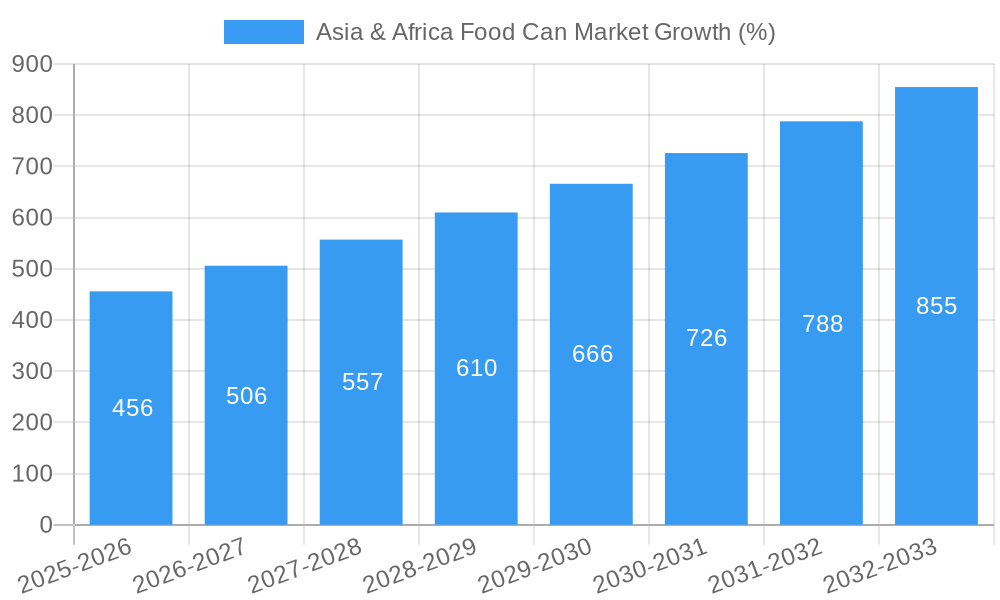
The Asia & Africa food can market, valued at $6.97 billion in 2025, is poised for robust growth, projected to expand at a compound annual growth rate (CAGR) of 6.57% from 2025 to 2033. This growth is driven by several key factors. The rising demand for convenient and shelf-stable food products, particularly in rapidly urbanizing regions across Asia and Africa, fuels the adoption of canned food. Increased disposable incomes and changing consumer lifestyles are contributing to this trend. Furthermore, advancements in can manufacturing technology, resulting in lighter, more sustainable, and cost-effective cans, are boosting market expansion. The increasing popularity of ready-to-eat meals and the growth of the processed food sector are also significant drivers. Segmentation reveals a strong preference for aluminum cans due to their lightweight properties and recyclability, while the two-piece can design dominates the market owing to efficient production processes. Fish and seafood, fruits and vegetables, and processed food constitute the major application segments. Competitive dynamics are shaped by a mix of established multinational corporations like Crown Holdings Inc. and Silgan Holdings Inc., alongside regional players such as Asia Can Co Ltd and Kian Joo Can Factory (Can One), each catering to specific market needs and regional preferences.
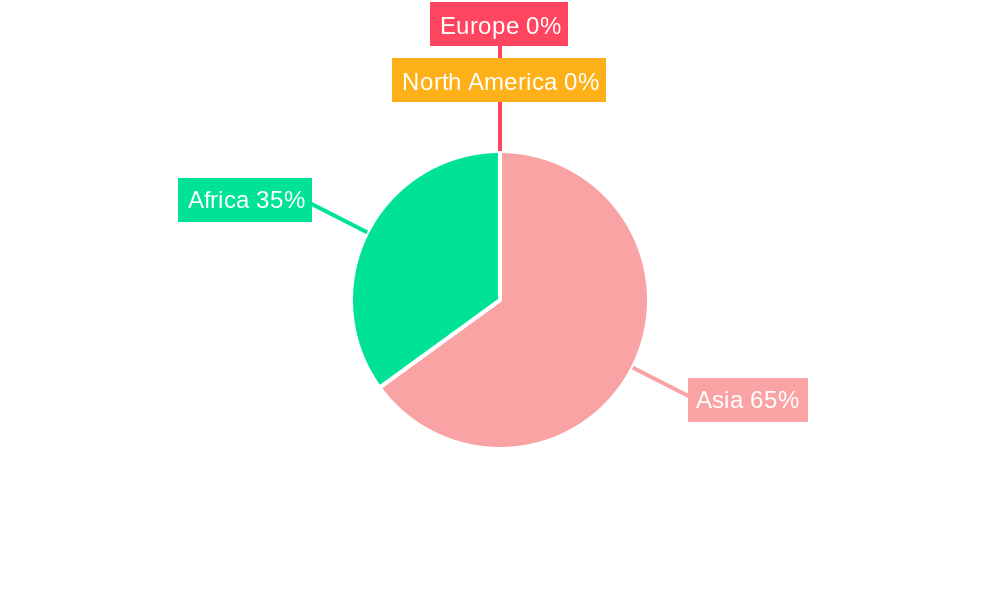
Geographical variations exist within the market. While precise data for individual African nations is limited, South Africa, with its comparatively developed economy and food processing sector, likely holds a substantial share within the African market. Similarly, populous nations such as Kenya and Uganda are experiencing significant growth in food consumption, translating into increased demand for canned goods. The Asian market, given its vast population and diverse food culture, presents considerable growth opportunities. However, challenges remain, including fluctuating raw material prices, stringent environmental regulations, and the potential for disruptions in the global supply chain. Nonetheless, the overall outlook for the Asia & Africa food can market is positive, suggesting a significant trajectory for growth over the forecast period.
This comprehensive report provides an in-depth analysis of the Asia & Africa Food Can Market, offering invaluable insights for industry stakeholders, investors, and strategic decision-makers. The study period spans from 2019 to 2033, with 2025 serving as the base and estimated year. The report meticulously examines market trends, competitive dynamics, and growth opportunities across various segments, including material type, can type, and application. The forecast period is 2025-2033, while the historical period covers 2019-2024.
Asia & Africa Food Can Market Market Concentration & Innovation
The Asia & Africa Food Can market exhibits a moderately concentrated landscape, with key players such as Crown Holdings Inc, Silgan Holdings Inc, and Nampak Ltd holding significant market share. The precise market share of each company in 2025 is estimated at xx%, xx%, and xx%, respectively. Innovation is driven by the increasing demand for lightweight, sustainable cans, and advancements in can coating and printing technologies. Regulatory frameworks concerning food safety and environmental sustainability are impacting material choices and manufacturing processes. Aluminum cans are experiencing higher growth compared to steel/tin cans due to their lightweight nature and recyclability, leading to a shifting market share dynamic. Product substitutes, such as flexible packaging, pose a competitive challenge, though metal cans retain an edge in terms of barrier properties and shelf life extension. End-user trends favor convenience, portability, and sustainability, impacting can design and functionality. M&A activity in the sector remains relatively moderate, with a total deal value of approximately $xx Million observed during the historical period. This can be attributed to various factors including consolidation efforts among existing players, along with expansion strategies focused on geographic reach and capacity enhancement.
Asia & Africa Food Can Market Industry Trends & Insights
The Asia & Africa Food Can market is experiencing robust growth, driven primarily by rising demand for packaged food, increasing urbanization, and expanding middle-class populations. The Compound Annual Growth Rate (CAGR) during the forecast period is projected at xx%. Technological advancements such as lightweighting, improved coatings, and innovative printing techniques are enhancing can performance and aesthetic appeal. Consumer preferences are shifting towards healthier and more sustainable food products, influencing packaging choices. Competitive dynamics are characterized by intense competition among established players and the emergence of new entrants, leading to price pressures and innovation-driven differentiation. Market penetration of aluminum cans is estimated at approximately xx% in 2025, while steel/tin cans hold a share of xx%. This reflects the ongoing preference shift towards lighter and more sustainable packaging options.
Dominant Markets & Segments in Asia & Africa Food Can Market
- Leading Region: The market is dominated by xx, primarily due to the high population density, robust food processing sector, and growing demand for packaged food. India and China are expected to remain significant contributors to market growth.
- Leading Country: India exhibits the highest growth trajectory within Asia & Africa, driven by favorable demographics and rising disposable incomes.
- Dominant Material: Aluminum cans are projected to hold the larger market share by 2025. Factors such as improved recyclability and lightweight properties are contributing factors to this segment’s growth.
- Dominant Can Type: Two-piece cans are more prevalent due to lower production costs and increased efficiency compared to three-piece cans. This is reflected in the larger market share held by this segment compared to the three-piece cans segment.
- Dominant Application: The Processed food segment is expected to maintain its dominance, followed by the Fish and Seafood segment. Growth in both these segments is fueled by rising consumer demand for convenient and shelf-stable food products.
Key drivers of the dominance of certain segments include:
- Economic Policies: Government initiatives promoting food processing and infrastructure development fuel market growth.
- Infrastructure: Improved transportation and logistics networks enhance the accessibility of canned food.
Asia & Africa Food Can Market Product Developments
Recent product innovations focus on sustainability, incorporating recycled materials and enhanced recyclability features. Advancements in can coating technology improve barrier properties, extending shelf life and enhancing product protection. New can designs and sizes cater to evolving consumer preferences and market demands. These developments reflect a clear shift towards environmentally conscious and highly functional solutions to address growing consumer needs. For example, new, lightweight aluminum can designs are appearing in the market, leading to transportation and manufacturing cost reductions, while simultaneously improving the sustainability of the product itself.
Report Scope & Segmentation Analysis
This report segments the Asia & Africa Food Can Market based on material (Aluminum Cans, Steel/Tin Cans), can type (2-piece, 3-piece), and application (Fish and Seafood, Fruits and Vegetables, Processed Food, Pet Food, Other Applications). Each segment's growth projections, market size, and competitive dynamics are analyzed in detail. The market size for Aluminum Cans is projected to reach $xx Million by 2033, while Steel/Tin Cans is estimated to reach $xx Million. The two-piece can segment is expected to witness faster growth due to its cost-effectiveness. The Processed Food application segment is projected to remain the dominant application, contributing a significant portion of the overall market value due to the high demand for convenient and ready-to-eat food products.
Key Drivers of Asia & Africa Food Can Market Growth
Several factors contribute to the growth of the Asia & Africa Food Can market. These include:
- Rising Disposable Incomes: Increased purchasing power fuels demand for packaged and convenient food products.
- Technological Advancements: Innovations in can manufacturing and design enhance product quality and shelf life.
- Favorable Government Policies: Supportive regulations and infrastructure development stimulate industry growth.
Challenges in the Asia & Africa Food Can Market Sector
The Asia & Africa Food Can market faces certain challenges:
- Fluctuating Raw Material Prices: Variations in aluminum and steel prices affect production costs.
- Stringent Regulatory Compliance: Meeting food safety and environmental standards adds to operational complexities.
- Intense Competition: Price wars and intense competition from other packaging solutions put pressure on profit margins.
Emerging Opportunities in Asia & Africa Food Can Market
Emerging opportunities exist in:
- Sustainable Packaging Solutions: Demand for eco-friendly cans made from recycled materials is increasing.
- E-commerce Growth: The rise of online grocery shopping creates new distribution channels.
- Expanding Food Processing Sector: Growth in the food processing industry fuels the need for metal cans.
Leading Players in the Asia & Africa Food Can Market Market
- Asia Can Co Ltd
- Nampak Ltd
- MC Packaging (Pte) Ltd
- Ardagh Group
- Royal Cans Industries Company
- Dongwon Systems
- Crown Holdings Inc
- CPMC Holdings Limited
- CanSmart Group
- Toyo Seikan Group Holdings Ltd
- Kaira Can Private Limited
- Kian Joo Can Factory (Can One)
- Silgan Holdings Inc
- ORG Packaging Co Limited
- Can It
Key Developments in Asia & Africa Food Can Market Industry
- November 2020: Nestle announced the expansion of its cereal business production in Zimbabwe, aiming for a more than 30% increase in production. This indicates significant growth in the demand for canned goods in the region.
- February 2021: Tyson Foods and Malayan Flour Mills Berhad (MFM) partnered, with Tyson Foods investing in MFM's poultry business. This development enhances supply chain flexibility and potentially increases the demand for food cans used in poultry packaging.
Strategic Outlook for Asia & Africa Food Can Market Market
The Asia & Africa Food Can market presents a significant growth opportunity driven by rising consumer demand, technological advancements, and favorable economic factors. Companies focusing on sustainable packaging solutions, efficient manufacturing processes, and catering to evolving consumer preferences are poised for success. The market's continued expansion relies heavily on economic growth, infrastructural improvements, and government support of the food processing industry across the region. The long-term outlook for the market remains positive, with significant potential for expansion and increased market share for key players.
Asia & Africa Food Can Market Segmentation
-
1. Material
- 1.1. Aluminum Cans
- 1.2. Steel/Tin Cans
-
2. Can Type
- 2.1. 2-piece
- 2.2. 3-piece
-
3. Application
- 3.1. Fish and Seafood
- 3.2. Fruits and Vegetables
- 3.3. Processed Food
- 3.4. Pet Food
- 3.5. Other Applications
-
4. Geography
-
4.1. Asia
- 4.1.1. China
- 4.1.2. India
- 4.1.3. South Korea
- 4.1.4. Southeast Asia
-
4.2. Africa
- 4.2.1. South Africa
-
4.1. Asia
Asia & Africa Food Can Market Segmentation By Geography
-
1. Asia
- 1.1. China
- 1.2. India
- 1.3. South Korea
- 1.4. Southeast Asia
-
2. Africa
- 2.1. South Africa
Asia & Africa Food Can Market REPORT HIGHLIGHTS
| Aspects | Details |
|---|---|
| Study Period | 2019-2033 |
| Base Year | 2024 |
| Estimated Year | 2025 |
| Forecast Period | 2025-2033 |
| Historical Period | 2019-2024 |
| Growth Rate | CAGR of 6.57% from 2019-2033 |
| Segmentation |
|
Table of Contents
- 1. Introduction
- 1.1. Research Scope
- 1.2. Market Segmentation
- 1.3. Research Methodology
- 1.4. Definitions and Assumptions
- 2. Executive Summary
- 2.1. Introduction
- 3. Market Dynamics
- 3.1. Introduction
- 3.2. Market Drivers
- 3.2.1. High Recyclable Score of Metal Cans over Alternatives; Demand for Canned Foods Driven by Cost and Convenience-related Advantages; Product Innovations Leading to Increased Shelf Life
- 3.3. Market Restrains
- 3.3.1. ; Stringent Regulations on the Usage of Plastic Bottles
- 3.4. Market Trends
- 3.4.1. Fruits and Vegetables to Drive the Market Growth
- 4. Market Factor Analysis
- 4.1. Porters Five Forces
- 4.2. Supply/Value Chain
- 4.3. PESTEL analysis
- 4.4. Market Entropy
- 4.5. Patent/Trademark Analysis
- 5. Asia & Africa Food Can Market Analysis, Insights and Forecast, 2019-2031
- 5.1. Market Analysis, Insights and Forecast - by Material
- 5.1.1. Aluminum Cans
- 5.1.2. Steel/Tin Cans
- 5.2. Market Analysis, Insights and Forecast - by Can Type
- 5.2.1. 2-piece
- 5.2.2. 3-piece
- 5.3. Market Analysis, Insights and Forecast - by Application
- 5.3.1. Fish and Seafood
- 5.3.2. Fruits and Vegetables
- 5.3.3. Processed Food
- 5.3.4. Pet Food
- 5.3.5. Other Applications
- 5.4. Market Analysis, Insights and Forecast - by Geography
- 5.4.1. Asia
- 5.4.1.1. China
- 5.4.1.2. India
- 5.4.1.3. South Korea
- 5.4.1.4. Southeast Asia
- 5.4.2. Africa
- 5.4.2.1. South Africa
- 5.4.1. Asia
- 5.5. Market Analysis, Insights and Forecast - by Region
- 5.5.1. Asia
- 5.5.2. Africa
- 5.1. Market Analysis, Insights and Forecast - by Material
- 6. Asia Asia & Africa Food Can Market Analysis, Insights and Forecast, 2019-2031
- 6.1. Market Analysis, Insights and Forecast - by Material
- 6.1.1. Aluminum Cans
- 6.1.2. Steel/Tin Cans
- 6.2. Market Analysis, Insights and Forecast - by Can Type
- 6.2.1. 2-piece
- 6.2.2. 3-piece
- 6.3. Market Analysis, Insights and Forecast - by Application
- 6.3.1. Fish and Seafood
- 6.3.2. Fruits and Vegetables
- 6.3.3. Processed Food
- 6.3.4. Pet Food
- 6.3.5. Other Applications
- 6.4. Market Analysis, Insights and Forecast - by Geography
- 6.4.1. Asia
- 6.4.1.1. China
- 6.4.1.2. India
- 6.4.1.3. South Korea
- 6.4.1.4. Southeast Asia
- 6.4.2. Africa
- 6.4.2.1. South Africa
- 6.4.1. Asia
- 6.1. Market Analysis, Insights and Forecast - by Material
- 7. Africa Asia & Africa Food Can Market Analysis, Insights and Forecast, 2019-2031
- 7.1. Market Analysis, Insights and Forecast - by Material
- 7.1.1. Aluminum Cans
- 7.1.2. Steel/Tin Cans
- 7.2. Market Analysis, Insights and Forecast - by Can Type
- 7.2.1. 2-piece
- 7.2.2. 3-piece
- 7.3. Market Analysis, Insights and Forecast - by Application
- 7.3.1. Fish and Seafood
- 7.3.2. Fruits and Vegetables
- 7.3.3. Processed Food
- 7.3.4. Pet Food
- 7.3.5. Other Applications
- 7.4. Market Analysis, Insights and Forecast - by Geography
- 7.4.1. Asia
- 7.4.1.1. China
- 7.4.1.2. India
- 7.4.1.3. South Korea
- 7.4.1.4. Southeast Asia
- 7.4.2. Africa
- 7.4.2.1. South Africa
- 7.4.1. Asia
- 7.1. Market Analysis, Insights and Forecast - by Material
- 8. South Africa Asia & Africa Food Can Market Analysis, Insights and Forecast, 2019-2031
- 9. Sudan Asia & Africa Food Can Market Analysis, Insights and Forecast, 2019-2031
- 10. Uganda Asia & Africa Food Can Market Analysis, Insights and Forecast, 2019-2031
- 11. Tanzania Asia & Africa Food Can Market Analysis, Insights and Forecast, 2019-2031
- 12. Kenya Asia & Africa Food Can Market Analysis, Insights and Forecast, 2019-2031
- 13. Rest of Africa Asia & Africa Food Can Market Analysis, Insights and Forecast, 2019-2031
- 14. Competitive Analysis
- 14.1. Market Share Analysis 2024
- 14.2. Company Profiles
- 14.2.1 Asia Can Co Ltd
- 14.2.1.1. Overview
- 14.2.1.2. Products
- 14.2.1.3. SWOT Analysis
- 14.2.1.4. Recent Developments
- 14.2.1.5. Financials (Based on Availability)
- 14.2.2 Nampak Lt
- 14.2.2.1. Overview
- 14.2.2.2. Products
- 14.2.2.3. SWOT Analysis
- 14.2.2.4. Recent Developments
- 14.2.2.5. Financials (Based on Availability)
- 14.2.3 MC Packaging (Pte) Ltd
- 14.2.3.1. Overview
- 14.2.3.2. Products
- 14.2.3.3. SWOT Analysis
- 14.2.3.4. Recent Developments
- 14.2.3.5. Financials (Based on Availability)
- 14.2.4 Ardagh Group
- 14.2.4.1. Overview
- 14.2.4.2. Products
- 14.2.4.3. SWOT Analysis
- 14.2.4.4. Recent Developments
- 14.2.4.5. Financials (Based on Availability)
- 14.2.5 Royal Cans Industries Company
- 14.2.5.1. Overview
- 14.2.5.2. Products
- 14.2.5.3. SWOT Analysis
- 14.2.5.4. Recent Developments
- 14.2.5.5. Financials (Based on Availability)
- 14.2.6 Dongwon Systems
- 14.2.6.1. Overview
- 14.2.6.2. Products
- 14.2.6.3. SWOT Analysis
- 14.2.6.4. Recent Developments
- 14.2.6.5. Financials (Based on Availability)
- 14.2.7 Crown Holdings Inc
- 14.2.7.1. Overview
- 14.2.7.2. Products
- 14.2.7.3. SWOT Analysis
- 14.2.7.4. Recent Developments
- 14.2.7.5. Financials (Based on Availability)
- 14.2.8 CPMC Holdings Limited
- 14.2.8.1. Overview
- 14.2.8.2. Products
- 14.2.8.3. SWOT Analysis
- 14.2.8.4. Recent Developments
- 14.2.8.5. Financials (Based on Availability)
- 14.2.9 CanSmart Group
- 14.2.9.1. Overview
- 14.2.9.2. Products
- 14.2.9.3. SWOT Analysis
- 14.2.9.4. Recent Developments
- 14.2.9.5. Financials (Based on Availability)
- 14.2.10 Toyo Seikan Group Holdings Ltd
- 14.2.10.1. Overview
- 14.2.10.2. Products
- 14.2.10.3. SWOT Analysis
- 14.2.10.4. Recent Developments
- 14.2.10.5. Financials (Based on Availability)
- 14.2.11 Kaira Can Private Limited
- 14.2.11.1. Overview
- 14.2.11.2. Products
- 14.2.11.3. SWOT Analysis
- 14.2.11.4. Recent Developments
- 14.2.11.5. Financials (Based on Availability)
- 14.2.12 Kian Joo Can Factory (Can One)
- 14.2.12.1. Overview
- 14.2.12.2. Products
- 14.2.12.3. SWOT Analysis
- 14.2.12.4. Recent Developments
- 14.2.12.5. Financials (Based on Availability)
- 14.2.13 Silgan Holdings Inc
- 14.2.13.1. Overview
- 14.2.13.2. Products
- 14.2.13.3. SWOT Analysis
- 14.2.13.4. Recent Developments
- 14.2.13.5. Financials (Based on Availability)
- 14.2.14 ORG Packaging Co Limited
- 14.2.14.1. Overview
- 14.2.14.2. Products
- 14.2.14.3. SWOT Analysis
- 14.2.14.4. Recent Developments
- 14.2.14.5. Financials (Based on Availability)
- 14.2.15 Can It
- 14.2.15.1. Overview
- 14.2.15.2. Products
- 14.2.15.3. SWOT Analysis
- 14.2.15.4. Recent Developments
- 14.2.15.5. Financials (Based on Availability)
- 14.2.1 Asia Can Co Ltd
List of Figures
- Figure 1: Asia & Africa Food Can Market Revenue Breakdown (Million, %) by Product 2024 & 2032
- Figure 2: Asia & Africa Food Can Market Share (%) by Company 2024
List of Tables
- Table 1: Asia & Africa Food Can Market Revenue Million Forecast, by Region 2019 & 2032
- Table 2: Asia & Africa Food Can Market Revenue Million Forecast, by Material 2019 & 2032
- Table 3: Asia & Africa Food Can Market Revenue Million Forecast, by Can Type 2019 & 2032
- Table 4: Asia & Africa Food Can Market Revenue Million Forecast, by Application 2019 & 2032
- Table 5: Asia & Africa Food Can Market Revenue Million Forecast, by Geography 2019 & 2032
- Table 6: Asia & Africa Food Can Market Revenue Million Forecast, by Region 2019 & 2032
- Table 7: Asia & Africa Food Can Market Revenue Million Forecast, by Country 2019 & 2032
- Table 8: South Africa Asia & Africa Food Can Market Revenue (Million) Forecast, by Application 2019 & 2032
- Table 9: Sudan Asia & Africa Food Can Market Revenue (Million) Forecast, by Application 2019 & 2032
- Table 10: Uganda Asia & Africa Food Can Market Revenue (Million) Forecast, by Application 2019 & 2032
- Table 11: Tanzania Asia & Africa Food Can Market Revenue (Million) Forecast, by Application 2019 & 2032
- Table 12: Kenya Asia & Africa Food Can Market Revenue (Million) Forecast, by Application 2019 & 2032
- Table 13: Rest of Africa Asia & Africa Food Can Market Revenue (Million) Forecast, by Application 2019 & 2032
- Table 14: Asia & Africa Food Can Market Revenue Million Forecast, by Material 2019 & 2032
- Table 15: Asia & Africa Food Can Market Revenue Million Forecast, by Can Type 2019 & 2032
- Table 16: Asia & Africa Food Can Market Revenue Million Forecast, by Application 2019 & 2032
- Table 17: Asia & Africa Food Can Market Revenue Million Forecast, by Geography 2019 & 2032
- Table 18: Asia & Africa Food Can Market Revenue Million Forecast, by Country 2019 & 2032
- Table 19: China Asia & Africa Food Can Market Revenue (Million) Forecast, by Application 2019 & 2032
- Table 20: India Asia & Africa Food Can Market Revenue (Million) Forecast, by Application 2019 & 2032
- Table 21: South Korea Asia & Africa Food Can Market Revenue (Million) Forecast, by Application 2019 & 2032
- Table 22: Southeast Asia Asia & Africa Food Can Market Revenue (Million) Forecast, by Application 2019 & 2032
- Table 23: Asia & Africa Food Can Market Revenue Million Forecast, by Material 2019 & 2032
- Table 24: Asia & Africa Food Can Market Revenue Million Forecast, by Can Type 2019 & 2032
- Table 25: Asia & Africa Food Can Market Revenue Million Forecast, by Application 2019 & 2032
- Table 26: Asia & Africa Food Can Market Revenue Million Forecast, by Geography 2019 & 2032
- Table 27: Asia & Africa Food Can Market Revenue Million Forecast, by Country 2019 & 2032
- Table 28: South Africa Asia & Africa Food Can Market Revenue (Million) Forecast, by Application 2019 & 2032
Frequently Asked Questions
1. What is the projected Compound Annual Growth Rate (CAGR) of the Asia & Africa Food Can Market?
The projected CAGR is approximately 6.57%.
2. Which companies are prominent players in the Asia & Africa Food Can Market?
Key companies in the market include Asia Can Co Ltd, Nampak Lt, MC Packaging (Pte) Ltd, Ardagh Group, Royal Cans Industries Company, Dongwon Systems, Crown Holdings Inc, CPMC Holdings Limited, CanSmart Group, Toyo Seikan Group Holdings Ltd, Kaira Can Private Limited, Kian Joo Can Factory (Can One), Silgan Holdings Inc, ORG Packaging Co Limited, Can It.
3. What are the main segments of the Asia & Africa Food Can Market?
The market segments include Material, Can Type , Application, Geography.
4. Can you provide details about the market size?
The market size is estimated to be USD 6.97 Million as of 2022.
5. What are some drivers contributing to market growth?
High Recyclable Score of Metal Cans over Alternatives; Demand for Canned Foods Driven by Cost and Convenience-related Advantages; Product Innovations Leading to Increased Shelf Life.
6. What are the notable trends driving market growth?
Fruits and Vegetables to Drive the Market Growth.
7. Are there any restraints impacting market growth?
; Stringent Regulations on the Usage of Plastic Bottles.
8. Can you provide examples of recent developments in the market?
February 2021 - Tyson Foods and Malayan Flour Mills Berhad (MFM) announced a partnership in which Tyson Foods is expected to invest in MFM's vertically integrated poultry business, thus adding more supply flexibility for both companies.
9. What pricing options are available for accessing the report?
Pricing options include single-user, multi-user, and enterprise licenses priced at USD 4750, USD 5250, and USD 8750 respectively.
10. Is the market size provided in terms of value or volume?
The market size is provided in terms of value, measured in Million.
11. Are there any specific market keywords associated with the report?
Yes, the market keyword associated with the report is "Asia & Africa Food Can Market," which aids in identifying and referencing the specific market segment covered.
12. How do I determine which pricing option suits my needs best?
The pricing options vary based on user requirements and access needs. Individual users may opt for single-user licenses, while businesses requiring broader access may choose multi-user or enterprise licenses for cost-effective access to the report.
13. Are there any additional resources or data provided in the Asia & Africa Food Can Market report?
While the report offers comprehensive insights, it's advisable to review the specific contents or supplementary materials provided to ascertain if additional resources or data are available.
14. How can I stay updated on further developments or reports in the Asia & Africa Food Can Market?
To stay informed about further developments, trends, and reports in the Asia & Africa Food Can Market, consider subscribing to industry newsletters, following relevant companies and organizations, or regularly checking reputable industry news sources and publications.
Methodology
Step 1 - Identification of Relevant Samples Size from Population Database


Step 2 - Approaches for Defining Global Market Size (Value, Volume* & Price*)

Note*: In applicable scenarios
Step 3 - Data Sources
Primary Research
- Web Analytics
- Survey Reports
- Research Institute
- Latest Research Reports
- Opinion Leaders
Secondary Research
- Annual Reports
- White Paper
- Latest Press Release
- Industry Association
- Paid Database
- Investor Presentations

Step 4 - Data Triangulation
Involves using different sources of information in order to increase the validity of a study
These sources are likely to be stakeholders in a program - participants, other researchers, program staff, other community members, and so on.
Then we put all data in single framework & apply various statistical tools to find out the dynamic on the market.
During the analysis stage, feedback from the stakeholder groups would be compared to determine areas of agreement as well as areas of divergence


