
Key Insights
The Asia Pacific green cement market is experiencing robust growth, driven by increasing environmental concerns and stringent government regulations aimed at reducing carbon emissions from the construction industry. The market's Compound Annual Growth Rate (CAGR) exceeding 10% from 2019 to 2024 indicates a significant upward trajectory. This surge is fueled by a rising demand for sustainable building materials, particularly in rapidly developing economies within the region. Key drivers include the growing awareness of the environmental impact of traditional cement production, coupled with increasing investments in research and development of eco-friendly alternatives. Furthermore, supportive government policies promoting sustainable infrastructure development are significantly boosting market adoption. The market segmentation likely includes various types of green cement, such as those incorporating supplementary cementitious materials (SCMs) like fly ash and slag, and those employing alternative production methods with lower carbon footprints. Major players, such as UltraTech Cement Ltd, Holcim, and CEMEX, are actively investing in green cement production and expansion, further stimulating market growth. While challenges remain, such as the higher initial cost compared to conventional cement and the need for wider acceptance and standardization, the long-term outlook for the Asia Pacific green cement market remains exceptionally positive.
The forecast period of 2025-2033 anticipates continued expansion, although the rate of growth might slightly moderate as the market matures. However, innovation in green cement technology, coupled with ongoing governmental support and increasing consumer demand for sustainable products, will ensure a sustained growth trajectory. Specific regional variations are expected, with countries experiencing rapid urbanization and infrastructure development likely exhibiting higher growth rates. Competitive landscape analysis would further reveal the strategies employed by key players in terms of product innovation, market penetration, and collaborations. The market's future hinges on the continued success in addressing cost-effectiveness and technological advancements, ensuring that green cement becomes a viable and preferred option for construction projects across the Asia Pacific region.
This in-depth report provides a comprehensive analysis of the Asia Pacific Green Cement Market, covering market dynamics, competitive landscape, and future growth projections from 2019 to 2033. The report leverages extensive primary and secondary research to offer actionable insights for industry stakeholders, including manufacturers, investors, and policymakers. With a focus on key trends, challenges, and opportunities, this report is an essential resource for understanding and navigating this rapidly evolving market.
Asia Pacific Green Cement Market Market Concentration & Innovation
The Asia Pacific green cement market exhibits a moderately concentrated landscape, with a few large players holding significant market share. However, the presence of numerous smaller, innovative companies is driving competition and fostering technological advancements. Market concentration is further influenced by regional variations, with some countries demonstrating higher consolidation than others. The overall market share is estimated at xx%, with the top 5 players accounting for approximately xx% of the total market revenue in 2025. This concentration is expected to shift slightly by 2033, potentially reflecting M&A activity and the rise of new entrants.
Several factors fuel innovation within the sector. Stringent environmental regulations are pushing companies to develop more sustainable cement alternatives, thereby stimulating research and development in low-carbon cement technologies. Moreover, growing consumer awareness of environmental issues and the demand for eco-friendly construction materials are further propelling innovation.
- Market Share: Top 5 players account for xx% (2025), projected to be xx% (2033).
- M&A Activity: Significant M&A deals have been observed, with total deal values exceeding USD xx Million in the last 5 years, though specific numbers vary due to the private nature of many transactions.
- Regulatory Frameworks: Varied across nations in the region, influencing product development and market access.
- Product Substitutes: Competition from alternative construction materials (e.g., sustainable wood, recycled materials) poses a challenge, necessitating continuous improvement.
- End-User Trends: Growing preference for sustainable infrastructure projects, driving demand for green cement.
Asia Pacific Green Cement Market Industry Trends & Insights
The Asia Pacific green cement market is experiencing robust growth, driven by a confluence of factors. The region's rapid urbanization and infrastructure development necessitate substantial cement usage, creating a massive market opportunity for environmentally friendly alternatives. Governments across the Asia-Pacific region are increasingly implementing stringent environmental regulations, penalizing high-carbon cement production and incentivizing the adoption of green cement. Furthermore, a rising awareness among consumers about environmental sustainability is fueling demand for eco-friendly building materials.
Technological advancements are also playing a critical role in shaping the market's trajectory. Companies are continuously exploring and adopting new technologies to reduce cement's carbon footprint, including the utilization of industrial by-products and waste materials in cement production. The use of supplementary cementitious materials (SCMs) and clinker-free cement technologies is becoming increasingly prevalent. The market's compound annual growth rate (CAGR) is projected to be xx% during the forecast period (2025-2033), with market penetration expected to rise from xx% in 2025 to xx% by 2033. Competitive dynamics remain intense, with companies vying for market share through product differentiation, technological innovations, and strategic partnerships.
Dominant Markets & Segments in Asia Pacific Green Cement Market
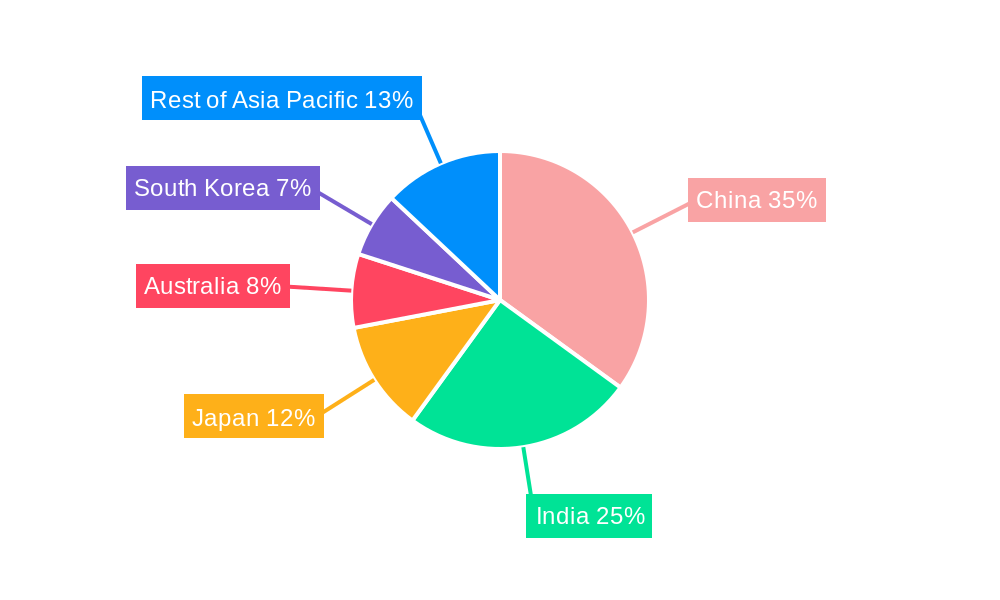
While the entire Asia-Pacific region shows strong growth potential, certain markets and segments are emerging as dominant players. China, India, and Australia are key growth drivers, benefiting from substantial infrastructure projects and supportive government policies. Within these countries, the construction sector contributes significantly to green cement demand, followed by the infrastructure and industrial sectors.
- Key Drivers in Dominant Markets:
- China: Stringent environmental regulations, massive infrastructure development projects (e.g., Belt and Road Initiative).
- India: Rapid urbanization, increasing government focus on sustainable development, supportive policies promoting green construction.
- Australia: Government incentives for green building, ambitious sustainability targets, and a focus on reducing carbon emissions in construction.
- Dominance Analysis: China holds the largest market share due to its sheer scale of construction activity and strong government support for sustainable development. India is rapidly catching up, driven by its burgeoning population and infrastructure requirements. Australia showcases a high level of adoption of green building practices and strong consumer preference for sustainable products.
Asia Pacific Green Cement Market Product Developments
Significant product innovation is reshaping the green cement market. Companies are developing advanced low-carbon cement formulations, incorporating alternative materials like fly ash, slag, and recycled industrial by-products to reduce reliance on clinker. The focus is on improving the performance characteristics of green cement, ensuring it meets the strength and durability requirements of various applications. Clinker-free cement is gaining traction, alongside advancements in carbon capture and storage technologies for cement manufacturing.
Report Scope & Segmentation Analysis
This report segments the Asia Pacific Green Cement Market based on several key factors:
By Product Type: This includes various types of green cement such as Portland limestone cement, geopolymer cement, and other alternative cements. Growth projections vary across these types, with Portland limestone cement currently dominating but facing increasing competition from geopolymer cement. Market sizes are significantly different for each type, reflecting varied adoption rates and production costs. Competitive dynamics also vary, influenced by specific technological advantages and market positions held by companies within each segment.
By Application: This segment includes infrastructure projects, residential construction, commercial construction, and industrial applications. Growth is strong across all applications, with infrastructure projects representing the largest segment owing to significant government investments. Market size projections reflect differing growth rates for each application sector, depending on the specific market trends influencing growth in those sectors. Competitive dynamics within each application area can also vary.
Key Drivers of Asia Pacific Green Cement Market Growth
The Asia Pacific green cement market's expansion is driven by a multitude of factors. Stringent government regulations aimed at reducing carbon emissions in the construction industry are a key driver. Governments are increasingly incentivizing the use of sustainable building materials through tax breaks, subsidies, and stricter environmental standards for construction projects. The accelerating pace of urbanization and infrastructure development in many Asia-Pacific nations are further fueling demand. Finally, growing consumer awareness of environmental issues and a preference for sustainable building materials are significantly influencing market growth.
Challenges in the Asia Pacific Green Cement Market Sector
Several challenges hinder the Asia Pacific green cement market's growth. High initial investment costs associated with establishing green cement production facilities remain a significant barrier for smaller players. Supply chain disruptions and fluctuations in the prices of raw materials can impact profitability. Moreover, the need for standardized testing and certification procedures for green cement is crucial to ensuring its quality and widespread adoption. Competition from traditional cement producers who are investing in low-carbon technologies could reduce the market share for pure green cement producers. The overall impact of these challenges varies by region due to the varying nature of infrastructure, regulatory environments, and local manufacturing capabilities.
Emerging Opportunities in Asia Pacific Green Cement Market
Several emerging opportunities exist within the Asia Pacific green cement market. The development and adoption of advanced carbon capture and storage technologies could significantly reduce the carbon footprint of cement production. The utilization of industrial by-products and waste materials as raw materials for cement production presents a significant opportunity for sustainable and cost-effective manufacturing. Furthermore, exploration of new cement formulations and innovative production processes holds significant potential for the market.
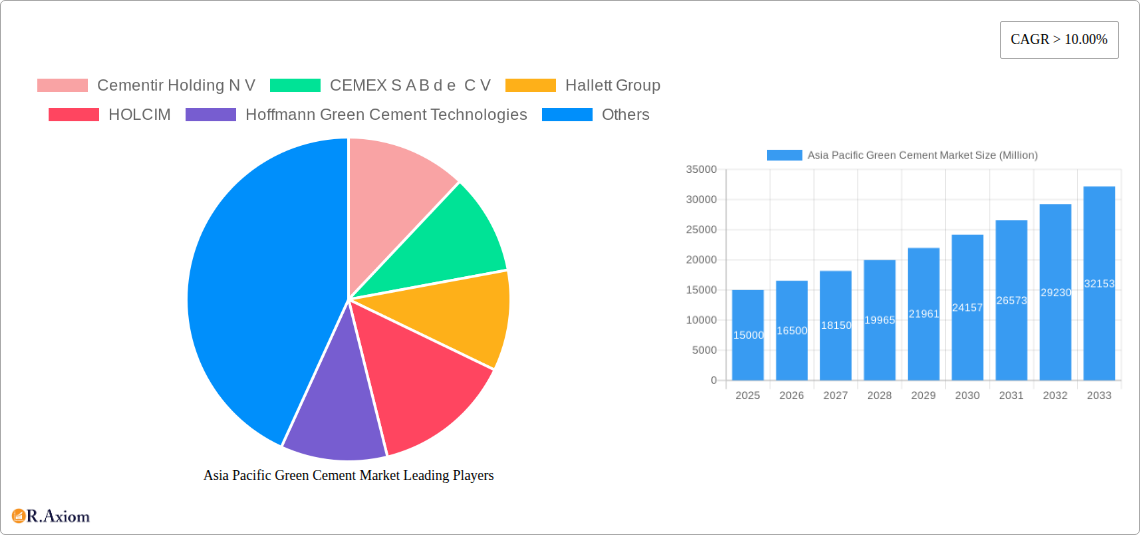
Leading Players in the Asia Pacific Green Cement Market Market
- Cementir Holding N V
- CEMEX S A B d e C V
- Hallett Group
- HOLCIM
- Hoffmann Green Cement Technologies
- Heidelberg Materials
- JSW Cement
- Kiran Global Chem Limited
- Navrattan Group
- TAIHEIYO CEMENT CORPORATION
- UltraTech Cement Ltd
- Votorantim Cimentos
Key Developments in Asia Pacific Green Cement Market Industry
- July 2022: Hallett Group launched its Green Cement Transformation project, building a USD 84.3 Million cement plant in Australia.
- October 2022: JSW Cement announced plans for a USD 390 Million green cement facility in India.
- March 2023: Hoffmann Green Cement secured a Chinese patent for its clay-based H-EVA cement.
- December 2023: Hoffmann Green Cement Technologies extended its partnership with CSTB for three years.
Strategic Outlook for Asia Pacific Green Cement Market Market
The Asia Pacific green cement market exhibits substantial future potential. Continuous technological advancements, supportive government policies, and growing environmental awareness will drive market growth. Companies adopting innovative production technologies, investing in research and development, and expanding their market reach will be best positioned to capture market share. The market is poised for significant expansion, presenting lucrative opportunities for both established players and new entrants.
Asia Pacific Green Cement Market Segmentation
-
1. Product Type
- 1.1. Fly Ash-based
- 1.2. Slag-based
- 1.3. Limestone-based
- 1.4. Silica fume-based
- 1.5. Other Pr
-
2. Construction Sector
- 2.1. Residential
- 2.2. Non-residential
-
3. Geography
- 3.1. China
- 3.2. India
- 3.3. Japan
- 3.4. South Korea
- 3.5. Malaysia
- 3.6. Thailand
- 3.7. Indonesia
- 3.8. Vietnam
- 3.9. Rest of Asia-Pacific
Asia Pacific Green Cement Market Segmentation By Geography
- 1. China
- 2. India
- 3. Japan
- 4. South Korea
- 5. Malaysia
- 6. Thailand
- 7. Indonesia
- 8. Vietnam
- 9. Rest of Asia Pacific
Asia Pacific Green Cement Market REPORT HIGHLIGHTS
| Aspects | Details |
|---|---|
| Study Period | 2019-2033 |
| Base Year | 2024 |
| Estimated Year | 2025 |
| Forecast Period | 2025-2033 |
| Historical Period | 2019-2024 |
| Growth Rate | CAGR of > 10.00% from 2019-2033 |
| Segmentation |
|
Table of Contents
- 1. Introduction
- 1.1. Research Scope
- 1.2. Market Segmentation
- 1.3. Research Methodology
- 1.4. Definitions and Assumptions
- 2. Executive Summary
- 2.1. Introduction
- 3. Market Dynamics
- 3.1. Introduction
- 3.2. Market Drivers
- 3.2.1. Growing Construction Activities In China and India; Favorable Government Policies for Green Building Construction; Abundance of Availability of Raw Materials
- 3.3. Market Restrains
- 3.3.1. Growing Construction Activities In China and India; Favorable Government Policies for Green Building Construction; Abundance of Availability of Raw Materials
- 3.4. Market Trends
- 3.4.1. Residential Construction to Dominate the Market
- 4. Market Factor Analysis
- 4.1. Porters Five Forces
- 4.2. Supply/Value Chain
- 4.3. PESTEL analysis
- 4.4. Market Entropy
- 4.5. Patent/Trademark Analysis
- 5. Global Asia Pacific Green Cement Market Analysis, Insights and Forecast, 2019-2031
- 5.1. Market Analysis, Insights and Forecast - by Product Type
- 5.1.1. Fly Ash-based
- 5.1.2. Slag-based
- 5.1.3. Limestone-based
- 5.1.4. Silica fume-based
- 5.1.5. Other Pr
- 5.2. Market Analysis, Insights and Forecast - by Construction Sector
- 5.2.1. Residential
- 5.2.2. Non-residential
- 5.3. Market Analysis, Insights and Forecast - by Geography
- 5.3.1. China
- 5.3.2. India
- 5.3.3. Japan
- 5.3.4. South Korea
- 5.3.5. Malaysia
- 5.3.6. Thailand
- 5.3.7. Indonesia
- 5.3.8. Vietnam
- 5.3.9. Rest of Asia-Pacific
- 5.4. Market Analysis, Insights and Forecast - by Region
- 5.4.1. China
- 5.4.2. India
- 5.4.3. Japan
- 5.4.4. South Korea
- 5.4.5. Malaysia
- 5.4.6. Thailand
- 5.4.7. Indonesia
- 5.4.8. Vietnam
- 5.4.9. Rest of Asia Pacific
- 5.1. Market Analysis, Insights and Forecast - by Product Type
- 6. China Asia Pacific Green Cement Market Analysis, Insights and Forecast, 2019-2031
- 6.1. Market Analysis, Insights and Forecast - by Product Type
- 6.1.1. Fly Ash-based
- 6.1.2. Slag-based
- 6.1.3. Limestone-based
- 6.1.4. Silica fume-based
- 6.1.5. Other Pr
- 6.2. Market Analysis, Insights and Forecast - by Construction Sector
- 6.2.1. Residential
- 6.2.2. Non-residential
- 6.3. Market Analysis, Insights and Forecast - by Geography
- 6.3.1. China
- 6.3.2. India
- 6.3.3. Japan
- 6.3.4. South Korea
- 6.3.5. Malaysia
- 6.3.6. Thailand
- 6.3.7. Indonesia
- 6.3.8. Vietnam
- 6.3.9. Rest of Asia-Pacific
- 6.1. Market Analysis, Insights and Forecast - by Product Type
- 7. India Asia Pacific Green Cement Market Analysis, Insights and Forecast, 2019-2031
- 7.1. Market Analysis, Insights and Forecast - by Product Type
- 7.1.1. Fly Ash-based
- 7.1.2. Slag-based
- 7.1.3. Limestone-based
- 7.1.4. Silica fume-based
- 7.1.5. Other Pr
- 7.2. Market Analysis, Insights and Forecast - by Construction Sector
- 7.2.1. Residential
- 7.2.2. Non-residential
- 7.3. Market Analysis, Insights and Forecast - by Geography
- 7.3.1. China
- 7.3.2. India
- 7.3.3. Japan
- 7.3.4. South Korea
- 7.3.5. Malaysia
- 7.3.6. Thailand
- 7.3.7. Indonesia
- 7.3.8. Vietnam
- 7.3.9. Rest of Asia-Pacific
- 7.1. Market Analysis, Insights and Forecast - by Product Type
- 8. Japan Asia Pacific Green Cement Market Analysis, Insights and Forecast, 2019-2031
- 8.1. Market Analysis, Insights and Forecast - by Product Type
- 8.1.1. Fly Ash-based
- 8.1.2. Slag-based
- 8.1.3. Limestone-based
- 8.1.4. Silica fume-based
- 8.1.5. Other Pr
- 8.2. Market Analysis, Insights and Forecast - by Construction Sector
- 8.2.1. Residential
- 8.2.2. Non-residential
- 8.3. Market Analysis, Insights and Forecast - by Geography
- 8.3.1. China
- 8.3.2. India
- 8.3.3. Japan
- 8.3.4. South Korea
- 8.3.5. Malaysia
- 8.3.6. Thailand
- 8.3.7. Indonesia
- 8.3.8. Vietnam
- 8.3.9. Rest of Asia-Pacific
- 8.1. Market Analysis, Insights and Forecast - by Product Type
- 9. South Korea Asia Pacific Green Cement Market Analysis, Insights and Forecast, 2019-2031
- 9.1. Market Analysis, Insights and Forecast - by Product Type
- 9.1.1. Fly Ash-based
- 9.1.2. Slag-based
- 9.1.3. Limestone-based
- 9.1.4. Silica fume-based
- 9.1.5. Other Pr
- 9.2. Market Analysis, Insights and Forecast - by Construction Sector
- 9.2.1. Residential
- 9.2.2. Non-residential
- 9.3. Market Analysis, Insights and Forecast - by Geography
- 9.3.1. China
- 9.3.2. India
- 9.3.3. Japan
- 9.3.4. South Korea
- 9.3.5. Malaysia
- 9.3.6. Thailand
- 9.3.7. Indonesia
- 9.3.8. Vietnam
- 9.3.9. Rest of Asia-Pacific
- 9.1. Market Analysis, Insights and Forecast - by Product Type
- 10. Malaysia Asia Pacific Green Cement Market Analysis, Insights and Forecast, 2019-2031
- 10.1. Market Analysis, Insights and Forecast - by Product Type
- 10.1.1. Fly Ash-based
- 10.1.2. Slag-based
- 10.1.3. Limestone-based
- 10.1.4. Silica fume-based
- 10.1.5. Other Pr
- 10.2. Market Analysis, Insights and Forecast - by Construction Sector
- 10.2.1. Residential
- 10.2.2. Non-residential
- 10.3. Market Analysis, Insights and Forecast - by Geography
- 10.3.1. China
- 10.3.2. India
- 10.3.3. Japan
- 10.3.4. South Korea
- 10.3.5. Malaysia
- 10.3.6. Thailand
- 10.3.7. Indonesia
- 10.3.8. Vietnam
- 10.3.9. Rest of Asia-Pacific
- 10.1. Market Analysis, Insights and Forecast - by Product Type
- 11. Thailand Asia Pacific Green Cement Market Analysis, Insights and Forecast, 2019-2031
- 11.1. Market Analysis, Insights and Forecast - by Product Type
- 11.1.1. Fly Ash-based
- 11.1.2. Slag-based
- 11.1.3. Limestone-based
- 11.1.4. Silica fume-based
- 11.1.5. Other Pr
- 11.2. Market Analysis, Insights and Forecast - by Construction Sector
- 11.2.1. Residential
- 11.2.2. Non-residential
- 11.3. Market Analysis, Insights and Forecast - by Geography
- 11.3.1. China
- 11.3.2. India
- 11.3.3. Japan
- 11.3.4. South Korea
- 11.3.5. Malaysia
- 11.3.6. Thailand
- 11.3.7. Indonesia
- 11.3.8. Vietnam
- 11.3.9. Rest of Asia-Pacific
- 11.1. Market Analysis, Insights and Forecast - by Product Type
- 12. Indonesia Asia Pacific Green Cement Market Analysis, Insights and Forecast, 2019-2031
- 12.1. Market Analysis, Insights and Forecast - by Product Type
- 12.1.1. Fly Ash-based
- 12.1.2. Slag-based
- 12.1.3. Limestone-based
- 12.1.4. Silica fume-based
- 12.1.5. Other Pr
- 12.2. Market Analysis, Insights and Forecast - by Construction Sector
- 12.2.1. Residential
- 12.2.2. Non-residential
- 12.3. Market Analysis, Insights and Forecast - by Geography
- 12.3.1. China
- 12.3.2. India
- 12.3.3. Japan
- 12.3.4. South Korea
- 12.3.5. Malaysia
- 12.3.6. Thailand
- 12.3.7. Indonesia
- 12.3.8. Vietnam
- 12.3.9. Rest of Asia-Pacific
- 12.1. Market Analysis, Insights and Forecast - by Product Type
- 13. Vietnam Asia Pacific Green Cement Market Analysis, Insights and Forecast, 2019-2031
- 13.1. Market Analysis, Insights and Forecast - by Product Type
- 13.1.1. Fly Ash-based
- 13.1.2. Slag-based
- 13.1.3. Limestone-based
- 13.1.4. Silica fume-based
- 13.1.5. Other Pr
- 13.2. Market Analysis, Insights and Forecast - by Construction Sector
- 13.2.1. Residential
- 13.2.2. Non-residential
- 13.3. Market Analysis, Insights and Forecast - by Geography
- 13.3.1. China
- 13.3.2. India
- 13.3.3. Japan
- 13.3.4. South Korea
- 13.3.5. Malaysia
- 13.3.6. Thailand
- 13.3.7. Indonesia
- 13.3.8. Vietnam
- 13.3.9. Rest of Asia-Pacific
- 13.1. Market Analysis, Insights and Forecast - by Product Type
- 14. Rest of Asia Pacific Asia Pacific Green Cement Market Analysis, Insights and Forecast, 2019-2031
- 14.1. Market Analysis, Insights and Forecast - by Product Type
- 14.1.1. Fly Ash-based
- 14.1.2. Slag-based
- 14.1.3. Limestone-based
- 14.1.4. Silica fume-based
- 14.1.5. Other Pr
- 14.2. Market Analysis, Insights and Forecast - by Construction Sector
- 14.2.1. Residential
- 14.2.2. Non-residential
- 14.3. Market Analysis, Insights and Forecast - by Geography
- 14.3.1. China
- 14.3.2. India
- 14.3.3. Japan
- 14.3.4. South Korea
- 14.3.5. Malaysia
- 14.3.6. Thailand
- 14.3.7. Indonesia
- 14.3.8. Vietnam
- 14.3.9. Rest of Asia-Pacific
- 14.1. Market Analysis, Insights and Forecast - by Product Type
- 15. Competitive Analysis
- 15.1. Global Market Share Analysis 2024
- 15.2. Company Profiles
- 15.2.1 Cementir Holding N V
- 15.2.1.1. Overview
- 15.2.1.2. Products
- 15.2.1.3. SWOT Analysis
- 15.2.1.4. Recent Developments
- 15.2.1.5. Financials (Based on Availability)
- 15.2.2 CEMEX S A B d e C V
- 15.2.2.1. Overview
- 15.2.2.2. Products
- 15.2.2.3. SWOT Analysis
- 15.2.2.4. Recent Developments
- 15.2.2.5. Financials (Based on Availability)
- 15.2.3 Hallett Group
- 15.2.3.1. Overview
- 15.2.3.2. Products
- 15.2.3.3. SWOT Analysis
- 15.2.3.4. Recent Developments
- 15.2.3.5. Financials (Based on Availability)
- 15.2.4 HOLCIM
- 15.2.4.1. Overview
- 15.2.4.2. Products
- 15.2.4.3. SWOT Analysis
- 15.2.4.4. Recent Developments
- 15.2.4.5. Financials (Based on Availability)
- 15.2.5 Hoffmann Green Cement Technologies
- 15.2.5.1. Overview
- 15.2.5.2. Products
- 15.2.5.3. SWOT Analysis
- 15.2.5.4. Recent Developments
- 15.2.5.5. Financials (Based on Availability)
- 15.2.6 Heidelberg Materials
- 15.2.6.1. Overview
- 15.2.6.2. Products
- 15.2.6.3. SWOT Analysis
- 15.2.6.4. Recent Developments
- 15.2.6.5. Financials (Based on Availability)
- 15.2.7 JSW Cement
- 15.2.7.1. Overview
- 15.2.7.2. Products
- 15.2.7.3. SWOT Analysis
- 15.2.7.4. Recent Developments
- 15.2.7.5. Financials (Based on Availability)
- 15.2.8 Kiran Global Chem Limited
- 15.2.8.1. Overview
- 15.2.8.2. Products
- 15.2.8.3. SWOT Analysis
- 15.2.8.4. Recent Developments
- 15.2.8.5. Financials (Based on Availability)
- 15.2.9 Navrattan Group
- 15.2.9.1. Overview
- 15.2.9.2. Products
- 15.2.9.3. SWOT Analysis
- 15.2.9.4. Recent Developments
- 15.2.9.5. Financials (Based on Availability)
- 15.2.10 TAIHEIYO CEMENT CORPORATION
- 15.2.10.1. Overview
- 15.2.10.2. Products
- 15.2.10.3. SWOT Analysis
- 15.2.10.4. Recent Developments
- 15.2.10.5. Financials (Based on Availability)
- 15.2.11 UltraTech Cement Ltd
- 15.2.11.1. Overview
- 15.2.11.2. Products
- 15.2.11.3. SWOT Analysis
- 15.2.11.4. Recent Developments
- 15.2.11.5. Financials (Based on Availability)
- 15.2.12 Votorantim Cimentos*List Not Exhaustive
- 15.2.12.1. Overview
- 15.2.12.2. Products
- 15.2.12.3. SWOT Analysis
- 15.2.12.4. Recent Developments
- 15.2.12.5. Financials (Based on Availability)
- 15.2.1 Cementir Holding N V
List of Figures
- Figure 1: Global Asia Pacific Green Cement Market Revenue Breakdown (Million, %) by Region 2024 & 2032
- Figure 2: China Asia Pacific Green Cement Market Revenue (Million), by Product Type 2024 & 2032
- Figure 3: China Asia Pacific Green Cement Market Revenue Share (%), by Product Type 2024 & 2032
- Figure 4: China Asia Pacific Green Cement Market Revenue (Million), by Construction Sector 2024 & 2032
- Figure 5: China Asia Pacific Green Cement Market Revenue Share (%), by Construction Sector 2024 & 2032
- Figure 6: China Asia Pacific Green Cement Market Revenue (Million), by Geography 2024 & 2032
- Figure 7: China Asia Pacific Green Cement Market Revenue Share (%), by Geography 2024 & 2032
- Figure 8: China Asia Pacific Green Cement Market Revenue (Million), by Country 2024 & 2032
- Figure 9: China Asia Pacific Green Cement Market Revenue Share (%), by Country 2024 & 2032
- Figure 10: India Asia Pacific Green Cement Market Revenue (Million), by Product Type 2024 & 2032
- Figure 11: India Asia Pacific Green Cement Market Revenue Share (%), by Product Type 2024 & 2032
- Figure 12: India Asia Pacific Green Cement Market Revenue (Million), by Construction Sector 2024 & 2032
- Figure 13: India Asia Pacific Green Cement Market Revenue Share (%), by Construction Sector 2024 & 2032
- Figure 14: India Asia Pacific Green Cement Market Revenue (Million), by Geography 2024 & 2032
- Figure 15: India Asia Pacific Green Cement Market Revenue Share (%), by Geography 2024 & 2032
- Figure 16: India Asia Pacific Green Cement Market Revenue (Million), by Country 2024 & 2032
- Figure 17: India Asia Pacific Green Cement Market Revenue Share (%), by Country 2024 & 2032
- Figure 18: Japan Asia Pacific Green Cement Market Revenue (Million), by Product Type 2024 & 2032
- Figure 19: Japan Asia Pacific Green Cement Market Revenue Share (%), by Product Type 2024 & 2032
- Figure 20: Japan Asia Pacific Green Cement Market Revenue (Million), by Construction Sector 2024 & 2032
- Figure 21: Japan Asia Pacific Green Cement Market Revenue Share (%), by Construction Sector 2024 & 2032
- Figure 22: Japan Asia Pacific Green Cement Market Revenue (Million), by Geography 2024 & 2032
- Figure 23: Japan Asia Pacific Green Cement Market Revenue Share (%), by Geography 2024 & 2032
- Figure 24: Japan Asia Pacific Green Cement Market Revenue (Million), by Country 2024 & 2032
- Figure 25: Japan Asia Pacific Green Cement Market Revenue Share (%), by Country 2024 & 2032
- Figure 26: South Korea Asia Pacific Green Cement Market Revenue (Million), by Product Type 2024 & 2032
- Figure 27: South Korea Asia Pacific Green Cement Market Revenue Share (%), by Product Type 2024 & 2032
- Figure 28: South Korea Asia Pacific Green Cement Market Revenue (Million), by Construction Sector 2024 & 2032
- Figure 29: South Korea Asia Pacific Green Cement Market Revenue Share (%), by Construction Sector 2024 & 2032
- Figure 30: South Korea Asia Pacific Green Cement Market Revenue (Million), by Geography 2024 & 2032
- Figure 31: South Korea Asia Pacific Green Cement Market Revenue Share (%), by Geography 2024 & 2032
- Figure 32: South Korea Asia Pacific Green Cement Market Revenue (Million), by Country 2024 & 2032
- Figure 33: South Korea Asia Pacific Green Cement Market Revenue Share (%), by Country 2024 & 2032
- Figure 34: Malaysia Asia Pacific Green Cement Market Revenue (Million), by Product Type 2024 & 2032
- Figure 35: Malaysia Asia Pacific Green Cement Market Revenue Share (%), by Product Type 2024 & 2032
- Figure 36: Malaysia Asia Pacific Green Cement Market Revenue (Million), by Construction Sector 2024 & 2032
- Figure 37: Malaysia Asia Pacific Green Cement Market Revenue Share (%), by Construction Sector 2024 & 2032
- Figure 38: Malaysia Asia Pacific Green Cement Market Revenue (Million), by Geography 2024 & 2032
- Figure 39: Malaysia Asia Pacific Green Cement Market Revenue Share (%), by Geography 2024 & 2032
- Figure 40: Malaysia Asia Pacific Green Cement Market Revenue (Million), by Country 2024 & 2032
- Figure 41: Malaysia Asia Pacific Green Cement Market Revenue Share (%), by Country 2024 & 2032
- Figure 42: Thailand Asia Pacific Green Cement Market Revenue (Million), by Product Type 2024 & 2032
- Figure 43: Thailand Asia Pacific Green Cement Market Revenue Share (%), by Product Type 2024 & 2032
- Figure 44: Thailand Asia Pacific Green Cement Market Revenue (Million), by Construction Sector 2024 & 2032
- Figure 45: Thailand Asia Pacific Green Cement Market Revenue Share (%), by Construction Sector 2024 & 2032
- Figure 46: Thailand Asia Pacific Green Cement Market Revenue (Million), by Geography 2024 & 2032
- Figure 47: Thailand Asia Pacific Green Cement Market Revenue Share (%), by Geography 2024 & 2032
- Figure 48: Thailand Asia Pacific Green Cement Market Revenue (Million), by Country 2024 & 2032
- Figure 49: Thailand Asia Pacific Green Cement Market Revenue Share (%), by Country 2024 & 2032
- Figure 50: Indonesia Asia Pacific Green Cement Market Revenue (Million), by Product Type 2024 & 2032
- Figure 51: Indonesia Asia Pacific Green Cement Market Revenue Share (%), by Product Type 2024 & 2032
- Figure 52: Indonesia Asia Pacific Green Cement Market Revenue (Million), by Construction Sector 2024 & 2032
- Figure 53: Indonesia Asia Pacific Green Cement Market Revenue Share (%), by Construction Sector 2024 & 2032
- Figure 54: Indonesia Asia Pacific Green Cement Market Revenue (Million), by Geography 2024 & 2032
- Figure 55: Indonesia Asia Pacific Green Cement Market Revenue Share (%), by Geography 2024 & 2032
- Figure 56: Indonesia Asia Pacific Green Cement Market Revenue (Million), by Country 2024 & 2032
- Figure 57: Indonesia Asia Pacific Green Cement Market Revenue Share (%), by Country 2024 & 2032
- Figure 58: Vietnam Asia Pacific Green Cement Market Revenue (Million), by Product Type 2024 & 2032
- Figure 59: Vietnam Asia Pacific Green Cement Market Revenue Share (%), by Product Type 2024 & 2032
- Figure 60: Vietnam Asia Pacific Green Cement Market Revenue (Million), by Construction Sector 2024 & 2032
- Figure 61: Vietnam Asia Pacific Green Cement Market Revenue Share (%), by Construction Sector 2024 & 2032
- Figure 62: Vietnam Asia Pacific Green Cement Market Revenue (Million), by Geography 2024 & 2032
- Figure 63: Vietnam Asia Pacific Green Cement Market Revenue Share (%), by Geography 2024 & 2032
- Figure 64: Vietnam Asia Pacific Green Cement Market Revenue (Million), by Country 2024 & 2032
- Figure 65: Vietnam Asia Pacific Green Cement Market Revenue Share (%), by Country 2024 & 2032
- Figure 66: Rest of Asia Pacific Asia Pacific Green Cement Market Revenue (Million), by Product Type 2024 & 2032
- Figure 67: Rest of Asia Pacific Asia Pacific Green Cement Market Revenue Share (%), by Product Type 2024 & 2032
- Figure 68: Rest of Asia Pacific Asia Pacific Green Cement Market Revenue (Million), by Construction Sector 2024 & 2032
- Figure 69: Rest of Asia Pacific Asia Pacific Green Cement Market Revenue Share (%), by Construction Sector 2024 & 2032
- Figure 70: Rest of Asia Pacific Asia Pacific Green Cement Market Revenue (Million), by Geography 2024 & 2032
- Figure 71: Rest of Asia Pacific Asia Pacific Green Cement Market Revenue Share (%), by Geography 2024 & 2032
- Figure 72: Rest of Asia Pacific Asia Pacific Green Cement Market Revenue (Million), by Country 2024 & 2032
- Figure 73: Rest of Asia Pacific Asia Pacific Green Cement Market Revenue Share (%), by Country 2024 & 2032
List of Tables
- Table 1: Global Asia Pacific Green Cement Market Revenue Million Forecast, by Region 2019 & 2032
- Table 2: Global Asia Pacific Green Cement Market Revenue Million Forecast, by Product Type 2019 & 2032
- Table 3: Global Asia Pacific Green Cement Market Revenue Million Forecast, by Construction Sector 2019 & 2032
- Table 4: Global Asia Pacific Green Cement Market Revenue Million Forecast, by Geography 2019 & 2032
- Table 5: Global Asia Pacific Green Cement Market Revenue Million Forecast, by Region 2019 & 2032
- Table 6: Global Asia Pacific Green Cement Market Revenue Million Forecast, by Product Type 2019 & 2032
- Table 7: Global Asia Pacific Green Cement Market Revenue Million Forecast, by Construction Sector 2019 & 2032
- Table 8: Global Asia Pacific Green Cement Market Revenue Million Forecast, by Geography 2019 & 2032
- Table 9: Global Asia Pacific Green Cement Market Revenue Million Forecast, by Country 2019 & 2032
- Table 10: Global Asia Pacific Green Cement Market Revenue Million Forecast, by Product Type 2019 & 2032
- Table 11: Global Asia Pacific Green Cement Market Revenue Million Forecast, by Construction Sector 2019 & 2032
- Table 12: Global Asia Pacific Green Cement Market Revenue Million Forecast, by Geography 2019 & 2032
- Table 13: Global Asia Pacific Green Cement Market Revenue Million Forecast, by Country 2019 & 2032
- Table 14: Global Asia Pacific Green Cement Market Revenue Million Forecast, by Product Type 2019 & 2032
- Table 15: Global Asia Pacific Green Cement Market Revenue Million Forecast, by Construction Sector 2019 & 2032
- Table 16: Global Asia Pacific Green Cement Market Revenue Million Forecast, by Geography 2019 & 2032
- Table 17: Global Asia Pacific Green Cement Market Revenue Million Forecast, by Country 2019 & 2032
- Table 18: Global Asia Pacific Green Cement Market Revenue Million Forecast, by Product Type 2019 & 2032
- Table 19: Global Asia Pacific Green Cement Market Revenue Million Forecast, by Construction Sector 2019 & 2032
- Table 20: Global Asia Pacific Green Cement Market Revenue Million Forecast, by Geography 2019 & 2032
- Table 21: Global Asia Pacific Green Cement Market Revenue Million Forecast, by Country 2019 & 2032
- Table 22: Global Asia Pacific Green Cement Market Revenue Million Forecast, by Product Type 2019 & 2032
- Table 23: Global Asia Pacific Green Cement Market Revenue Million Forecast, by Construction Sector 2019 & 2032
- Table 24: Global Asia Pacific Green Cement Market Revenue Million Forecast, by Geography 2019 & 2032
- Table 25: Global Asia Pacific Green Cement Market Revenue Million Forecast, by Country 2019 & 2032
- Table 26: Global Asia Pacific Green Cement Market Revenue Million Forecast, by Product Type 2019 & 2032
- Table 27: Global Asia Pacific Green Cement Market Revenue Million Forecast, by Construction Sector 2019 & 2032
- Table 28: Global Asia Pacific Green Cement Market Revenue Million Forecast, by Geography 2019 & 2032
- Table 29: Global Asia Pacific Green Cement Market Revenue Million Forecast, by Country 2019 & 2032
- Table 30: Global Asia Pacific Green Cement Market Revenue Million Forecast, by Product Type 2019 & 2032
- Table 31: Global Asia Pacific Green Cement Market Revenue Million Forecast, by Construction Sector 2019 & 2032
- Table 32: Global Asia Pacific Green Cement Market Revenue Million Forecast, by Geography 2019 & 2032
- Table 33: Global Asia Pacific Green Cement Market Revenue Million Forecast, by Country 2019 & 2032
- Table 34: Global Asia Pacific Green Cement Market Revenue Million Forecast, by Product Type 2019 & 2032
- Table 35: Global Asia Pacific Green Cement Market Revenue Million Forecast, by Construction Sector 2019 & 2032
- Table 36: Global Asia Pacific Green Cement Market Revenue Million Forecast, by Geography 2019 & 2032
- Table 37: Global Asia Pacific Green Cement Market Revenue Million Forecast, by Country 2019 & 2032
- Table 38: Global Asia Pacific Green Cement Market Revenue Million Forecast, by Product Type 2019 & 2032
- Table 39: Global Asia Pacific Green Cement Market Revenue Million Forecast, by Construction Sector 2019 & 2032
- Table 40: Global Asia Pacific Green Cement Market Revenue Million Forecast, by Geography 2019 & 2032
- Table 41: Global Asia Pacific Green Cement Market Revenue Million Forecast, by Country 2019 & 2032
Frequently Asked Questions
1. What is the projected Compound Annual Growth Rate (CAGR) of the Asia Pacific Green Cement Market?
The projected CAGR is approximately > 10.00%.
2. Which companies are prominent players in the Asia Pacific Green Cement Market?
Key companies in the market include Cementir Holding N V, CEMEX S A B d e C V, Hallett Group, HOLCIM, Hoffmann Green Cement Technologies, Heidelberg Materials, JSW Cement, Kiran Global Chem Limited, Navrattan Group, TAIHEIYO CEMENT CORPORATION, UltraTech Cement Ltd, Votorantim Cimentos*List Not Exhaustive.
3. What are the main segments of the Asia Pacific Green Cement Market?
The market segments include Product Type, Construction Sector, Geography.
4. Can you provide details about the market size?
The market size is estimated to be USD XX Million as of 2022.
5. What are some drivers contributing to market growth?
Growing Construction Activities In China and India; Favorable Government Policies for Green Building Construction; Abundance of Availability of Raw Materials.
6. What are the notable trends driving market growth?
Residential Construction to Dominate the Market.
7. Are there any restraints impacting market growth?
Growing Construction Activities In China and India; Favorable Government Policies for Green Building Construction; Abundance of Availability of Raw Materials.
8. Can you provide examples of recent developments in the market?
December 2023: Hoffmann Green Cement Technologies announced that the partnership contract signed in 2021 with the Center Scientifique et Technique du Bâtiment (CSTB) was extended for a further three years.
9. What pricing options are available for accessing the report?
Pricing options include single-user, multi-user, and enterprise licenses priced at USD 4750, USD 5250, and USD 8750 respectively.
10. Is the market size provided in terms of value or volume?
The market size is provided in terms of value, measured in Million.
11. Are there any specific market keywords associated with the report?
Yes, the market keyword associated with the report is "Asia Pacific Green Cement Market," which aids in identifying and referencing the specific market segment covered.
12. How do I determine which pricing option suits my needs best?
The pricing options vary based on user requirements and access needs. Individual users may opt for single-user licenses, while businesses requiring broader access may choose multi-user or enterprise licenses for cost-effective access to the report.
13. Are there any additional resources or data provided in the Asia Pacific Green Cement Market report?
While the report offers comprehensive insights, it's advisable to review the specific contents or supplementary materials provided to ascertain if additional resources or data are available.
14. How can I stay updated on further developments or reports in the Asia Pacific Green Cement Market?
To stay informed about further developments, trends, and reports in the Asia Pacific Green Cement Market, consider subscribing to industry newsletters, following relevant companies and organizations, or regularly checking reputable industry news sources and publications.
Methodology
Step 1 - Identification of Relevant Samples Size from Population Database


Step 2 - Approaches for Defining Global Market Size (Value, Volume* & Price*)

Note*: In applicable scenarios
Step 3 - Data Sources
Primary Research
- Web Analytics
- Survey Reports
- Research Institute
- Latest Research Reports
- Opinion Leaders
Secondary Research
- Annual Reports
- White Paper
- Latest Press Release
- Industry Association
- Paid Database
- Investor Presentations

Step 4 - Data Triangulation
Involves using different sources of information in order to increase the validity of a study
These sources are likely to be stakeholders in a program - participants, other researchers, program staff, other community members, and so on.
Then we put all data in single framework & apply various statistical tools to find out the dynamic on the market.
During the analysis stage, feedback from the stakeholder groups would be compared to determine areas of agreement as well as areas of divergence


