

Key Insights
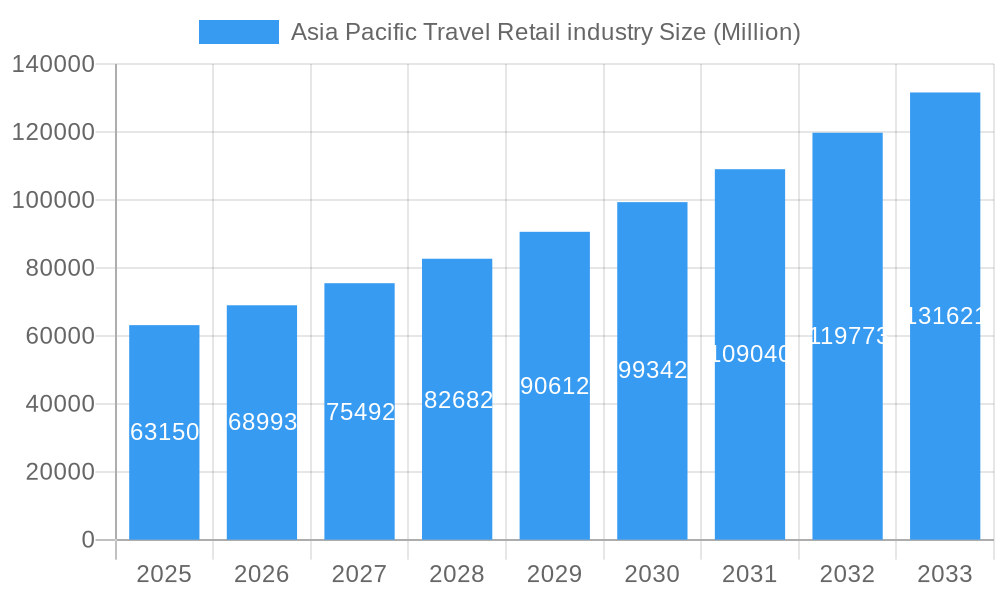
The Asia Pacific travel retail market, valued at $63.15 billion in 2025, is projected to experience robust growth, driven by a compound annual growth rate (CAGR) of 9.21% from 2025 to 2033. This expansion is fueled by several key factors. Firstly, the region's burgeoning middle class, coupled with rising disposable incomes, is significantly increasing outbound tourism. Secondly, the continuous development of high-quality airport infrastructure and improved travel experiences across the Asia Pacific are attracting more international and domestic travelers, boosting sales. The increasing popularity of online pre-ordering and personalized shopping experiences within duty-free stores further enhances market growth. Furthermore, the strategic partnerships and expansion strategies of major players such as Dufry, China Duty Free Group, and DFS Group contribute to market expansion. However, factors like economic downturns, geopolitical instability, and fluctuations in currency exchange rates pose potential challenges.
Asia Pacific Travel Retail industry Market Size (In Billion)
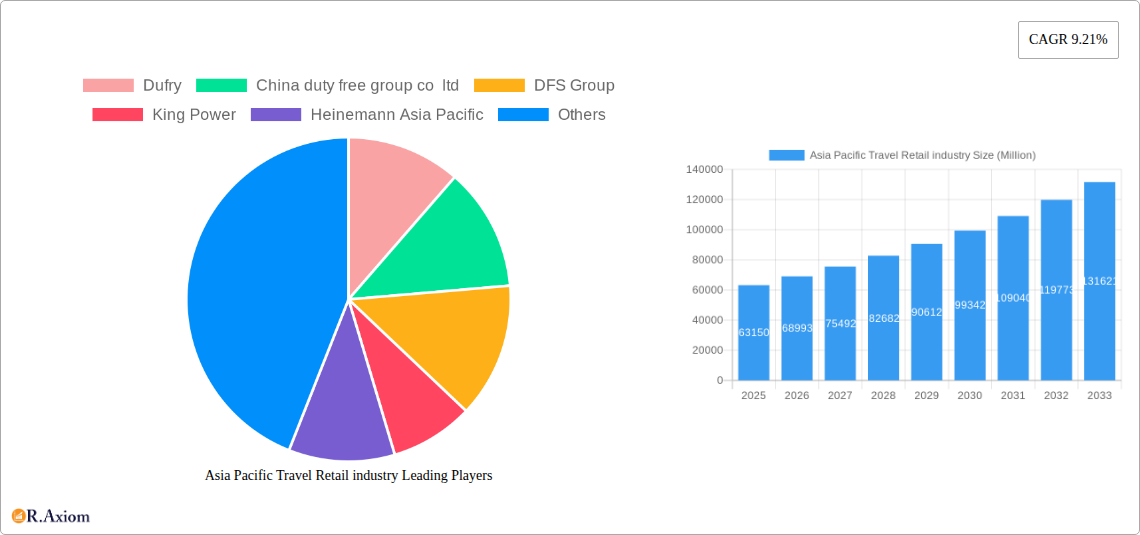
The competitive landscape is highly concentrated, with major players like Dufry, China Duty Free Group Co Ltd, DFS Group, King Power, and Lotte Duty Free dominating the market. These companies leverage their extensive networks, strong brand recognition, and diverse product portfolios to maintain their market leadership. Despite this concentration, opportunities exist for smaller players to carve out niches by focusing on specific product categories, catering to particular traveler demographics, or leveraging innovative technology to enhance the shopping experience. Future growth will likely be shaped by evolving consumer preferences, technological advancements, and the effective management of supply chain challenges. The market segmentation will likely see growth in luxury goods, cosmetics, and alcohol, while the focus on sustainability and responsible sourcing will gain traction. The ongoing expansion of airport retail spaces and the development of innovative retail formats will further stimulate market growth throughout the forecast period.
Asia Pacific Travel Retail industry Company Market Share
Asia Pacific Travel Retail Industry: Market Analysis & Forecast (2019-2033)
This comprehensive report provides an in-depth analysis of the Asia Pacific travel retail industry, covering market size, growth drivers, key players, emerging trends, and future prospects. The study period spans from 2019 to 2033, with 2025 as the base and estimated year. This report is invaluable for industry stakeholders, investors, and businesses seeking to understand and capitalize on the opportunities within this dynamic market. The report leverages data from the historical period (2019-2024) and projects the market's trajectory from 2025 to 2033. Expected market value for 2025 is estimated at xx Million.
Asia Pacific Travel Retail Industry Market Concentration & Innovation
The Asia Pacific travel retail market exhibits a moderately concentrated landscape, with a few dominant players controlling significant market share. Key players such as Dufry, China Duty Free Group Co Ltd, DFS Group, and King Power hold substantial positions, while regional players like Heinemann Asia Pacific, Lotte Duty Free, The Shilla Duty Free, Flemingo International, James Richardson Group, and The Nuance Group contribute significantly to the overall market dynamics. Market share fluctuations are observed due to strategic acquisitions, expansions, and varying regional performances. Mergers and acquisitions (M&A) activity has played a crucial role in shaping the market landscape. For example, a significant M&A deal in 2022 (xx Million) further consolidated the market's leadership structure.
- Market Concentration: The top 5 players account for approximately xx% of the total market share in 2025.
- Innovation Drivers: E-commerce integration, personalized experiences, and sustainable practices are key innovation drivers.
- Regulatory Frameworks: Varying regulations across countries in the Asia-Pacific region impact operations and require adaptive strategies.
- Product Substitutes: Online shopping and local retail outlets offer some level of substitution, particularly for certain product categories.
- End-User Trends: Growing preference for premium products, personalized shopping experiences, and duty-free convenience are shaping consumer behavior.
- M&A Activity: Consolidation through M&A is a prominent trend, with significant deals driving market share shifts in recent years (xx Million in 2022, xx Million in 2023).
Asia Pacific Travel Retail Industry Industry Trends & Insights
The Asia Pacific travel retail market is experiencing robust growth, driven by several factors. The Compound Annual Growth Rate (CAGR) is projected to be xx% during the forecast period (2025-2033). Increased tourist arrivals, particularly from emerging economies, contribute significantly. Technological advancements, especially in digital platforms and personalized marketing, are transforming the industry. The market penetration of online duty-free platforms is steadily increasing. Consumers increasingly demand seamless, personalized shopping experiences, which influences business strategies. Intense competition amongst major players is evident, leading to price wars and continuous innovation.
- Market Growth Drivers: Rising disposable incomes, increasing tourism, and technological disruptions are pushing market expansion.
- Technological Disruptions: Online platforms, mobile payment options, and personalized marketing are reshaping the consumer journey.
- Consumer Preferences: Demand for luxury goods, personalized shopping experiences, and convenience is on the rise.
- Competitive Dynamics: Intense competition between established players and new entrants drives market innovation.
Dominant Markets & Segments in Asia Pacific Travel Retail Industry
The Asia Pacific travel retail market demonstrates a regional variance in dominance. China stands out as the most significant market due to its substantial tourist numbers and robust economic growth. This is amplified by the growth of duty-free shopping zones, such as Hainan Island. Other significant markets include Japan, South Korea, Singapore, and Australia. The Airport segment is the primary contributor to revenue.
- Key Drivers in China:
- High tourist arrivals, both domestic and international.
- Government support for tourism development and duty-free shopping zones.
- Robust economic growth and rising disposable incomes.
- Dominance Analysis: China's scale and rapid economic development clearly establish its position as the leading market, driving overall Asia-Pacific growth.
Asia Pacific Travel Retail Industry Product Developments
Product innovation is a crucial aspect of competitive differentiation. The industry is witnessing trends towards premiumization, personalization, and the introduction of exclusive product lines. Technological advancements, particularly in digital platforms, drive efficiency and enhance customer experience.
Report Scope & Segmentation Analysis
This report segments the market by product category (e.g., perfumes & cosmetics, liquor & tobacco, confectionery), distribution channel (e.g., airports, cruise ships, border shops), and region (e.g., China, Japan, South Korea, Australia). Each segment exhibits distinct growth trajectories and competitive dynamics. Growth projections are presented for each segment based on extensive market analysis. Market size for each segment in 2025 is estimated, with detailed competitive landscapes assessed.
Key Drivers of Asia Pacific Travel Retail Industry Growth
Several factors fuel the industry's growth. The surge in tourism, particularly from emerging Asian economies, significantly impacts market size. Economic growth and rising disposable incomes increase consumer spending on luxury goods. Furthermore, government initiatives supporting tourism and duty-free shopping zones provide a supportive environment for growth.
Challenges in the Asia Pacific Travel Retail Industry Sector
The industry faces several challenges. Varying regulatory frameworks across different countries create operational complexities. Geopolitical uncertainties and economic downturns can disrupt travel patterns, impacting sales. Intense competition forces companies to offer competitive pricing and innovative solutions. Supply chain disruptions, as seen during the recent global events, pose logistical obstacles.
Emerging Opportunities in Asia Pacific Travel Retail Industry
The growth of online duty-free platforms, offering pre-order options and convenient home delivery, presents significant opportunities. Expansion into untapped markets, personalization using data analytics and AI, and exploring sustainable and ethical product sourcing offer further avenues for growth.
Key Developments in Asia Pacific Travel Retail Industry
- October 2023: DFS Group launched a new entertainment and shopping complex on Hainan Island, China, aiming to boost tourism even amidst economic uncertainty.
- July 2023: Lagardère Travel Retail partnered with Inflyter to launch an online duty-free shopping platform, expanding digital sales channels and customer touchpoints.
Strategic Outlook for Asia Pacific Travel Retail Industry Market
The Asia Pacific travel retail market is poised for sustained growth, driven by continued tourism expansion, rising disposable incomes, and technological advancements. Strategic investments in technology, personalized shopping experiences, and sustainable practices will be crucial for success. Expansion into new markets and strategic partnerships will further strengthen market positioning. The industry's future depends on adaptability, innovation, and the ability to leverage technological advancements effectively.
Asia Pacific Travel Retail industry Segmentation
-
1. Product Type
- 1.1. Fashion and Accessories
- 1.2. Jewellery and Watches
- 1.3. Wine & Spirits
- 1.4. Food & Confectionary
- 1.5. Fragnances and Cosmetics
- 1.6. Tobacco
-
2. Distribution Channel
- 2.1. Airports
- 2.2. Airlines
- 2.3. Ferries
-
3. Geography
- 3.1. China
- 3.2. Japan
- 3.3. Korea
- 3.4. India
- 3.5. Australia
- 3.6. Southeast Asia
- 3.7. Rest Of APAC
Asia Pacific Travel Retail industry Segmentation By Geography
- 1. China
- 2. Japan
- 3. Korea
- 4. India
- 5. Australia
- 6. Southeast Asia
- 7. Rest Of APAC
Asia Pacific Travel Retail industry Regional Market Share
Geographic Coverage of Asia Pacific Travel Retail industry
Asia Pacific Travel Retail industry REPORT HIGHLIGHTS
| Aspects | Details |
|---|---|
| Study Period | 2020-2034 |
| Base Year | 2025 |
| Estimated Year | 2026 |
| Forecast Period | 2026-2034 |
| Historical Period | 2020-2025 |
| Growth Rate | CAGR of 9.21% from 2020-2034 |
| Segmentation |
|
Table of Contents
- 1. Introduction
- 1.1. Research Scope
- 1.2. Market Segmentation
- 1.3. Research Objective
- 1.4. Definitions and Assumptions
- 2. Executive Summary
- 2.1. Market Snapshot
- 3. Market Dynamics
- 3.1. Market Drivers
- 3.2. Market Restrains
- 3.3. Market Trends
- 3.4. Market Opportunities
- 4. Market Factor Analysis
- 4.1. Porters Five Forces
- 4.1.1. Bargaining Power of Suppliers
- 4.1.2. Bargaining Power of Buyers
- 4.1.3. Threat of New Entrants
- 4.1.4. Threat of Substitutes
- 4.1.5. Competitive Rivalry
- 4.2. PESTEL analysis
- 4.3. BCG Analysis
- 4.3.1. Stars (High Growth, High Market Share)
- 4.3.2. Cash Cows (Low Growth, High Market Share)
- 4.3.3. Question Mark (High Growth, Low Market Share)
- 4.3.4. Dogs (Low Growth, Low Market Share)
- 4.4. Ansoff Matrix Analysis
- 4.5. Supply Chain Analysis
- 4.6. Regulatory Landscape
- 4.7. Current Market Potential and Opportunity Assessment (TAM–SAM–SOM Framework)
- 4.8. RAX Analyst Note
- 4.1. Porters Five Forces
- 5. Market Analysis, Insights and Forecast 2021-2033
- 5.1. Market Analysis, Insights and Forecast - by Product Type
- 5.1.1. Fashion and Accessories
- 5.1.2. Jewellery and Watches
- 5.1.3. Wine & Spirits
- 5.1.4. Food & Confectionary
- 5.1.5. Fragnances and Cosmetics
- 5.1.6. Tobacco
- 5.2. Market Analysis, Insights and Forecast - by Distribution Channel
- 5.2.1. Airports
- 5.2.2. Airlines
- 5.2.3. Ferries
- 5.3. Market Analysis, Insights and Forecast - by Geography
- 5.3.1. China
- 5.3.2. Japan
- 5.3.3. Korea
- 5.3.4. India
- 5.3.5. Australia
- 5.3.6. Southeast Asia
- 5.3.7. Rest Of APAC
- 5.4. Market Analysis, Insights and Forecast - by Region
- 5.4.1. China
- 5.4.2. Japan
- 5.4.3. Korea
- 5.4.4. India
- 5.4.5. Australia
- 5.4.6. Southeast Asia
- 5.4.7. Rest Of APAC
- 5.1. Market Analysis, Insights and Forecast - by Product Type
- 6. Global Asia Pacific Travel Retail industry Analysis, Insights and Forecast, 2021-2033
- 6.1. Market Analysis, Insights and Forecast - by Product Type
- 6.1.1. Fashion and Accessories
- 6.1.2. Jewellery and Watches
- 6.1.3. Wine & Spirits
- 6.1.4. Food & Confectionary
- 6.1.5. Fragnances and Cosmetics
- 6.1.6. Tobacco
- 6.2. Market Analysis, Insights and Forecast - by Distribution Channel
- 6.2.1. Airports
- 6.2.2. Airlines
- 6.2.3. Ferries
- 6.3. Market Analysis, Insights and Forecast - by Geography
- 6.3.1. China
- 6.3.2. Japan
- 6.3.3. Korea
- 6.3.4. India
- 6.3.5. Australia
- 6.3.6. Southeast Asia
- 6.3.7. Rest Of APAC
- 6.1. Market Analysis, Insights and Forecast - by Product Type
- 7. China Asia Pacific Travel Retail industry Analysis, Insights and Forecast, 2020-2032
- 7.1. Market Analysis, Insights and Forecast - by Product Type
- 7.1.1. Fashion and Accessories
- 7.1.2. Jewellery and Watches
- 7.1.3. Wine & Spirits
- 7.1.4. Food & Confectionary
- 7.1.5. Fragnances and Cosmetics
- 7.1.6. Tobacco
- 7.2. Market Analysis, Insights and Forecast - by Distribution Channel
- 7.2.1. Airports
- 7.2.2. Airlines
- 7.2.3. Ferries
- 7.3. Market Analysis, Insights and Forecast - by Geography
- 7.3.1. China
- 7.3.2. Japan
- 7.3.3. Korea
- 7.3.4. India
- 7.3.5. Australia
- 7.3.6. Southeast Asia
- 7.3.7. Rest Of APAC
- 7.1. Market Analysis, Insights and Forecast - by Product Type
- 8. Japan Asia Pacific Travel Retail industry Analysis, Insights and Forecast, 2020-2032
- 8.1. Market Analysis, Insights and Forecast - by Product Type
- 8.1.1. Fashion and Accessories
- 8.1.2. Jewellery and Watches
- 8.1.3. Wine & Spirits
- 8.1.4. Food & Confectionary
- 8.1.5. Fragnances and Cosmetics
- 8.1.6. Tobacco
- 8.2. Market Analysis, Insights and Forecast - by Distribution Channel
- 8.2.1. Airports
- 8.2.2. Airlines
- 8.2.3. Ferries
- 8.3. Market Analysis, Insights and Forecast - by Geography
- 8.3.1. China
- 8.3.2. Japan
- 8.3.3. Korea
- 8.3.4. India
- 8.3.5. Australia
- 8.3.6. Southeast Asia
- 8.3.7. Rest Of APAC
- 8.1. Market Analysis, Insights and Forecast - by Product Type
- 9. Korea Asia Pacific Travel Retail industry Analysis, Insights and Forecast, 2020-2032
- 9.1. Market Analysis, Insights and Forecast - by Product Type
- 9.1.1. Fashion and Accessories
- 9.1.2. Jewellery and Watches
- 9.1.3. Wine & Spirits
- 9.1.4. Food & Confectionary
- 9.1.5. Fragnances and Cosmetics
- 9.1.6. Tobacco
- 9.2. Market Analysis, Insights and Forecast - by Distribution Channel
- 9.2.1. Airports
- 9.2.2. Airlines
- 9.2.3. Ferries
- 9.3. Market Analysis, Insights and Forecast - by Geography
- 9.3.1. China
- 9.3.2. Japan
- 9.3.3. Korea
- 9.3.4. India
- 9.3.5. Australia
- 9.3.6. Southeast Asia
- 9.3.7. Rest Of APAC
- 9.1. Market Analysis, Insights and Forecast - by Product Type
- 10. India Asia Pacific Travel Retail industry Analysis, Insights and Forecast, 2020-2032
- 10.1. Market Analysis, Insights and Forecast - by Product Type
- 10.1.1. Fashion and Accessories
- 10.1.2. Jewellery and Watches
- 10.1.3. Wine & Spirits
- 10.1.4. Food & Confectionary
- 10.1.5. Fragnances and Cosmetics
- 10.1.6. Tobacco
- 10.2. Market Analysis, Insights and Forecast - by Distribution Channel
- 10.2.1. Airports
- 10.2.2. Airlines
- 10.2.3. Ferries
- 10.3. Market Analysis, Insights and Forecast - by Geography
- 10.3.1. China
- 10.3.2. Japan
- 10.3.3. Korea
- 10.3.4. India
- 10.3.5. Australia
- 10.3.6. Southeast Asia
- 10.3.7. Rest Of APAC
- 10.1. Market Analysis, Insights and Forecast - by Product Type
- 11. Australia Asia Pacific Travel Retail industry Analysis, Insights and Forecast, 2020-2032
- 11.1. Market Analysis, Insights and Forecast - by Product Type
- 11.1.1. Fashion and Accessories
- 11.1.2. Jewellery and Watches
- 11.1.3. Wine & Spirits
- 11.1.4. Food & Confectionary
- 11.1.5. Fragnances and Cosmetics
- 11.1.6. Tobacco
- 11.2. Market Analysis, Insights and Forecast - by Distribution Channel
- 11.2.1. Airports
- 11.2.2. Airlines
- 11.2.3. Ferries
- 11.3. Market Analysis, Insights and Forecast - by Geography
- 11.3.1. China
- 11.3.2. Japan
- 11.3.3. Korea
- 11.3.4. India
- 11.3.5. Australia
- 11.3.6. Southeast Asia
- 11.3.7. Rest Of APAC
- 11.1. Market Analysis, Insights and Forecast - by Product Type
- 12. Southeast Asia Asia Pacific Travel Retail industry Analysis, Insights and Forecast, 2020-2032
- 12.1. Market Analysis, Insights and Forecast - by Product Type
- 12.1.1. Fashion and Accessories
- 12.1.2. Jewellery and Watches
- 12.1.3. Wine & Spirits
- 12.1.4. Food & Confectionary
- 12.1.5. Fragnances and Cosmetics
- 12.1.6. Tobacco
- 12.2. Market Analysis, Insights and Forecast - by Distribution Channel
- 12.2.1. Airports
- 12.2.2. Airlines
- 12.2.3. Ferries
- 12.3. Market Analysis, Insights and Forecast - by Geography
- 12.3.1. China
- 12.3.2. Japan
- 12.3.3. Korea
- 12.3.4. India
- 12.3.5. Australia
- 12.3.6. Southeast Asia
- 12.3.7. Rest Of APAC
- 12.1. Market Analysis, Insights and Forecast - by Product Type
- 13. Rest Of APAC Asia Pacific Travel Retail industry Analysis, Insights and Forecast, 2020-2032
- 13.1. Market Analysis, Insights and Forecast - by Product Type
- 13.1.1. Fashion and Accessories
- 13.1.2. Jewellery and Watches
- 13.1.3. Wine & Spirits
- 13.1.4. Food & Confectionary
- 13.1.5. Fragnances and Cosmetics
- 13.1.6. Tobacco
- 13.2. Market Analysis, Insights and Forecast - by Distribution Channel
- 13.2.1. Airports
- 13.2.2. Airlines
- 13.2.3. Ferries
- 13.3. Market Analysis, Insights and Forecast - by Geography
- 13.3.1. China
- 13.3.2. Japan
- 13.3.3. Korea
- 13.3.4. India
- 13.3.5. Australia
- 13.3.6. Southeast Asia
- 13.3.7. Rest Of APAC
- 13.1. Market Analysis, Insights and Forecast - by Product Type
- 14. Competitive Analysis
- 14.1. Company Profiles
- 14.1.1 Dufry
- 14.1.1.1. Company Overview
- 14.1.1.2. Products
- 14.1.1.3. Company Financials
- 14.1.1.4. SWOT Analysis
- 14.1.2 China duty free group co ltd
- 14.1.2.1. Company Overview
- 14.1.2.2. Products
- 14.1.2.3. Company Financials
- 14.1.2.4. SWOT Analysis
- 14.1.3 DFS Group
- 14.1.3.1. Company Overview
- 14.1.3.2. Products
- 14.1.3.3. Company Financials
- 14.1.3.4. SWOT Analysis
- 14.1.4 King Power
- 14.1.4.1. Company Overview
- 14.1.4.2. Products
- 14.1.4.3. Company Financials
- 14.1.4.4. SWOT Analysis
- 14.1.5 Heinemann Asia Pacific
- 14.1.5.1. Company Overview
- 14.1.5.2. Products
- 14.1.5.3. Company Financials
- 14.1.5.4. SWOT Analysis
- 14.1.6 Lotte Duty Free
- 14.1.6.1. Company Overview
- 14.1.6.2. Products
- 14.1.6.3. Company Financials
- 14.1.6.4. SWOT Analysis
- 14.1.7 The shilla duty free
- 14.1.7.1. Company Overview
- 14.1.7.2. Products
- 14.1.7.3. Company Financials
- 14.1.7.4. SWOT Analysis
- 14.1.8 Flemingo International
- 14.1.8.1. Company Overview
- 14.1.8.2. Products
- 14.1.8.3. Company Financials
- 14.1.8.4. SWOT Analysis
- 14.1.9 James Richardson Group
- 14.1.9.1. Company Overview
- 14.1.9.2. Products
- 14.1.9.3. Company Financials
- 14.1.9.4. SWOT Analysis
- 14.1.10 The Nuance Group**List Not Exhaustive
- 14.1.10.1. Company Overview
- 14.1.10.2. Products
- 14.1.10.3. Company Financials
- 14.1.10.4. SWOT Analysis
- 14.1.1 Dufry
- 14.2. Market Entropy
- 14.2.1 Company's Key Areas Served
- 14.2.2 Recent Developments
- 14.3. Company Market Share Analysis 2025
- 14.3.1 Top 5 Companies Market Share Analysis
- 14.3.2 Top 3 Companies Market Share Analysis
- 14.4. List of Potential Customers
- 15. Research Methodology
List of Figures
- Figure 1: Global Asia Pacific Travel Retail industry Revenue Breakdown (Million, %) by Region 2025 & 2033
- Figure 2: Global Asia Pacific Travel Retail industry Volume Breakdown (Billion, %) by Region 2025 & 2033
- Figure 3: China Asia Pacific Travel Retail industry Revenue (Million), by Product Type 2025 & 2033
- Figure 4: China Asia Pacific Travel Retail industry Volume (Billion), by Product Type 2025 & 2033
- Figure 5: China Asia Pacific Travel Retail industry Revenue Share (%), by Product Type 2025 & 2033
- Figure 6: China Asia Pacific Travel Retail industry Volume Share (%), by Product Type 2025 & 2033
- Figure 7: China Asia Pacific Travel Retail industry Revenue (Million), by Distribution Channel 2025 & 2033
- Figure 8: China Asia Pacific Travel Retail industry Volume (Billion), by Distribution Channel 2025 & 2033
- Figure 9: China Asia Pacific Travel Retail industry Revenue Share (%), by Distribution Channel 2025 & 2033
- Figure 10: China Asia Pacific Travel Retail industry Volume Share (%), by Distribution Channel 2025 & 2033
- Figure 11: China Asia Pacific Travel Retail industry Revenue (Million), by Geography 2025 & 2033
- Figure 12: China Asia Pacific Travel Retail industry Volume (Billion), by Geography 2025 & 2033
- Figure 13: China Asia Pacific Travel Retail industry Revenue Share (%), by Geography 2025 & 2033
- Figure 14: China Asia Pacific Travel Retail industry Volume Share (%), by Geography 2025 & 2033
- Figure 15: China Asia Pacific Travel Retail industry Revenue (Million), by Country 2025 & 2033
- Figure 16: China Asia Pacific Travel Retail industry Volume (Billion), by Country 2025 & 2033
- Figure 17: China Asia Pacific Travel Retail industry Revenue Share (%), by Country 2025 & 2033
- Figure 18: China Asia Pacific Travel Retail industry Volume Share (%), by Country 2025 & 2033
- Figure 19: Japan Asia Pacific Travel Retail industry Revenue (Million), by Product Type 2025 & 2033
- Figure 20: Japan Asia Pacific Travel Retail industry Volume (Billion), by Product Type 2025 & 2033
- Figure 21: Japan Asia Pacific Travel Retail industry Revenue Share (%), by Product Type 2025 & 2033
- Figure 22: Japan Asia Pacific Travel Retail industry Volume Share (%), by Product Type 2025 & 2033
- Figure 23: Japan Asia Pacific Travel Retail industry Revenue (Million), by Distribution Channel 2025 & 2033
- Figure 24: Japan Asia Pacific Travel Retail industry Volume (Billion), by Distribution Channel 2025 & 2033
- Figure 25: Japan Asia Pacific Travel Retail industry Revenue Share (%), by Distribution Channel 2025 & 2033
- Figure 26: Japan Asia Pacific Travel Retail industry Volume Share (%), by Distribution Channel 2025 & 2033
- Figure 27: Japan Asia Pacific Travel Retail industry Revenue (Million), by Geography 2025 & 2033
- Figure 28: Japan Asia Pacific Travel Retail industry Volume (Billion), by Geography 2025 & 2033
- Figure 29: Japan Asia Pacific Travel Retail industry Revenue Share (%), by Geography 2025 & 2033
- Figure 30: Japan Asia Pacific Travel Retail industry Volume Share (%), by Geography 2025 & 2033
- Figure 31: Japan Asia Pacific Travel Retail industry Revenue (Million), by Country 2025 & 2033
- Figure 32: Japan Asia Pacific Travel Retail industry Volume (Billion), by Country 2025 & 2033
- Figure 33: Japan Asia Pacific Travel Retail industry Revenue Share (%), by Country 2025 & 2033
- Figure 34: Japan Asia Pacific Travel Retail industry Volume Share (%), by Country 2025 & 2033
- Figure 35: Korea Asia Pacific Travel Retail industry Revenue (Million), by Product Type 2025 & 2033
- Figure 36: Korea Asia Pacific Travel Retail industry Volume (Billion), by Product Type 2025 & 2033
- Figure 37: Korea Asia Pacific Travel Retail industry Revenue Share (%), by Product Type 2025 & 2033
- Figure 38: Korea Asia Pacific Travel Retail industry Volume Share (%), by Product Type 2025 & 2033
- Figure 39: Korea Asia Pacific Travel Retail industry Revenue (Million), by Distribution Channel 2025 & 2033
- Figure 40: Korea Asia Pacific Travel Retail industry Volume (Billion), by Distribution Channel 2025 & 2033
- Figure 41: Korea Asia Pacific Travel Retail industry Revenue Share (%), by Distribution Channel 2025 & 2033
- Figure 42: Korea Asia Pacific Travel Retail industry Volume Share (%), by Distribution Channel 2025 & 2033
- Figure 43: Korea Asia Pacific Travel Retail industry Revenue (Million), by Geography 2025 & 2033
- Figure 44: Korea Asia Pacific Travel Retail industry Volume (Billion), by Geography 2025 & 2033
- Figure 45: Korea Asia Pacific Travel Retail industry Revenue Share (%), by Geography 2025 & 2033
- Figure 46: Korea Asia Pacific Travel Retail industry Volume Share (%), by Geography 2025 & 2033
- Figure 47: Korea Asia Pacific Travel Retail industry Revenue (Million), by Country 2025 & 2033
- Figure 48: Korea Asia Pacific Travel Retail industry Volume (Billion), by Country 2025 & 2033
- Figure 49: Korea Asia Pacific Travel Retail industry Revenue Share (%), by Country 2025 & 2033
- Figure 50: Korea Asia Pacific Travel Retail industry Volume Share (%), by Country 2025 & 2033
- Figure 51: India Asia Pacific Travel Retail industry Revenue (Million), by Product Type 2025 & 2033
- Figure 52: India Asia Pacific Travel Retail industry Volume (Billion), by Product Type 2025 & 2033
- Figure 53: India Asia Pacific Travel Retail industry Revenue Share (%), by Product Type 2025 & 2033
- Figure 54: India Asia Pacific Travel Retail industry Volume Share (%), by Product Type 2025 & 2033
- Figure 55: India Asia Pacific Travel Retail industry Revenue (Million), by Distribution Channel 2025 & 2033
- Figure 56: India Asia Pacific Travel Retail industry Volume (Billion), by Distribution Channel 2025 & 2033
- Figure 57: India Asia Pacific Travel Retail industry Revenue Share (%), by Distribution Channel 2025 & 2033
- Figure 58: India Asia Pacific Travel Retail industry Volume Share (%), by Distribution Channel 2025 & 2033
- Figure 59: India Asia Pacific Travel Retail industry Revenue (Million), by Geography 2025 & 2033
- Figure 60: India Asia Pacific Travel Retail industry Volume (Billion), by Geography 2025 & 2033
- Figure 61: India Asia Pacific Travel Retail industry Revenue Share (%), by Geography 2025 & 2033
- Figure 62: India Asia Pacific Travel Retail industry Volume Share (%), by Geography 2025 & 2033
- Figure 63: India Asia Pacific Travel Retail industry Revenue (Million), by Country 2025 & 2033
- Figure 64: India Asia Pacific Travel Retail industry Volume (Billion), by Country 2025 & 2033
- Figure 65: India Asia Pacific Travel Retail industry Revenue Share (%), by Country 2025 & 2033
- Figure 66: India Asia Pacific Travel Retail industry Volume Share (%), by Country 2025 & 2033
- Figure 67: Australia Asia Pacific Travel Retail industry Revenue (Million), by Product Type 2025 & 2033
- Figure 68: Australia Asia Pacific Travel Retail industry Volume (Billion), by Product Type 2025 & 2033
- Figure 69: Australia Asia Pacific Travel Retail industry Revenue Share (%), by Product Type 2025 & 2033
- Figure 70: Australia Asia Pacific Travel Retail industry Volume Share (%), by Product Type 2025 & 2033
- Figure 71: Australia Asia Pacific Travel Retail industry Revenue (Million), by Distribution Channel 2025 & 2033
- Figure 72: Australia Asia Pacific Travel Retail industry Volume (Billion), by Distribution Channel 2025 & 2033
- Figure 73: Australia Asia Pacific Travel Retail industry Revenue Share (%), by Distribution Channel 2025 & 2033
- Figure 74: Australia Asia Pacific Travel Retail industry Volume Share (%), by Distribution Channel 2025 & 2033
- Figure 75: Australia Asia Pacific Travel Retail industry Revenue (Million), by Geography 2025 & 2033
- Figure 76: Australia Asia Pacific Travel Retail industry Volume (Billion), by Geography 2025 & 2033
- Figure 77: Australia Asia Pacific Travel Retail industry Revenue Share (%), by Geography 2025 & 2033
- Figure 78: Australia Asia Pacific Travel Retail industry Volume Share (%), by Geography 2025 & 2033
- Figure 79: Australia Asia Pacific Travel Retail industry Revenue (Million), by Country 2025 & 2033
- Figure 80: Australia Asia Pacific Travel Retail industry Volume (Billion), by Country 2025 & 2033
- Figure 81: Australia Asia Pacific Travel Retail industry Revenue Share (%), by Country 2025 & 2033
- Figure 82: Australia Asia Pacific Travel Retail industry Volume Share (%), by Country 2025 & 2033
- Figure 83: Southeast Asia Asia Pacific Travel Retail industry Revenue (Million), by Product Type 2025 & 2033
- Figure 84: Southeast Asia Asia Pacific Travel Retail industry Volume (Billion), by Product Type 2025 & 2033
- Figure 85: Southeast Asia Asia Pacific Travel Retail industry Revenue Share (%), by Product Type 2025 & 2033
- Figure 86: Southeast Asia Asia Pacific Travel Retail industry Volume Share (%), by Product Type 2025 & 2033
- Figure 87: Southeast Asia Asia Pacific Travel Retail industry Revenue (Million), by Distribution Channel 2025 & 2033
- Figure 88: Southeast Asia Asia Pacific Travel Retail industry Volume (Billion), by Distribution Channel 2025 & 2033
- Figure 89: Southeast Asia Asia Pacific Travel Retail industry Revenue Share (%), by Distribution Channel 2025 & 2033
- Figure 90: Southeast Asia Asia Pacific Travel Retail industry Volume Share (%), by Distribution Channel 2025 & 2033
- Figure 91: Southeast Asia Asia Pacific Travel Retail industry Revenue (Million), by Geography 2025 & 2033
- Figure 92: Southeast Asia Asia Pacific Travel Retail industry Volume (Billion), by Geography 2025 & 2033
- Figure 93: Southeast Asia Asia Pacific Travel Retail industry Revenue Share (%), by Geography 2025 & 2033
- Figure 94: Southeast Asia Asia Pacific Travel Retail industry Volume Share (%), by Geography 2025 & 2033
- Figure 95: Southeast Asia Asia Pacific Travel Retail industry Revenue (Million), by Country 2025 & 2033
- Figure 96: Southeast Asia Asia Pacific Travel Retail industry Volume (Billion), by Country 2025 & 2033
- Figure 97: Southeast Asia Asia Pacific Travel Retail industry Revenue Share (%), by Country 2025 & 2033
- Figure 98: Southeast Asia Asia Pacific Travel Retail industry Volume Share (%), by Country 2025 & 2033
- Figure 99: Rest Of APAC Asia Pacific Travel Retail industry Revenue (Million), by Product Type 2025 & 2033
- Figure 100: Rest Of APAC Asia Pacific Travel Retail industry Volume (Billion), by Product Type 2025 & 2033
- Figure 101: Rest Of APAC Asia Pacific Travel Retail industry Revenue Share (%), by Product Type 2025 & 2033
- Figure 102: Rest Of APAC Asia Pacific Travel Retail industry Volume Share (%), by Product Type 2025 & 2033
- Figure 103: Rest Of APAC Asia Pacific Travel Retail industry Revenue (Million), by Distribution Channel 2025 & 2033
- Figure 104: Rest Of APAC Asia Pacific Travel Retail industry Volume (Billion), by Distribution Channel 2025 & 2033
- Figure 105: Rest Of APAC Asia Pacific Travel Retail industry Revenue Share (%), by Distribution Channel 2025 & 2033
- Figure 106: Rest Of APAC Asia Pacific Travel Retail industry Volume Share (%), by Distribution Channel 2025 & 2033
- Figure 107: Rest Of APAC Asia Pacific Travel Retail industry Revenue (Million), by Geography 2025 & 2033
- Figure 108: Rest Of APAC Asia Pacific Travel Retail industry Volume (Billion), by Geography 2025 & 2033
- Figure 109: Rest Of APAC Asia Pacific Travel Retail industry Revenue Share (%), by Geography 2025 & 2033
- Figure 110: Rest Of APAC Asia Pacific Travel Retail industry Volume Share (%), by Geography 2025 & 2033
- Figure 111: Rest Of APAC Asia Pacific Travel Retail industry Revenue (Million), by Country 2025 & 2033
- Figure 112: Rest Of APAC Asia Pacific Travel Retail industry Volume (Billion), by Country 2025 & 2033
- Figure 113: Rest Of APAC Asia Pacific Travel Retail industry Revenue Share (%), by Country 2025 & 2033
- Figure 114: Rest Of APAC Asia Pacific Travel Retail industry Volume Share (%), by Country 2025 & 2033
List of Tables
- Table 1: Global Asia Pacific Travel Retail industry Revenue Million Forecast, by Product Type 2020 & 2033
- Table 2: Global Asia Pacific Travel Retail industry Volume Billion Forecast, by Product Type 2020 & 2033
- Table 3: Global Asia Pacific Travel Retail industry Revenue Million Forecast, by Distribution Channel 2020 & 2033
- Table 4: Global Asia Pacific Travel Retail industry Volume Billion Forecast, by Distribution Channel 2020 & 2033
- Table 5: Global Asia Pacific Travel Retail industry Revenue Million Forecast, by Geography 2020 & 2033
- Table 6: Global Asia Pacific Travel Retail industry Volume Billion Forecast, by Geography 2020 & 2033
- Table 7: Global Asia Pacific Travel Retail industry Revenue Million Forecast, by Region 2020 & 2033
- Table 8: Global Asia Pacific Travel Retail industry Volume Billion Forecast, by Region 2020 & 2033
- Table 9: Global Asia Pacific Travel Retail industry Revenue Million Forecast, by Product Type 2020 & 2033
- Table 10: Global Asia Pacific Travel Retail industry Volume Billion Forecast, by Product Type 2020 & 2033
- Table 11: Global Asia Pacific Travel Retail industry Revenue Million Forecast, by Distribution Channel 2020 & 2033
- Table 12: Global Asia Pacific Travel Retail industry Volume Billion Forecast, by Distribution Channel 2020 & 2033
- Table 13: Global Asia Pacific Travel Retail industry Revenue Million Forecast, by Geography 2020 & 2033
- Table 14: Global Asia Pacific Travel Retail industry Volume Billion Forecast, by Geography 2020 & 2033
- Table 15: Global Asia Pacific Travel Retail industry Revenue Million Forecast, by Country 2020 & 2033
- Table 16: Global Asia Pacific Travel Retail industry Volume Billion Forecast, by Country 2020 & 2033
- Table 17: Global Asia Pacific Travel Retail industry Revenue Million Forecast, by Product Type 2020 & 2033
- Table 18: Global Asia Pacific Travel Retail industry Volume Billion Forecast, by Product Type 2020 & 2033
- Table 19: Global Asia Pacific Travel Retail industry Revenue Million Forecast, by Distribution Channel 2020 & 2033
- Table 20: Global Asia Pacific Travel Retail industry Volume Billion Forecast, by Distribution Channel 2020 & 2033
- Table 21: Global Asia Pacific Travel Retail industry Revenue Million Forecast, by Geography 2020 & 2033
- Table 22: Global Asia Pacific Travel Retail industry Volume Billion Forecast, by Geography 2020 & 2033
- Table 23: Global Asia Pacific Travel Retail industry Revenue Million Forecast, by Country 2020 & 2033
- Table 24: Global Asia Pacific Travel Retail industry Volume Billion Forecast, by Country 2020 & 2033
- Table 25: Global Asia Pacific Travel Retail industry Revenue Million Forecast, by Product Type 2020 & 2033
- Table 26: Global Asia Pacific Travel Retail industry Volume Billion Forecast, by Product Type 2020 & 2033
- Table 27: Global Asia Pacific Travel Retail industry Revenue Million Forecast, by Distribution Channel 2020 & 2033
- Table 28: Global Asia Pacific Travel Retail industry Volume Billion Forecast, by Distribution Channel 2020 & 2033
- Table 29: Global Asia Pacific Travel Retail industry Revenue Million Forecast, by Geography 2020 & 2033
- Table 30: Global Asia Pacific Travel Retail industry Volume Billion Forecast, by Geography 2020 & 2033
- Table 31: Global Asia Pacific Travel Retail industry Revenue Million Forecast, by Country 2020 & 2033
- Table 32: Global Asia Pacific Travel Retail industry Volume Billion Forecast, by Country 2020 & 2033
- Table 33: Global Asia Pacific Travel Retail industry Revenue Million Forecast, by Product Type 2020 & 2033
- Table 34: Global Asia Pacific Travel Retail industry Volume Billion Forecast, by Product Type 2020 & 2033
- Table 35: Global Asia Pacific Travel Retail industry Revenue Million Forecast, by Distribution Channel 2020 & 2033
- Table 36: Global Asia Pacific Travel Retail industry Volume Billion Forecast, by Distribution Channel 2020 & 2033
- Table 37: Global Asia Pacific Travel Retail industry Revenue Million Forecast, by Geography 2020 & 2033
- Table 38: Global Asia Pacific Travel Retail industry Volume Billion Forecast, by Geography 2020 & 2033
- Table 39: Global Asia Pacific Travel Retail industry Revenue Million Forecast, by Country 2020 & 2033
- Table 40: Global Asia Pacific Travel Retail industry Volume Billion Forecast, by Country 2020 & 2033
- Table 41: Global Asia Pacific Travel Retail industry Revenue Million Forecast, by Product Type 2020 & 2033
- Table 42: Global Asia Pacific Travel Retail industry Volume Billion Forecast, by Product Type 2020 & 2033
- Table 43: Global Asia Pacific Travel Retail industry Revenue Million Forecast, by Distribution Channel 2020 & 2033
- Table 44: Global Asia Pacific Travel Retail industry Volume Billion Forecast, by Distribution Channel 2020 & 2033
- Table 45: Global Asia Pacific Travel Retail industry Revenue Million Forecast, by Geography 2020 & 2033
- Table 46: Global Asia Pacific Travel Retail industry Volume Billion Forecast, by Geography 2020 & 2033
- Table 47: Global Asia Pacific Travel Retail industry Revenue Million Forecast, by Country 2020 & 2033
- Table 48: Global Asia Pacific Travel Retail industry Volume Billion Forecast, by Country 2020 & 2033
- Table 49: Global Asia Pacific Travel Retail industry Revenue Million Forecast, by Product Type 2020 & 2033
- Table 50: Global Asia Pacific Travel Retail industry Volume Billion Forecast, by Product Type 2020 & 2033
- Table 51: Global Asia Pacific Travel Retail industry Revenue Million Forecast, by Distribution Channel 2020 & 2033
- Table 52: Global Asia Pacific Travel Retail industry Volume Billion Forecast, by Distribution Channel 2020 & 2033
- Table 53: Global Asia Pacific Travel Retail industry Revenue Million Forecast, by Geography 2020 & 2033
- Table 54: Global Asia Pacific Travel Retail industry Volume Billion Forecast, by Geography 2020 & 2033
- Table 55: Global Asia Pacific Travel Retail industry Revenue Million Forecast, by Country 2020 & 2033
- Table 56: Global Asia Pacific Travel Retail industry Volume Billion Forecast, by Country 2020 & 2033
- Table 57: Global Asia Pacific Travel Retail industry Revenue Million Forecast, by Product Type 2020 & 2033
- Table 58: Global Asia Pacific Travel Retail industry Volume Billion Forecast, by Product Type 2020 & 2033
- Table 59: Global Asia Pacific Travel Retail industry Revenue Million Forecast, by Distribution Channel 2020 & 2033
- Table 60: Global Asia Pacific Travel Retail industry Volume Billion Forecast, by Distribution Channel 2020 & 2033
- Table 61: Global Asia Pacific Travel Retail industry Revenue Million Forecast, by Geography 2020 & 2033
- Table 62: Global Asia Pacific Travel Retail industry Volume Billion Forecast, by Geography 2020 & 2033
- Table 63: Global Asia Pacific Travel Retail industry Revenue Million Forecast, by Country 2020 & 2033
- Table 64: Global Asia Pacific Travel Retail industry Volume Billion Forecast, by Country 2020 & 2033
Frequently Asked Questions
1. What is the projected Compound Annual Growth Rate (CAGR) of the Asia Pacific Travel Retail industry?
The projected CAGR is approximately 9.21%.
2. Which companies are prominent players in the Asia Pacific Travel Retail industry?
Key companies in the market include Dufry, China duty free group co ltd, DFS Group, King Power, Heinemann Asia Pacific, Lotte Duty Free, The shilla duty free, Flemingo International, James Richardson Group, The Nuance Group**List Not Exhaustive.
3. What are the main segments of the Asia Pacific Travel Retail industry?
The market segments include Product Type, Distribution Channel, Geography.
4. Can you provide details about the market size?
The market size is estimated to be USD 63.15 Million as of 2022.
5. What are some drivers contributing to market growth?
Guaranteed Customer Base In Travel Duty-Free Shops Drives The Market; Exemption From Taxes When Goods Are Taken Out Of The Country Of Purchase Drives The Market.
6. What are the notable trends driving market growth?
High Revenue Generation From Airport Retailing Drives The Market.
7. Are there any restraints impacting market growth?
Guaranteed Customer Base In Travel Duty-Free Shops Drives The Market; Exemption From Taxes When Goods Are Taken Out Of The Country Of Purchase Drives The Market.
8. Can you provide examples of recent developments in the market?
October 2023: DFS Group, the travel retail company, developed an entertainment and shopping complex on the duty-free Hainan Island of China. This development aimed to enhance the tourism market, even during economic downturns.
9. What pricing options are available for accessing the report?
Pricing options include single-user, multi-user, and enterprise licenses priced at USD 4750, USD 5250, and USD 8750 respectively.
10. Is the market size provided in terms of value or volume?
The market size is provided in terms of value, measured in Million and volume, measured in Billion.
11. Are there any specific market keywords associated with the report?
Yes, the market keyword associated with the report is "Asia Pacific Travel Retail industry," which aids in identifying and referencing the specific market segment covered.
12. How do I determine which pricing option suits my needs best?
The pricing options vary based on user requirements and access needs. Individual users may opt for single-user licenses, while businesses requiring broader access may choose multi-user or enterprise licenses for cost-effective access to the report.
13. Are there any additional resources or data provided in the Asia Pacific Travel Retail industry report?
While the report offers comprehensive insights, it's advisable to review the specific contents or supplementary materials provided to ascertain if additional resources or data are available.
14. How can I stay updated on further developments or reports in the Asia Pacific Travel Retail industry?
To stay informed about further developments, trends, and reports in the Asia Pacific Travel Retail industry, consider subscribing to industry newsletters, following relevant companies and organizations, or regularly checking reputable industry news sources and publications.
Methodology
Step 1 - Identification of Relevant Samples Size from Population Database


Step 2 - Approaches for Defining Global Market Size (Value, Volume* & Price*)

Note*: In applicable scenarios
Step 3 - Data Sources
Primary Research
- Web Analytics
- Survey Reports
- Research Institute
- Latest Research Reports
- Opinion Leaders
Secondary Research
- Annual Reports
- White Paper
- Latest Press Release
- Industry Association
- Paid Database
- Investor Presentations

Step 4 - Data Triangulation
Involves using different sources of information in order to increase the validity of a study
These sources are likely to be stakeholders in a program - participants, other researchers, program staff, other community members, and so on.
Then we put all data in single framework & apply various statistical tools to find out the dynamic on the market.
During the analysis stage, feedback from the stakeholder groups would be compared to determine areas of agreement as well as areas of divergence