


Key Insights
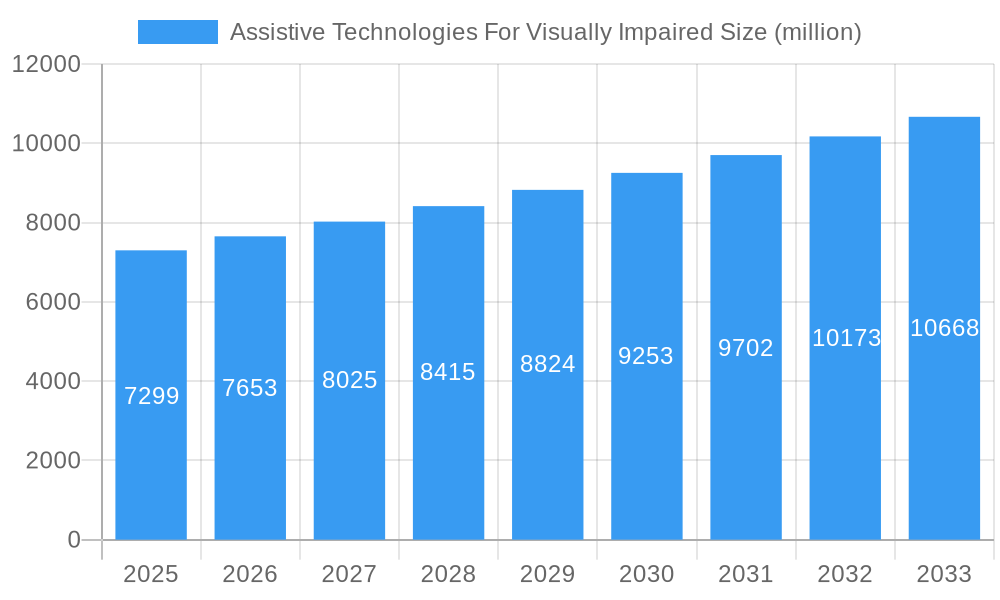
The global market for Assistive Technologies for the Visually Impaired is poised for substantial growth, currently valued at an estimated \$7,299 million. This robust market is projected to expand at a Compound Annual Growth Rate (CAGR) of 4.8% from 2025 through 2033, signaling a dynamic and expanding sector driven by increasing global awareness, technological advancements, and a growing demand for enhanced independence and accessibility for individuals with visual impairments. The market's expansion is fueled by several key drivers, including government initiatives promoting inclusivity and accessibility, the rising prevalence of age-related vision conditions, and the continuous innovation in smart devices and software solutions tailored to meet the diverse needs of the visually impaired community. Educational institutions, enterprises, and social organizations are increasingly adopting these technologies to foster equal opportunities, while personal use is also on a significant upswing as individuals seek greater autonomy in their daily lives.
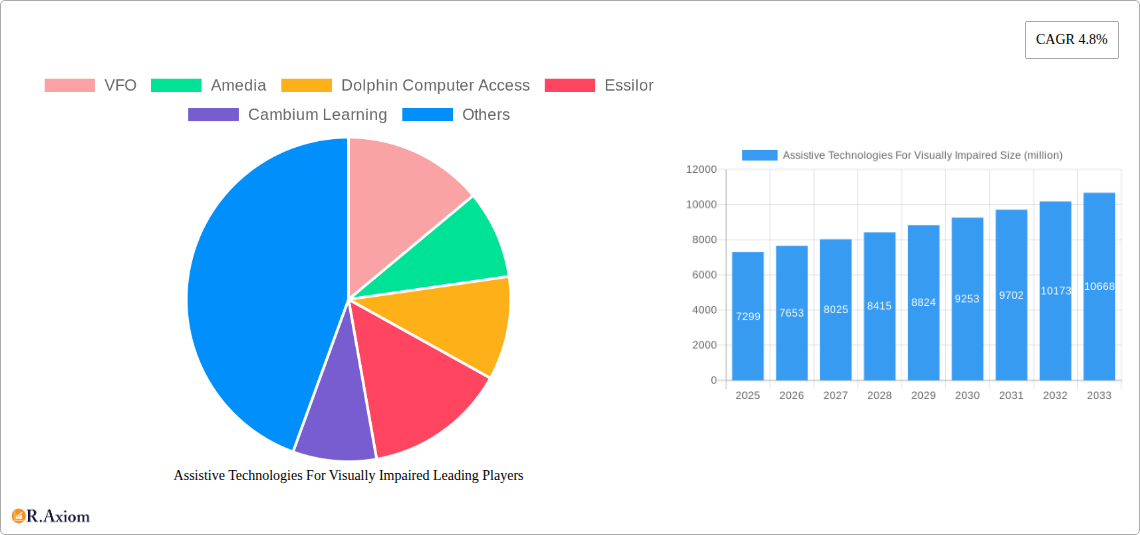
Assistive Technologies For Visually Impaired Market Size (In Billion)

The assistive technologies landscape is segmented across various product types and applications, reflecting the multifaceted nature of visual impairment support. Educational Devices & Software, Mobility Devices, and Low Vision Devices represent significant segments, each addressing distinct challenges faced by visually impaired individuals. Trends such as the integration of Artificial Intelligence (AI) and Machine Learning (ML) into assistive devices for enhanced functionality, the miniaturization and portability of devices, and the development of more intuitive user interfaces are shaping the market's trajectory. While the market presents immense opportunities, certain restraints, such as the high cost of some advanced assistive technologies and a lack of widespread awareness and training in certain regions, need to be addressed to ensure equitable access. Leading companies are actively investing in research and development to overcome these challenges and capitalize on the growing global demand for innovative assistive solutions.
Assistive Technologies For Visually Impaired Company Market Share
Assistive Technologies For Visually Impaired Market Concentration & Innovation
The global assistive technologies for visually impaired market exhibits moderate concentration, driven by continuous innovation and increasing demand for advanced solutions. Key players like VFO, Amedia, Dolphin Computer Access, Essilor, Cambium Learning, Access Ingenuity, American Thermoform, LVI Low Vision International, ViewPlus, LS&S, LLC are actively investing in research and development to enhance product functionality and accessibility. Regulatory frameworks, particularly those promoting digital inclusion and accessibility standards, play a crucial role in shaping market dynamics. The threat of product substitutes is relatively low due to the specialized nature of these technologies, but advancements in general consumer electronics with integrated accessibility features pose a growing consideration. End-user trends are heavily influenced by the increasing adoption of smart devices and the growing awareness of the importance of independence for visually impaired individuals. Mergers and acquisitions (M&A) activities are observed as companies aim to expand their product portfolios, geographical reach, and technological capabilities. M&A deal values are projected to reach approximately $XX million in the forecast period. Market share distribution is dynamic, with leading companies holding significant portions in specific product categories.
Assistive Technologies For Visually Impaired Industry Trends & Insights
The assistive technologies for visually impaired industry is poised for robust growth, with a projected Compound Annual Growth Rate (CAGR) of approximately 12.5% during the forecast period of 2025–2033. This significant expansion is fueled by a confluence of factors including escalating global prevalence of visual impairments, a heightened societal emphasis on inclusivity and accessibility, and rapid technological advancements. The market penetration of sophisticated assistive devices is steadily increasing across various demographics and end-user segments. Technological disruptions are primarily centered around artificial intelligence (AI) and machine learning (ML) integration, leading to more intuitive and personalized user experiences. Innovations in areas such as AI-powered object recognition, advanced haptic feedback systems, and enhanced screen reader technologies are redefining the capabilities of assistive tools. Consumer preferences are shifting towards more integrated, portable, and smart solutions that seamlessly blend into daily life, offering greater independence and productivity. The competitive landscape is characterized by both established market leaders and emerging startups vying for market share through product differentiation, strategic partnerships, and a focus on user-centric design. The increasing affordability of certain assistive technologies, coupled with growing government and organizational support, further contributes to market expansion. The integration of these technologies in educational settings, workplaces, and personal use scenarios is creating a sustained demand, driving market penetration to an estimated XX% by 2033.
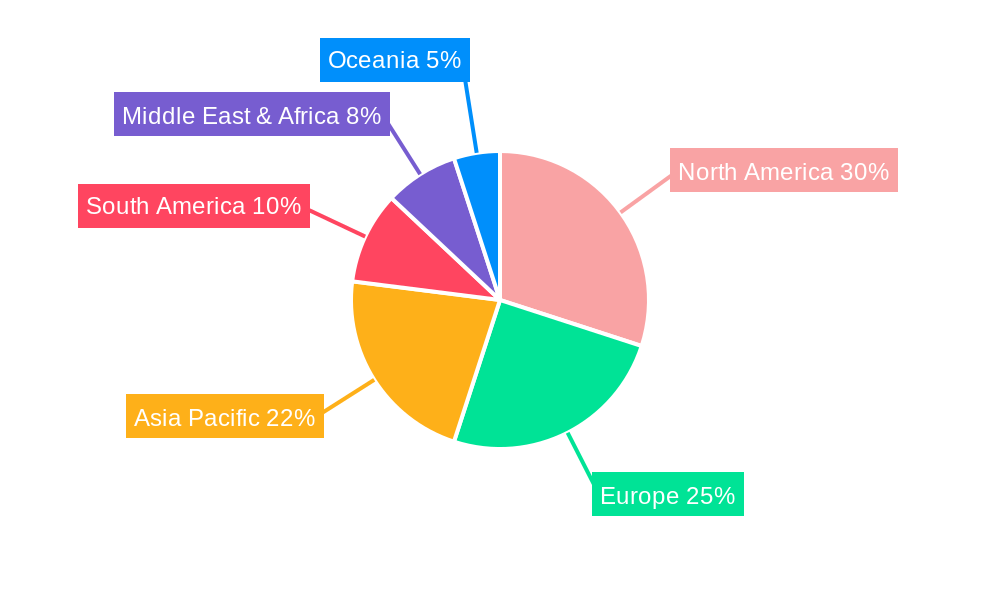
Dominant Markets & Segments in Assistive Technologies For Visually Impaired
The assistive technologies for visually impaired market is experiencing dominant growth in North America, driven by a robust healthcare infrastructure, strong government initiatives promoting accessibility, and a high level of technological adoption. Within this region, the United States leads in terms of market size and innovation.
Application Dominance:
- Personal Use: This segment is projected to witness the highest growth due to the increasing desire for independence and the proliferation of affordable, user-friendly assistive devices. Economic policies supporting individual access to assistive technology, coupled with growing awareness among individuals and their families, are key drivers.
- Enterprises & Social Organizations: This segment is also significant, with organizations investing in assistive technologies to ensure workplace inclusivity and compliance with accessibility regulations. Infrastructure development within these organizations to support diverse needs is crucial.
- Blind Schools: These institutions are consistently adopting advanced educational devices and software to enhance learning outcomes for visually impaired students. Dedicated educational policies and funding mechanisms are critical here.
- Federation & Hospital: These entities play a vital role in rehabilitation and support services, driving demand for assistive technologies that aid in recovery and daily living. Healthcare infrastructure and funding for assistive devices are paramount.
Type Dominance:
- Low Vision Devices: This category, encompassing magnifiers, specialized lighting, and electronic aids, currently holds a substantial market share due to its broad applicability across various levels of visual impairment. Technological advancements in optics and digital magnification are key drivers.
- Educational Devices & Software: This segment is experiencing rapid expansion, with a growing demand for accessible learning materials, smart devices for education, and specialized software solutions. The focus on inclusive education is a primary catalyst.
- Mobility Devices: While a smaller segment, devices like smart canes and navigation aids are crucial for independent living and are seeing continuous innovation, driven by AI and sensor technology.
Assistive Technologies For Visually Impaired Product Developments
Product developments in assistive technologies for visually impaired are characterized by rapid innovation, focusing on enhancing user independence and interaction. AI-powered advancements are prominent, with devices now offering sophisticated object recognition, text-to-speech capabilities with natural voices, and intelligent navigation assistance. Innovations in wearable technology, such as smart glasses and haptic feedback devices, are expanding real-world applicability. The integration of these technologies into everyday consumer electronics also presents a competitive advantage by making assistive features more accessible and less conspicuous.
Report Scope & Segmentation Analysis
This report meticulously analyzes the global assistive technologies for visually impaired market, segmenting it by Application and Type. The Application segments include Blind Schools, Enterprises & Social Organizations, Personal Use, Federation & Hospital, and Others. Each segment's market size, projected growth rate, and competitive dynamics are detailed, with Personal Use expected to exhibit the highest growth. The Type segments encompass Educational Devices & Software, Mobility Devices, Low Vision Devices, and Others. We provide in-depth analysis of each type's market penetration, technological trends, and key players. Low Vision Devices are currently dominant, but Educational Devices & Software are showing strong upward momentum.
Key Drivers of Assistive Technologies For Visually Impaired Growth
The primary drivers of growth in the assistive technologies for visually impaired market are multifaceted. Technologically, the continuous advancement in Artificial Intelligence, Machine Learning, and sensor technology is enabling the development of more sophisticated and intuitive devices. Economically, increasing disposable incomes in developing regions and supportive government policies, such as tax incentives and funding for assistive technology procurement, are expanding market access. Regulatory frameworks promoting digital inclusion and accessibility standards are also a significant catalyst, compelling organizations and manufacturers to develop and adopt compliant solutions.
Challenges in the Assistive Technologies For Visually Impaired Sector
Despite robust growth, the assistive technologies for visually impaired sector faces several challenges. High manufacturing costs for some advanced devices can lead to prohibitive prices for individuals, impacting market penetration, with estimated cost premiums of up to XX% for cutting-edge features. Regulatory hurdles in certain regions, particularly regarding device certification and data privacy, can slow down market entry. Supply chain disruptions, amplified by global economic uncertainties, can affect the availability and timely delivery of components and finished products. Intense competitive pressures among established players and emerging startups also necessitate constant innovation and strategic pricing.
Emerging Opportunities in Assistive Technologies For Visually Impaired
Emerging opportunities within the assistive technologies for visually impaired market are abundant. The untapped potential in emerging economies presents a significant growth avenue, with increasing awareness and affordability driving demand. Advancements in virtual and augmented reality (VR/AR) for specialized training and navigation applications offer new frontiers. The growing integration of AI-powered personal assistants and smart home devices designed with visual impairment accessibility in mind is creating a vast, interconnected ecosystem of assistive solutions. Furthermore, the burgeoning field of personalized assistive technology, tailored to individual needs and preferences, is a key area for future development.
Leading Players in the Assistive Technologies For Visually Impaired Market
- VFO
- Amedia
- Dolphin Computer Access
- Essilor
- Cambium Learning
- Access Ingenuity
- American Thermoform
- LVI Low Vision International
- ViewPlus
- LS&S, LLC
Key Developments in Assistive Technologies For Visually Impaired Industry
- 2024 Q1: Launch of AI-powered navigation app with enhanced real-time object recognition, impacting mobility device market.
- 2023 Q4: Major acquisition of a specialized screen reader software company by a leading assistive technology provider, consolidating market share.
- 2023 Q2: Introduction of advanced haptic feedback technology in wearable devices, improving tactile navigation capabilities.
- 2022 Q4: Significant government funding allocated for accessible educational technology in schools, boosting the educational devices segment.
- 2021 Q3: Development of portable, AI-driven OCR devices with improved accuracy, enhancing document accessibility.
Strategic Outlook for Assistive Technologies For Visually Impaired Market
The strategic outlook for the assistive technologies for visually impaired market is exceptionally positive, driven by sustained innovation and increasing global demand for inclusive solutions. Future growth catalysts will stem from the continued integration of AI and machine learning for more personalized and intuitive user experiences, the expansion of smart device ecosystems with built-in accessibility features, and the growing adoption in emerging markets. Strategic collaborations between technology developers, healthcare providers, and educational institutions will be crucial in expanding market reach and ensuring equitable access to these life-enhancing technologies.
Assistive Technologies For Visually Impaired Segmentation
-
1. Application
- 1.1. Blind Schools
- 1.2. Enterprises & Social Organizations
- 1.3. Personal Use
- 1.4. Federation & Hospital
- 1.5. Others
-
2. Type
- 2.1. Educational Devices & Software
- 2.2. Mobility Devices
- 2.3. Low Vision Devices
- 2.4. Others
Assistive Technologies For Visually Impaired Segmentation By Geography
-
1. North America
- 1.1. United States
- 1.2. Canada
- 1.3. Mexico
-
2. South America
- 2.1. Brazil
- 2.2. Argentina
- 2.3. Rest of South America
-
3. Europe
- 3.1. United Kingdom
- 3.2. Germany
- 3.3. France
- 3.4. Italy
- 3.5. Spain
- 3.6. Russia
- 3.7. Benelux
- 3.8. Nordics
- 3.9. Rest of Europe
-
4. Middle East & Africa
- 4.1. Turkey
- 4.2. Israel
- 4.3. GCC
- 4.4. North Africa
- 4.5. South Africa
- 4.6. Rest of Middle East & Africa
-
5. Asia Pacific
- 5.1. China
- 5.2. India
- 5.3. Japan
- 5.4. South Korea
- 5.5. ASEAN
- 5.6. Oceania
- 5.7. Rest of Asia Pacific
Assistive Technologies For Visually Impaired Regional Market Share
Geographic Coverage of Assistive Technologies For Visually Impaired
Assistive Technologies For Visually Impaired REPORT HIGHLIGHTS
| Aspects | Details |
|---|---|
| Study Period | 2020-2034 |
| Base Year | 2025 |
| Estimated Year | 2026 |
| Forecast Period | 2026-2034 |
| Historical Period | 2020-2025 |
| Growth Rate | CAGR of 4.8% from 2020-2034 |
| Segmentation |
|
Table of Contents
- 1. Introduction
- 1.1. Research Scope
- 1.2. Market Segmentation
- 1.3. Research Methodology
- 1.4. Definitions and Assumptions
- 2. Executive Summary
- 2.1. Introduction
- 3. Market Dynamics
- 3.1. Introduction
- 3.2. Market Drivers
- 3.3. Market Restrains
- 3.4. Market Trends
- 4. Market Factor Analysis
- 4.1. Porters Five Forces
- 4.2. Supply/Value Chain
- 4.3. PESTEL analysis
- 4.4. Market Entropy
- 4.5. Patent/Trademark Analysis
- 5. Global Assistive Technologies For Visually Impaired Analysis, Insights and Forecast, 2020-2032
- 5.1. Market Analysis, Insights and Forecast - by Application
- 5.1.1. Blind Schools
- 5.1.2. Enterprises & Social Organizations
- 5.1.3. Personal Use
- 5.1.4. Federation & Hospital
- 5.1.5. Others
- 5.2. Market Analysis, Insights and Forecast - by Type
- 5.2.1. Educational Devices & Software
- 5.2.2. Mobility Devices
- 5.2.3. Low Vision Devices
- 5.2.4. Others
- 5.3. Market Analysis, Insights and Forecast - by Region
- 5.3.1. North America
- 5.3.2. South America
- 5.3.3. Europe
- 5.3.4. Middle East & Africa
- 5.3.5. Asia Pacific
- 5.1. Market Analysis, Insights and Forecast - by Application
- 6. North America Assistive Technologies For Visually Impaired Analysis, Insights and Forecast, 2020-2032
- 6.1. Market Analysis, Insights and Forecast - by Application
- 6.1.1. Blind Schools
- 6.1.2. Enterprises & Social Organizations
- 6.1.3. Personal Use
- 6.1.4. Federation & Hospital
- 6.1.5. Others
- 6.2. Market Analysis, Insights and Forecast - by Type
- 6.2.1. Educational Devices & Software
- 6.2.2. Mobility Devices
- 6.2.3. Low Vision Devices
- 6.2.4. Others
- 6.1. Market Analysis, Insights and Forecast - by Application
- 7. South America Assistive Technologies For Visually Impaired Analysis, Insights and Forecast, 2020-2032
- 7.1. Market Analysis, Insights and Forecast - by Application
- 7.1.1. Blind Schools
- 7.1.2. Enterprises & Social Organizations
- 7.1.3. Personal Use
- 7.1.4. Federation & Hospital
- 7.1.5. Others
- 7.2. Market Analysis, Insights and Forecast - by Type
- 7.2.1. Educational Devices & Software
- 7.2.2. Mobility Devices
- 7.2.3. Low Vision Devices
- 7.2.4. Others
- 7.1. Market Analysis, Insights and Forecast - by Application
- 8. Europe Assistive Technologies For Visually Impaired Analysis, Insights and Forecast, 2020-2032
- 8.1. Market Analysis, Insights and Forecast - by Application
- 8.1.1. Blind Schools
- 8.1.2. Enterprises & Social Organizations
- 8.1.3. Personal Use
- 8.1.4. Federation & Hospital
- 8.1.5. Others
- 8.2. Market Analysis, Insights and Forecast - by Type
- 8.2.1. Educational Devices & Software
- 8.2.2. Mobility Devices
- 8.2.3. Low Vision Devices
- 8.2.4. Others
- 8.1. Market Analysis, Insights and Forecast - by Application
- 9. Middle East & Africa Assistive Technologies For Visually Impaired Analysis, Insights and Forecast, 2020-2032
- 9.1. Market Analysis, Insights and Forecast - by Application
- 9.1.1. Blind Schools
- 9.1.2. Enterprises & Social Organizations
- 9.1.3. Personal Use
- 9.1.4. Federation & Hospital
- 9.1.5. Others
- 9.2. Market Analysis, Insights and Forecast - by Type
- 9.2.1. Educational Devices & Software
- 9.2.2. Mobility Devices
- 9.2.3. Low Vision Devices
- 9.2.4. Others
- 9.1. Market Analysis, Insights and Forecast - by Application
- 10. Asia Pacific Assistive Technologies For Visually Impaired Analysis, Insights and Forecast, 2020-2032
- 10.1. Market Analysis, Insights and Forecast - by Application
- 10.1.1. Blind Schools
- 10.1.2. Enterprises & Social Organizations
- 10.1.3. Personal Use
- 10.1.4. Federation & Hospital
- 10.1.5. Others
- 10.2. Market Analysis, Insights and Forecast - by Type
- 10.2.1. Educational Devices & Software
- 10.2.2. Mobility Devices
- 10.2.3. Low Vision Devices
- 10.2.4. Others
- 10.1. Market Analysis, Insights and Forecast - by Application
- 11. Competitive Analysis
- 11.1. Global Market Share Analysis 2025
- 11.2. Company Profiles
- 11.2.1 VFO
- 11.2.1.1. Overview
- 11.2.1.2. Products
- 11.2.1.3. SWOT Analysis
- 11.2.1.4. Recent Developments
- 11.2.1.5. Financials (Based on Availability)
- 11.2.2 Amedia
- 11.2.2.1. Overview
- 11.2.2.2. Products
- 11.2.2.3. SWOT Analysis
- 11.2.2.4. Recent Developments
- 11.2.2.5. Financials (Based on Availability)
- 11.2.3 Dolphin Computer Access
- 11.2.3.1. Overview
- 11.2.3.2. Products
- 11.2.3.3. SWOT Analysis
- 11.2.3.4. Recent Developments
- 11.2.3.5. Financials (Based on Availability)
- 11.2.4 Essilor
- 11.2.4.1. Overview
- 11.2.4.2. Products
- 11.2.4.3. SWOT Analysis
- 11.2.4.4. Recent Developments
- 11.2.4.5. Financials (Based on Availability)
- 11.2.5 Cambium Learning
- 11.2.5.1. Overview
- 11.2.5.2. Products
- 11.2.5.3. SWOT Analysis
- 11.2.5.4. Recent Developments
- 11.2.5.5. Financials (Based on Availability)
- 11.2.6 Access Ingenuity
- 11.2.6.1. Overview
- 11.2.6.2. Products
- 11.2.6.3. SWOT Analysis
- 11.2.6.4. Recent Developments
- 11.2.6.5. Financials (Based on Availability)
- 11.2.7 American Thermoform
- 11.2.7.1. Overview
- 11.2.7.2. Products
- 11.2.7.3. SWOT Analysis
- 11.2.7.4. Recent Developments
- 11.2.7.5. Financials (Based on Availability)
- 11.2.8 LVI Low Vision International
- 11.2.8.1. Overview
- 11.2.8.2. Products
- 11.2.8.3. SWOT Analysis
- 11.2.8.4. Recent Developments
- 11.2.8.5. Financials (Based on Availability)
- 11.2.9 ViewPlus
- 11.2.9.1. Overview
- 11.2.9.2. Products
- 11.2.9.3. SWOT Analysis
- 11.2.9.4. Recent Developments
- 11.2.9.5. Financials (Based on Availability)
- 11.2.10 LS&S LLC
- 11.2.10.1. Overview
- 11.2.10.2. Products
- 11.2.10.3. SWOT Analysis
- 11.2.10.4. Recent Developments
- 11.2.10.5. Financials (Based on Availability)
- 11.2.1 VFO
List of Figures
- Figure 1: Global Assistive Technologies For Visually Impaired Revenue Breakdown (million, %) by Region 2025 & 2033
- Figure 2: North America Assistive Technologies For Visually Impaired Revenue (million), by Application 2025 & 2033
- Figure 3: North America Assistive Technologies For Visually Impaired Revenue Share (%), by Application 2025 & 2033
- Figure 4: North America Assistive Technologies For Visually Impaired Revenue (million), by Type 2025 & 2033
- Figure 5: North America Assistive Technologies For Visually Impaired Revenue Share (%), by Type 2025 & 2033
- Figure 6: North America Assistive Technologies For Visually Impaired Revenue (million), by Country 2025 & 2033
- Figure 7: North America Assistive Technologies For Visually Impaired Revenue Share (%), by Country 2025 & 2033
- Figure 8: South America Assistive Technologies For Visually Impaired Revenue (million), by Application 2025 & 2033
- Figure 9: South America Assistive Technologies For Visually Impaired Revenue Share (%), by Application 2025 & 2033
- Figure 10: South America Assistive Technologies For Visually Impaired Revenue (million), by Type 2025 & 2033
- Figure 11: South America Assistive Technologies For Visually Impaired Revenue Share (%), by Type 2025 & 2033
- Figure 12: South America Assistive Technologies For Visually Impaired Revenue (million), by Country 2025 & 2033
- Figure 13: South America Assistive Technologies For Visually Impaired Revenue Share (%), by Country 2025 & 2033
- Figure 14: Europe Assistive Technologies For Visually Impaired Revenue (million), by Application 2025 & 2033
- Figure 15: Europe Assistive Technologies For Visually Impaired Revenue Share (%), by Application 2025 & 2033
- Figure 16: Europe Assistive Technologies For Visually Impaired Revenue (million), by Type 2025 & 2033
- Figure 17: Europe Assistive Technologies For Visually Impaired Revenue Share (%), by Type 2025 & 2033
- Figure 18: Europe Assistive Technologies For Visually Impaired Revenue (million), by Country 2025 & 2033
- Figure 19: Europe Assistive Technologies For Visually Impaired Revenue Share (%), by Country 2025 & 2033
- Figure 20: Middle East & Africa Assistive Technologies For Visually Impaired Revenue (million), by Application 2025 & 2033
- Figure 21: Middle East & Africa Assistive Technologies For Visually Impaired Revenue Share (%), by Application 2025 & 2033
- Figure 22: Middle East & Africa Assistive Technologies For Visually Impaired Revenue (million), by Type 2025 & 2033
- Figure 23: Middle East & Africa Assistive Technologies For Visually Impaired Revenue Share (%), by Type 2025 & 2033
- Figure 24: Middle East & Africa Assistive Technologies For Visually Impaired Revenue (million), by Country 2025 & 2033
- Figure 25: Middle East & Africa Assistive Technologies For Visually Impaired Revenue Share (%), by Country 2025 & 2033
- Figure 26: Asia Pacific Assistive Technologies For Visually Impaired Revenue (million), by Application 2025 & 2033
- Figure 27: Asia Pacific Assistive Technologies For Visually Impaired Revenue Share (%), by Application 2025 & 2033
- Figure 28: Asia Pacific Assistive Technologies For Visually Impaired Revenue (million), by Type 2025 & 2033
- Figure 29: Asia Pacific Assistive Technologies For Visually Impaired Revenue Share (%), by Type 2025 & 2033
- Figure 30: Asia Pacific Assistive Technologies For Visually Impaired Revenue (million), by Country 2025 & 2033
- Figure 31: Asia Pacific Assistive Technologies For Visually Impaired Revenue Share (%), by Country 2025 & 2033
List of Tables
- Table 1: Global Assistive Technologies For Visually Impaired Revenue million Forecast, by Application 2020 & 2033
- Table 2: Global Assistive Technologies For Visually Impaired Revenue million Forecast, by Type 2020 & 2033
- Table 3: Global Assistive Technologies For Visually Impaired Revenue million Forecast, by Region 2020 & 2033
- Table 4: Global Assistive Technologies For Visually Impaired Revenue million Forecast, by Application 2020 & 2033
- Table 5: Global Assistive Technologies For Visually Impaired Revenue million Forecast, by Type 2020 & 2033
- Table 6: Global Assistive Technologies For Visually Impaired Revenue million Forecast, by Country 2020 & 2033
- Table 7: United States Assistive Technologies For Visually Impaired Revenue (million) Forecast, by Application 2020 & 2033
- Table 8: Canada Assistive Technologies For Visually Impaired Revenue (million) Forecast, by Application 2020 & 2033
- Table 9: Mexico Assistive Technologies For Visually Impaired Revenue (million) Forecast, by Application 2020 & 2033
- Table 10: Global Assistive Technologies For Visually Impaired Revenue million Forecast, by Application 2020 & 2033
- Table 11: Global Assistive Technologies For Visually Impaired Revenue million Forecast, by Type 2020 & 2033
- Table 12: Global Assistive Technologies For Visually Impaired Revenue million Forecast, by Country 2020 & 2033
- Table 13: Brazil Assistive Technologies For Visually Impaired Revenue (million) Forecast, by Application 2020 & 2033
- Table 14: Argentina Assistive Technologies For Visually Impaired Revenue (million) Forecast, by Application 2020 & 2033
- Table 15: Rest of South America Assistive Technologies For Visually Impaired Revenue (million) Forecast, by Application 2020 & 2033
- Table 16: Global Assistive Technologies For Visually Impaired Revenue million Forecast, by Application 2020 & 2033
- Table 17: Global Assistive Technologies For Visually Impaired Revenue million Forecast, by Type 2020 & 2033
- Table 18: Global Assistive Technologies For Visually Impaired Revenue million Forecast, by Country 2020 & 2033
- Table 19: United Kingdom Assistive Technologies For Visually Impaired Revenue (million) Forecast, by Application 2020 & 2033
- Table 20: Germany Assistive Technologies For Visually Impaired Revenue (million) Forecast, by Application 2020 & 2033
- Table 21: France Assistive Technologies For Visually Impaired Revenue (million) Forecast, by Application 2020 & 2033
- Table 22: Italy Assistive Technologies For Visually Impaired Revenue (million) Forecast, by Application 2020 & 2033
- Table 23: Spain Assistive Technologies For Visually Impaired Revenue (million) Forecast, by Application 2020 & 2033
- Table 24: Russia Assistive Technologies For Visually Impaired Revenue (million) Forecast, by Application 2020 & 2033
- Table 25: Benelux Assistive Technologies For Visually Impaired Revenue (million) Forecast, by Application 2020 & 2033
- Table 26: Nordics Assistive Technologies For Visually Impaired Revenue (million) Forecast, by Application 2020 & 2033
- Table 27: Rest of Europe Assistive Technologies For Visually Impaired Revenue (million) Forecast, by Application 2020 & 2033
- Table 28: Global Assistive Technologies For Visually Impaired Revenue million Forecast, by Application 2020 & 2033
- Table 29: Global Assistive Technologies For Visually Impaired Revenue million Forecast, by Type 2020 & 2033
- Table 30: Global Assistive Technologies For Visually Impaired Revenue million Forecast, by Country 2020 & 2033
- Table 31: Turkey Assistive Technologies For Visually Impaired Revenue (million) Forecast, by Application 2020 & 2033
- Table 32: Israel Assistive Technologies For Visually Impaired Revenue (million) Forecast, by Application 2020 & 2033
- Table 33: GCC Assistive Technologies For Visually Impaired Revenue (million) Forecast, by Application 2020 & 2033
- Table 34: North Africa Assistive Technologies For Visually Impaired Revenue (million) Forecast, by Application 2020 & 2033
- Table 35: South Africa Assistive Technologies For Visually Impaired Revenue (million) Forecast, by Application 2020 & 2033
- Table 36: Rest of Middle East & Africa Assistive Technologies For Visually Impaired Revenue (million) Forecast, by Application 2020 & 2033
- Table 37: Global Assistive Technologies For Visually Impaired Revenue million Forecast, by Application 2020 & 2033
- Table 38: Global Assistive Technologies For Visually Impaired Revenue million Forecast, by Type 2020 & 2033
- Table 39: Global Assistive Technologies For Visually Impaired Revenue million Forecast, by Country 2020 & 2033
- Table 40: China Assistive Technologies For Visually Impaired Revenue (million) Forecast, by Application 2020 & 2033
- Table 41: India Assistive Technologies For Visually Impaired Revenue (million) Forecast, by Application 2020 & 2033
- Table 42: Japan Assistive Technologies For Visually Impaired Revenue (million) Forecast, by Application 2020 & 2033
- Table 43: South Korea Assistive Technologies For Visually Impaired Revenue (million) Forecast, by Application 2020 & 2033
- Table 44: ASEAN Assistive Technologies For Visually Impaired Revenue (million) Forecast, by Application 2020 & 2033
- Table 45: Oceania Assistive Technologies For Visually Impaired Revenue (million) Forecast, by Application 2020 & 2033
- Table 46: Rest of Asia Pacific Assistive Technologies For Visually Impaired Revenue (million) Forecast, by Application 2020 & 2033
Frequently Asked Questions
1. What is the projected Compound Annual Growth Rate (CAGR) of the Assistive Technologies For Visually Impaired?
The projected CAGR is approximately 4.8%.
2. Which companies are prominent players in the Assistive Technologies For Visually Impaired?
Key companies in the market include VFO, Amedia, Dolphin Computer Access, Essilor, Cambium Learning, Access Ingenuity, American Thermoform, LVI Low Vision International, ViewPlus, LS&S, LLC.
3. What are the main segments of the Assistive Technologies For Visually Impaired?
The market segments include Application, Type.
4. Can you provide details about the market size?
The market size is estimated to be USD 7299 million as of 2022.
5. What are some drivers contributing to market growth?
N/A
6. What are the notable trends driving market growth?
N/A
7. Are there any restraints impacting market growth?
N/A
8. Can you provide examples of recent developments in the market?
N/A
9. What pricing options are available for accessing the report?
Pricing options include single-user, multi-user, and enterprise licenses priced at USD 3950.00, USD 5925.00, and USD 7900.00 respectively.
10. Is the market size provided in terms of value or volume?
The market size is provided in terms of value, measured in million.
11. Are there any specific market keywords associated with the report?
Yes, the market keyword associated with the report is "Assistive Technologies For Visually Impaired," which aids in identifying and referencing the specific market segment covered.
12. How do I determine which pricing option suits my needs best?
The pricing options vary based on user requirements and access needs. Individual users may opt for single-user licenses, while businesses requiring broader access may choose multi-user or enterprise licenses for cost-effective access to the report.
13. Are there any additional resources or data provided in the Assistive Technologies For Visually Impaired report?
While the report offers comprehensive insights, it's advisable to review the specific contents or supplementary materials provided to ascertain if additional resources or data are available.
14. How can I stay updated on further developments or reports in the Assistive Technologies For Visually Impaired?
To stay informed about further developments, trends, and reports in the Assistive Technologies For Visually Impaired, consider subscribing to industry newsletters, following relevant companies and organizations, or regularly checking reputable industry news sources and publications.
Methodology
Step 1 - Identification of Relevant Samples Size from Population Database


Step 2 - Approaches for Defining Global Market Size (Value, Volume* & Price*)

Note*: In applicable scenarios
Step 3 - Data Sources
Primary Research
- Web Analytics
- Survey Reports
- Research Institute
- Latest Research Reports
- Opinion Leaders
Secondary Research
- Annual Reports
- White Paper
- Latest Press Release
- Industry Association
- Paid Database
- Investor Presentations

Step 4 - Data Triangulation
Involves using different sources of information in order to increase the validity of a study
These sources are likely to be stakeholders in a program - participants, other researchers, program staff, other community members, and so on.
Then we put all data in single framework & apply various statistical tools to find out the dynamic on the market.
During the analysis stage, feedback from the stakeholder groups would be compared to determine areas of agreement as well as areas of divergence