

Key Insights
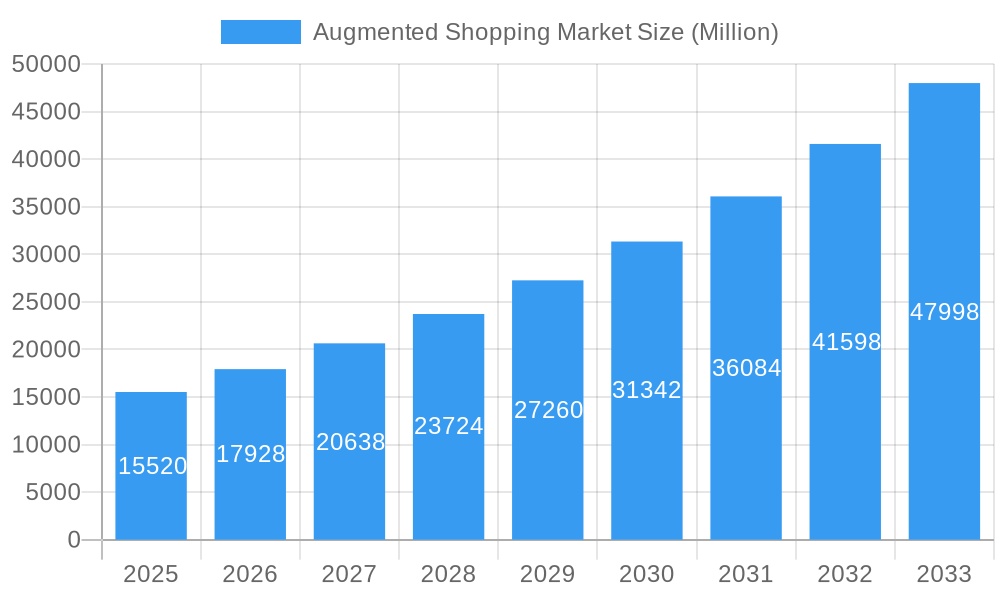
The augmented reality (AR) shopping market is experiencing explosive growth, projected to reach \$15.52 billion in 2025 and maintain a robust Compound Annual Growth Rate (CAGR) of 15.78% from 2025 to 2033. This surge is driven by several key factors. Firstly, the increasing adoption of smartphones and other smart devices equipped with advanced AR capabilities provides a readily available platform for immersive shopping experiences. Secondly, consumers are increasingly drawn to interactive and engaging shopping methods that allow them to visualize products in their own spaces before purchasing, reducing purchase uncertainty and enhancing the overall shopping journey. Thirdly, retailers are recognizing the immense potential of AR to boost sales, improve customer engagement, and differentiate themselves from competitors. This has led to significant investment in AR technology and its integration into various retail strategies, encompassing virtual try-ons, interactive product demonstrations, and personalized shopping experiences. The market's success hinges on overcoming technical challenges like ensuring seamless integration across different devices and platforms and addressing concerns related to data privacy and security.
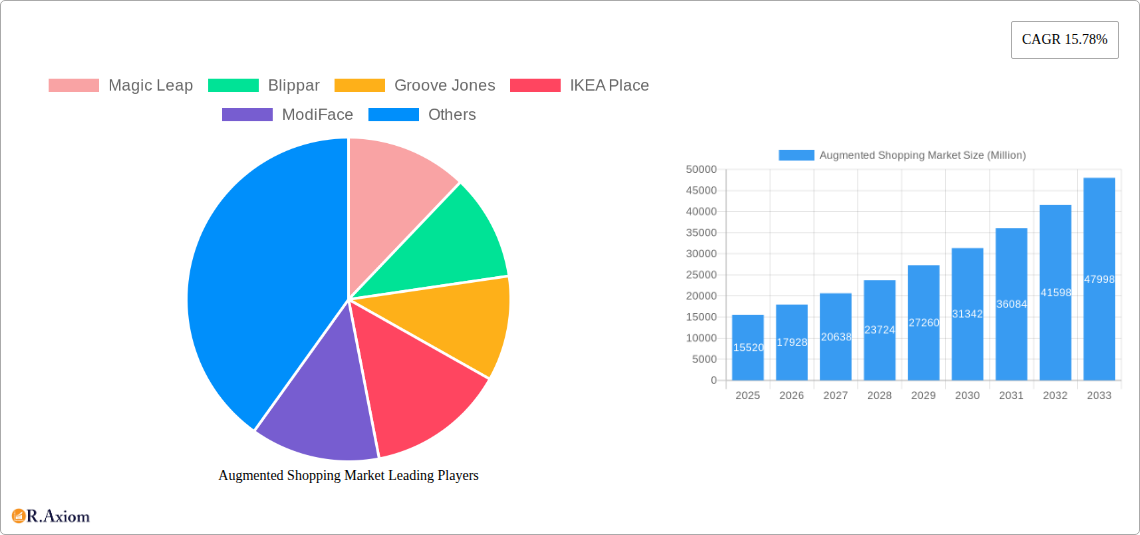
Augmented Shopping Market Market Size (In Billion)
The market is segmented across various applications, including virtual try-ons (makeup, clothing, accessories), product visualization (furniture, home décor), and interactive advertising. Key players like Magic Leap, Blippar, Groove Jones, IKEA Place, ModiFace, Obsess, Microsoft HoloLens, Zugara Inc, PTC Vuforia, and Apple are driving innovation and shaping the market landscape through continuous development of advanced AR technologies and engaging consumer applications. The geographic distribution of the market is expected to be broadly spread, with North America and Europe leading initially, followed by a rapid expansion in Asia-Pacific and other regions as AR technology becomes more accessible and affordable. The future of AR shopping promises even more sophisticated and immersive experiences, incorporating features such as personalized recommendations, virtual assistants, and community-based interactions.
Augmented Shopping Market Company Market Share
This comprehensive report provides a detailed analysis of the Augmented Shopping Market from 2019 to 2033, offering invaluable insights for industry stakeholders, investors, and businesses seeking to navigate this rapidly evolving landscape. The study period covers 2019-2024 (Historical Period), with 2025 as the base and estimated year, and a forecast period spanning 2025-2033. The report leverages extensive market research, data analysis, and expert insights to deliver actionable intelligence. The market is valued at xx Million in 2025 and is projected to reach xx Million by 2033, exhibiting a CAGR of xx%.
Augmented Shopping Market Market Concentration & Innovation
The Augmented Shopping Market exhibits a moderately concentrated landscape, with a handful of major players holding significant market share. However, the market is also characterized by considerable innovation, driven by advancements in AR technology, increasing consumer adoption of smartphones and smart devices, and the growing demand for immersive shopping experiences.
Market share data for key players such as Apple Inc, PTC Vuforia, and others are analyzed, revealing a dynamic competitive environment with ongoing mergers and acquisitions (M&A) activity. The total value of M&A deals in the sector during the historical period reached approximately xx Million.
- Innovation Drivers: Advancements in computer vision, sensor technology, and 3D modeling are key drivers, enabling the creation of increasingly realistic and engaging augmented shopping experiences.
- Regulatory Frameworks: Government regulations concerning data privacy and consumer protection influence market growth and development.
- Product Substitutes: Traditional e-commerce and in-store shopping remain primary substitutes, but augmented shopping offers unique advantages.
- End-User Trends: Millennials and Gen Z demonstrate higher adoption rates due to their familiarity with technology.
- M&A Activities: Strategic acquisitions and partnerships are reshaping the market landscape, facilitating technology integration and market expansion.
Augmented Shopping Market Industry Trends & Insights
The Augmented Shopping Market is witnessing exponential growth fueled by several key factors. The increasing penetration of smartphones and other smart devices has broadened the reach of AR technology, enabling more consumers to access augmented shopping experiences. This trend is further amplified by the rising adoption of social commerce platforms that integrate AR features. The market is experiencing disruption through the integration of AI and machine learning, which allows for personalized shopping recommendations and enhanced product visualization. Consumer preferences are shifting towards convenience and interactive experiences, driving demand for augmented shopping solutions that offer virtual try-ons, product demonstrations, and interactive catalogs. The competitive dynamics are marked by collaborations, strategic partnerships, and the continuous development of innovative AR technologies. The market penetration rate in 2025 is estimated at xx%, with a projected increase to xx% by 2033.
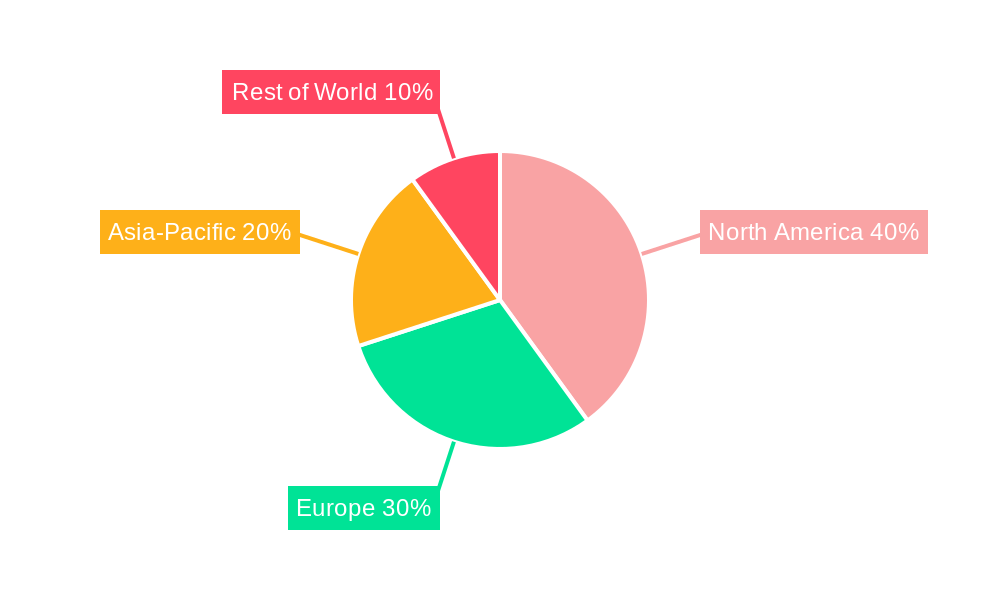
Dominant Markets & Segments in Augmented Shopping Market
The North American region currently stands as the leading force in the Augmented Shopping Market, propelled by its sophisticated technological infrastructure, robust consumer spending capabilities, and an early embrace of augmented reality (AR) technologies. Within this powerhouse region, the United States commands a significant portion of market share. This dominance is further amplified by the widespread availability and affordability of smartphones and other smart devices, fostering a fertile ground for AR adoption. Major industry players are actively investing in AR research and development, contributing to the market's expansion.
- Key Drivers in North America:
- A well-established technological ecosystem that readily supports the development and widespread deployment of AR applications.
- High rates of smartphone and smart device ownership, providing a readily accessible user base for AR experiences.
- Substantial capital investment from leading companies pushing the boundaries of AR innovation.
- A consumer base with strong purchasing power and an inherent openness to integrating new technological advancements into their shopping habits.
- A regulatory landscape that encourages and facilitates technological progress and innovation in the AR space.
Beyond North America, Europe and the Asia Pacific are rapidly emerging as crucial growth centers. These regions are witnessing an accelerated expansion due to escalating smartphone penetration rates and a burgeoning consumer appetite for more engaging and interactive shopping journeys. The increasing demand for immersive experiences is a significant factor driving this growth.
Augmented Shopping Market Product Developments
The Augmented Shopping Market is experiencing a wave of innovative product developments designed to revolutionize the way consumers discover and interact with products. Key advancements include increasingly sophisticated virtual try-on technologies, allowing customers to visualize apparel, accessories, and even furniture in their own space with remarkable accuracy. Furthermore, the creation of interactive 3D product models provides a level of detail and engagement far beyond traditional 2D images. The seamless integration of AR experiences with social media platforms is also a significant trend, enabling effortless sharing and discovery. These innovations collectively contribute to superior product visualization, highly personalized shopping recommendations, and profoundly enhanced customer engagement. The compelling market fit for these developments stems from the escalating consumer desire for shopping experiences that are not only personalized and interactive but also exceptionally efficient and convenient.
Report Scope & Segmentation Analysis
This report segments the Augmented Shopping Market based on technology (computer vision, location-based services, etc.), application (retail, fashion, beauty, furniture, etc.), and geography (North America, Europe, Asia Pacific, etc.). Growth projections for each segment are included, along with market size estimations and analysis of competitive dynamics. For example, the retail segment is projected to hold the largest market share throughout the forecast period, driven by widespread adoption of AR-enabled shopping apps and the growing popularity of virtual try-on technologies. The fashion and beauty sectors are also key segments, exhibiting strong growth potential.
Key Drivers of Augmented Shopping Market Growth
The Augmented Shopping Market is experiencing substantial growth due to a confluence of factors. Advancements in AR technology, such as improved computer vision and 3D rendering capabilities, enable more realistic and immersive shopping experiences. The increasing affordability and accessibility of AR-enabled devices further drive market expansion. Furthermore, evolving consumer preferences towards personalized and interactive shopping experiences, along with supportive government policies and initiatives promoting technological innovation, fuel this growth.
Challenges in the Augmented Shopping Market Sector
Despite its promising outlook, the Augmented Shopping Market faces several challenges. High development costs and the need for specialized technical expertise can hinder market entry for smaller companies. Concerns about data privacy and security, alongside the need for robust infrastructure to support AR applications, pose significant barriers. Finally, the competitive landscape is intensely dynamic, with established players and new entrants vying for market share. These factors collectively impact the overall growth trajectory of the Augmented Shopping Market.
Emerging Opportunities in Augmented Shopping Market
The Augmented Shopping Market is brimming with exciting opportunities poised to drive significant future growth. A particularly promising avenue lies in the expansion into new markets and applications beyond traditional retail, including impactful uses in sectors like healthcare for virtual patient education and surgical simulations, and in education for immersive learning experiences. The strategic integration of advanced technologies such as Artificial Intelligence (AI), machine learning, and blockchain promises to elevate the user experience to unprecedented levels, while also paving the way for novel and lucrative business models. Moreover, the growing consumer consciousness around environmental impact fuels the demand for sustainable and eco-friendly AR solutions, offering a clear path for brands committed to responsible practices. These multifaceted opportunities collectively signal a trajectory of substantial and sustained growth for the augmented shopping landscape.
Leading Players in the Augmented Shopping Market Market
- Magic Leap
- Blippar
- Groove Jones
- IKEA Place
- ModiFace
- Obsess
- HoloLens
- Zugara Inc
- PTC Vuforia
- Apple Inc
- List Not Exhaustive
Key Developments in Augmented Shopping Market Industry
- August 2023: Blackjack Promotions, in collaboration with Dufry, successfully launched its inaugural immersive AR campaign targeted at families. This initiative underscores the expanding utility of augmented reality within the dynamic travel retail sector.
- May 2024: A landmark partnership was announced between tech giant Google and AR specialist Magic Leap. This collaboration aims to jointly develop cutting-edge AR and optical solutions, a move anticipated to dramatically accelerate innovation and broader market adoption within the augmented reality ecosystem.
Strategic Outlook for Augmented Shopping Market Market
The Augmented Shopping Market is on a clear path towards sustained and robust growth. This upward trajectory is fueled by continuous technological advancements that enhance AR capabilities, a growing consumer base increasingly comfortable with and eager to adopt AR technologies, and the strategic expansion of AR applications into diverse new sectors. To capitalize on this potential, the strategic focus must be on cultivating and deploying innovative AR solutions that prioritize an exceptional user experience, proactively address legitimate data privacy concerns, and deliver truly personalized and memorable shopping journeys. By embracing these strategic imperatives, businesses can ensure sustainable growth and play a pivotal role in shaping the future evolution of augmented shopping experiences.
Augmented Shopping Market Segmentation
-
1. Component
- 1.1. Solutions
- 1.2. Services
-
2. Application
- 2.1. Furniture and Lighting
- 2.2. Beauty and Cosmetics
- 2.3. Apparel Fitting
- 2.4. Grocery Shopping
- 2.5. Footwear
- 2.6. Other Applications
Augmented Shopping Market Segmentation By Geography
-
1. North America
- 1.1. United States
- 1.2. Canada
- 1.3. Rest of North America
-
2. Europe
- 2.1. Germany
- 2.2. United Kingdom
- 2.3. France
- 2.4. Russia
- 2.5. Spain
- 2.6. Rest of Europe
-
3. Asia Pacific
- 3.1. India
- 3.2. China
- 3.3. Japan
- 3.4. Rest of Asia Pacific
-
4. South America
- 4.1. Brazil
- 4.2. Argentina
- 4.3. Rest of South America
-
5. Middle East
- 5.1. United Arab Emirates
- 5.2. Saudi Arabia
- 5.3. Rest of Middle East
Augmented Shopping Market Regional Market Share
Geographic Coverage of Augmented Shopping Market
Augmented Shopping Market REPORT HIGHLIGHTS
| Aspects | Details |
|---|---|
| Study Period | 2020-2034 |
| Base Year | 2025 |
| Estimated Year | 2026 |
| Forecast Period | 2026-2034 |
| Historical Period | 2020-2025 |
| Growth Rate | CAGR of 15.78% from 2020-2034 |
| Segmentation |
|
Table of Contents
- 1. Introduction
- 1.1. Research Scope
- 1.2. Market Segmentation
- 1.3. Research Objective
- 1.4. Definitions and Assumptions
- 2. Executive Summary
- 2.1. Market Snapshot
- 3. Market Dynamics
- 3.1. Market Drivers
- 3.2. Market Restrains
- 3.3. Market Trends
- 3.4. Market Opportunities
- 4. Market Factor Analysis
- 4.1. Porters Five Forces
- 4.1.1. Bargaining Power of Suppliers
- 4.1.2. Bargaining Power of Buyers
- 4.1.3. Threat of New Entrants
- 4.1.4. Threat of Substitutes
- 4.1.5. Competitive Rivalry
- 4.2. PESTEL analysis
- 4.3. BCG Analysis
- 4.3.1. Stars (High Growth, High Market Share)
- 4.3.2. Cash Cows (Low Growth, High Market Share)
- 4.3.3. Question Mark (High Growth, Low Market Share)
- 4.3.4. Dogs (Low Growth, Low Market Share)
- 4.4. Ansoff Matrix Analysis
- 4.5. Supply Chain Analysis
- 4.6. Regulatory Landscape
- 4.7. Current Market Potential and Opportunity Assessment (TAM–SAM–SOM Framework)
- 4.8. RAX Analyst Note
- 4.1. Porters Five Forces
- 5. Market Analysis, Insights and Forecast 2021-2033
- 5.1. Market Analysis, Insights and Forecast - by Component
- 5.1.1. Solutions
- 5.1.2. Services
- 5.2. Market Analysis, Insights and Forecast - by Application
- 5.2.1. Furniture and Lighting
- 5.2.2. Beauty and Cosmetics
- 5.2.3. Apparel Fitting
- 5.2.4. Grocery Shopping
- 5.2.5. Footwear
- 5.2.6. Other Applications
- 5.3. Market Analysis, Insights and Forecast - by Region
- 5.3.1. North America
- 5.3.2. Europe
- 5.3.3. Asia Pacific
- 5.3.4. South America
- 5.3.5. Middle East
- 5.1. Market Analysis, Insights and Forecast - by Component
- 6. Global Augmented Shopping Market Analysis, Insights and Forecast, 2021-2033
- 6.1. Market Analysis, Insights and Forecast - by Component
- 6.1.1. Solutions
- 6.1.2. Services
- 6.2. Market Analysis, Insights and Forecast - by Application
- 6.2.1. Furniture and Lighting
- 6.2.2. Beauty and Cosmetics
- 6.2.3. Apparel Fitting
- 6.2.4. Grocery Shopping
- 6.2.5. Footwear
- 6.2.6. Other Applications
- 6.1. Market Analysis, Insights and Forecast - by Component
- 7. North America Augmented Shopping Market Analysis, Insights and Forecast, 2020-2032
- 7.1. Market Analysis, Insights and Forecast - by Component
- 7.1.1. Solutions
- 7.1.2. Services
- 7.2. Market Analysis, Insights and Forecast - by Application
- 7.2.1. Furniture and Lighting
- 7.2.2. Beauty and Cosmetics
- 7.2.3. Apparel Fitting
- 7.2.4. Grocery Shopping
- 7.2.5. Footwear
- 7.2.6. Other Applications
- 7.1. Market Analysis, Insights and Forecast - by Component
- 8. Europe Augmented Shopping Market Analysis, Insights and Forecast, 2020-2032
- 8.1. Market Analysis, Insights and Forecast - by Component
- 8.1.1. Solutions
- 8.1.2. Services
- 8.2. Market Analysis, Insights and Forecast - by Application
- 8.2.1. Furniture and Lighting
- 8.2.2. Beauty and Cosmetics
- 8.2.3. Apparel Fitting
- 8.2.4. Grocery Shopping
- 8.2.5. Footwear
- 8.2.6. Other Applications
- 8.1. Market Analysis, Insights and Forecast - by Component
- 9. Asia Pacific Augmented Shopping Market Analysis, Insights and Forecast, 2020-2032
- 9.1. Market Analysis, Insights and Forecast - by Component
- 9.1.1. Solutions
- 9.1.2. Services
- 9.2. Market Analysis, Insights and Forecast - by Application
- 9.2.1. Furniture and Lighting
- 9.2.2. Beauty and Cosmetics
- 9.2.3. Apparel Fitting
- 9.2.4. Grocery Shopping
- 9.2.5. Footwear
- 9.2.6. Other Applications
- 9.1. Market Analysis, Insights and Forecast - by Component
- 10. South America Augmented Shopping Market Analysis, Insights and Forecast, 2020-2032
- 10.1. Market Analysis, Insights and Forecast - by Component
- 10.1.1. Solutions
- 10.1.2. Services
- 10.2. Market Analysis, Insights and Forecast - by Application
- 10.2.1. Furniture and Lighting
- 10.2.2. Beauty and Cosmetics
- 10.2.3. Apparel Fitting
- 10.2.4. Grocery Shopping
- 10.2.5. Footwear
- 10.2.6. Other Applications
- 10.1. Market Analysis, Insights and Forecast - by Component
- 11. Middle East Augmented Shopping Market Analysis, Insights and Forecast, 2020-2032
- 11.1. Market Analysis, Insights and Forecast - by Component
- 11.1.1. Solutions
- 11.1.2. Services
- 11.2. Market Analysis, Insights and Forecast - by Application
- 11.2.1. Furniture and Lighting
- 11.2.2. Beauty and Cosmetics
- 11.2.3. Apparel Fitting
- 11.2.4. Grocery Shopping
- 11.2.5. Footwear
- 11.2.6. Other Applications
- 11.1. Market Analysis, Insights and Forecast - by Component
- 12. Competitive Analysis
- 12.1. Company Profiles
- 12.1.1 Magic Leap
- 12.1.1.1. Company Overview
- 12.1.1.2. Products
- 12.1.1.3. Company Financials
- 12.1.1.4. SWOT Analysis
- 12.1.2 Blippar
- 12.1.2.1. Company Overview
- 12.1.2.2. Products
- 12.1.2.3. Company Financials
- 12.1.2.4. SWOT Analysis
- 12.1.3 Groove Jones
- 12.1.3.1. Company Overview
- 12.1.3.2. Products
- 12.1.3.3. Company Financials
- 12.1.3.4. SWOT Analysis
- 12.1.4 IKEA Place
- 12.1.4.1. Company Overview
- 12.1.4.2. Products
- 12.1.4.3. Company Financials
- 12.1.4.4. SWOT Analysis
- 12.1.5 ModiFace
- 12.1.5.1. Company Overview
- 12.1.5.2. Products
- 12.1.5.3. Company Financials
- 12.1.5.4. SWOT Analysis
- 12.1.6 Obsess
- 12.1.6.1. Company Overview
- 12.1.6.2. Products
- 12.1.6.3. Company Financials
- 12.1.6.4. SWOT Analysis
- 12.1.7 HoloLens
- 12.1.7.1. Company Overview
- 12.1.7.2. Products
- 12.1.7.3. Company Financials
- 12.1.7.4. SWOT Analysis
- 12.1.8 Zugara Inc
- 12.1.8.1. Company Overview
- 12.1.8.2. Products
- 12.1.8.3. Company Financials
- 12.1.8.4. SWOT Analysis
- 12.1.9 PTC Vuforia
- 12.1.9.1. Company Overview
- 12.1.9.2. Products
- 12.1.9.3. Company Financials
- 12.1.9.4. SWOT Analysis
- 12.1.10 Apple Inc **List Not Exhaustive
- 12.1.10.1. Company Overview
- 12.1.10.2. Products
- 12.1.10.3. Company Financials
- 12.1.10.4. SWOT Analysis
- 12.1.1 Magic Leap
- 12.2. Market Entropy
- 12.2.1 Company's Key Areas Served
- 12.2.2 Recent Developments
- 12.3. Company Market Share Analysis 2025
- 12.3.1 Top 5 Companies Market Share Analysis
- 12.3.2 Top 3 Companies Market Share Analysis
- 12.4. List of Potential Customers
- 13. Research Methodology
List of Figures
- Figure 1: Global Augmented Shopping Market Revenue Breakdown (Million, %) by Region 2025 & 2033
- Figure 2: Global Augmented Shopping Market Volume Breakdown (Billion, %) by Region 2025 & 2033
- Figure 3: North America Augmented Shopping Market Revenue (Million), by Component 2025 & 2033
- Figure 4: North America Augmented Shopping Market Volume (Billion), by Component 2025 & 2033
- Figure 5: North America Augmented Shopping Market Revenue Share (%), by Component 2025 & 2033
- Figure 6: North America Augmented Shopping Market Volume Share (%), by Component 2025 & 2033
- Figure 7: North America Augmented Shopping Market Revenue (Million), by Application 2025 & 2033
- Figure 8: North America Augmented Shopping Market Volume (Billion), by Application 2025 & 2033
- Figure 9: North America Augmented Shopping Market Revenue Share (%), by Application 2025 & 2033
- Figure 10: North America Augmented Shopping Market Volume Share (%), by Application 2025 & 2033
- Figure 11: North America Augmented Shopping Market Revenue (Million), by Country 2025 & 2033
- Figure 12: North America Augmented Shopping Market Volume (Billion), by Country 2025 & 2033
- Figure 13: North America Augmented Shopping Market Revenue Share (%), by Country 2025 & 2033
- Figure 14: North America Augmented Shopping Market Volume Share (%), by Country 2025 & 2033
- Figure 15: Europe Augmented Shopping Market Revenue (Million), by Component 2025 & 2033
- Figure 16: Europe Augmented Shopping Market Volume (Billion), by Component 2025 & 2033
- Figure 17: Europe Augmented Shopping Market Revenue Share (%), by Component 2025 & 2033
- Figure 18: Europe Augmented Shopping Market Volume Share (%), by Component 2025 & 2033
- Figure 19: Europe Augmented Shopping Market Revenue (Million), by Application 2025 & 2033
- Figure 20: Europe Augmented Shopping Market Volume (Billion), by Application 2025 & 2033
- Figure 21: Europe Augmented Shopping Market Revenue Share (%), by Application 2025 & 2033
- Figure 22: Europe Augmented Shopping Market Volume Share (%), by Application 2025 & 2033
- Figure 23: Europe Augmented Shopping Market Revenue (Million), by Country 2025 & 2033
- Figure 24: Europe Augmented Shopping Market Volume (Billion), by Country 2025 & 2033
- Figure 25: Europe Augmented Shopping Market Revenue Share (%), by Country 2025 & 2033
- Figure 26: Europe Augmented Shopping Market Volume Share (%), by Country 2025 & 2033
- Figure 27: Asia Pacific Augmented Shopping Market Revenue (Million), by Component 2025 & 2033
- Figure 28: Asia Pacific Augmented Shopping Market Volume (Billion), by Component 2025 & 2033
- Figure 29: Asia Pacific Augmented Shopping Market Revenue Share (%), by Component 2025 & 2033
- Figure 30: Asia Pacific Augmented Shopping Market Volume Share (%), by Component 2025 & 2033
- Figure 31: Asia Pacific Augmented Shopping Market Revenue (Million), by Application 2025 & 2033
- Figure 32: Asia Pacific Augmented Shopping Market Volume (Billion), by Application 2025 & 2033
- Figure 33: Asia Pacific Augmented Shopping Market Revenue Share (%), by Application 2025 & 2033
- Figure 34: Asia Pacific Augmented Shopping Market Volume Share (%), by Application 2025 & 2033
- Figure 35: Asia Pacific Augmented Shopping Market Revenue (Million), by Country 2025 & 2033
- Figure 36: Asia Pacific Augmented Shopping Market Volume (Billion), by Country 2025 & 2033
- Figure 37: Asia Pacific Augmented Shopping Market Revenue Share (%), by Country 2025 & 2033
- Figure 38: Asia Pacific Augmented Shopping Market Volume Share (%), by Country 2025 & 2033
- Figure 39: South America Augmented Shopping Market Revenue (Million), by Component 2025 & 2033
- Figure 40: South America Augmented Shopping Market Volume (Billion), by Component 2025 & 2033
- Figure 41: South America Augmented Shopping Market Revenue Share (%), by Component 2025 & 2033
- Figure 42: South America Augmented Shopping Market Volume Share (%), by Component 2025 & 2033
- Figure 43: South America Augmented Shopping Market Revenue (Million), by Application 2025 & 2033
- Figure 44: South America Augmented Shopping Market Volume (Billion), by Application 2025 & 2033
- Figure 45: South America Augmented Shopping Market Revenue Share (%), by Application 2025 & 2033
- Figure 46: South America Augmented Shopping Market Volume Share (%), by Application 2025 & 2033
- Figure 47: South America Augmented Shopping Market Revenue (Million), by Country 2025 & 2033
- Figure 48: South America Augmented Shopping Market Volume (Billion), by Country 2025 & 2033
- Figure 49: South America Augmented Shopping Market Revenue Share (%), by Country 2025 & 2033
- Figure 50: South America Augmented Shopping Market Volume Share (%), by Country 2025 & 2033
- Figure 51: Middle East Augmented Shopping Market Revenue (Million), by Component 2025 & 2033
- Figure 52: Middle East Augmented Shopping Market Volume (Billion), by Component 2025 & 2033
- Figure 53: Middle East Augmented Shopping Market Revenue Share (%), by Component 2025 & 2033
- Figure 54: Middle East Augmented Shopping Market Volume Share (%), by Component 2025 & 2033
- Figure 55: Middle East Augmented Shopping Market Revenue (Million), by Application 2025 & 2033
- Figure 56: Middle East Augmented Shopping Market Volume (Billion), by Application 2025 & 2033
- Figure 57: Middle East Augmented Shopping Market Revenue Share (%), by Application 2025 & 2033
- Figure 58: Middle East Augmented Shopping Market Volume Share (%), by Application 2025 & 2033
- Figure 59: Middle East Augmented Shopping Market Revenue (Million), by Country 2025 & 2033
- Figure 60: Middle East Augmented Shopping Market Volume (Billion), by Country 2025 & 2033
- Figure 61: Middle East Augmented Shopping Market Revenue Share (%), by Country 2025 & 2033
- Figure 62: Middle East Augmented Shopping Market Volume Share (%), by Country 2025 & 2033
List of Tables
- Table 1: Global Augmented Shopping Market Revenue Million Forecast, by Component 2020 & 2033
- Table 2: Global Augmented Shopping Market Volume Billion Forecast, by Component 2020 & 2033
- Table 3: Global Augmented Shopping Market Revenue Million Forecast, by Application 2020 & 2033
- Table 4: Global Augmented Shopping Market Volume Billion Forecast, by Application 2020 & 2033
- Table 5: Global Augmented Shopping Market Revenue Million Forecast, by Region 2020 & 2033
- Table 6: Global Augmented Shopping Market Volume Billion Forecast, by Region 2020 & 2033
- Table 7: Global Augmented Shopping Market Revenue Million Forecast, by Component 2020 & 2033
- Table 8: Global Augmented Shopping Market Volume Billion Forecast, by Component 2020 & 2033
- Table 9: Global Augmented Shopping Market Revenue Million Forecast, by Application 2020 & 2033
- Table 10: Global Augmented Shopping Market Volume Billion Forecast, by Application 2020 & 2033
- Table 11: Global Augmented Shopping Market Revenue Million Forecast, by Country 2020 & 2033
- Table 12: Global Augmented Shopping Market Volume Billion Forecast, by Country 2020 & 2033
- Table 13: United States Augmented Shopping Market Revenue (Million) Forecast, by Application 2020 & 2033
- Table 14: United States Augmented Shopping Market Volume (Billion) Forecast, by Application 2020 & 2033
- Table 15: Canada Augmented Shopping Market Revenue (Million) Forecast, by Application 2020 & 2033
- Table 16: Canada Augmented Shopping Market Volume (Billion) Forecast, by Application 2020 & 2033
- Table 17: Rest of North America Augmented Shopping Market Revenue (Million) Forecast, by Application 2020 & 2033
- Table 18: Rest of North America Augmented Shopping Market Volume (Billion) Forecast, by Application 2020 & 2033
- Table 19: Global Augmented Shopping Market Revenue Million Forecast, by Component 2020 & 2033
- Table 20: Global Augmented Shopping Market Volume Billion Forecast, by Component 2020 & 2033
- Table 21: Global Augmented Shopping Market Revenue Million Forecast, by Application 2020 & 2033
- Table 22: Global Augmented Shopping Market Volume Billion Forecast, by Application 2020 & 2033
- Table 23: Global Augmented Shopping Market Revenue Million Forecast, by Country 2020 & 2033
- Table 24: Global Augmented Shopping Market Volume Billion Forecast, by Country 2020 & 2033
- Table 25: Germany Augmented Shopping Market Revenue (Million) Forecast, by Application 2020 & 2033
- Table 26: Germany Augmented Shopping Market Volume (Billion) Forecast, by Application 2020 & 2033
- Table 27: United Kingdom Augmented Shopping Market Revenue (Million) Forecast, by Application 2020 & 2033
- Table 28: United Kingdom Augmented Shopping Market Volume (Billion) Forecast, by Application 2020 & 2033
- Table 29: France Augmented Shopping Market Revenue (Million) Forecast, by Application 2020 & 2033
- Table 30: France Augmented Shopping Market Volume (Billion) Forecast, by Application 2020 & 2033
- Table 31: Russia Augmented Shopping Market Revenue (Million) Forecast, by Application 2020 & 2033
- Table 32: Russia Augmented Shopping Market Volume (Billion) Forecast, by Application 2020 & 2033
- Table 33: Spain Augmented Shopping Market Revenue (Million) Forecast, by Application 2020 & 2033
- Table 34: Spain Augmented Shopping Market Volume (Billion) Forecast, by Application 2020 & 2033
- Table 35: Rest of Europe Augmented Shopping Market Revenue (Million) Forecast, by Application 2020 & 2033
- Table 36: Rest of Europe Augmented Shopping Market Volume (Billion) Forecast, by Application 2020 & 2033
- Table 37: Global Augmented Shopping Market Revenue Million Forecast, by Component 2020 & 2033
- Table 38: Global Augmented Shopping Market Volume Billion Forecast, by Component 2020 & 2033
- Table 39: Global Augmented Shopping Market Revenue Million Forecast, by Application 2020 & 2033
- Table 40: Global Augmented Shopping Market Volume Billion Forecast, by Application 2020 & 2033
- Table 41: Global Augmented Shopping Market Revenue Million Forecast, by Country 2020 & 2033
- Table 42: Global Augmented Shopping Market Volume Billion Forecast, by Country 2020 & 2033
- Table 43: India Augmented Shopping Market Revenue (Million) Forecast, by Application 2020 & 2033
- Table 44: India Augmented Shopping Market Volume (Billion) Forecast, by Application 2020 & 2033
- Table 45: China Augmented Shopping Market Revenue (Million) Forecast, by Application 2020 & 2033
- Table 46: China Augmented Shopping Market Volume (Billion) Forecast, by Application 2020 & 2033
- Table 47: Japan Augmented Shopping Market Revenue (Million) Forecast, by Application 2020 & 2033
- Table 48: Japan Augmented Shopping Market Volume (Billion) Forecast, by Application 2020 & 2033
- Table 49: Rest of Asia Pacific Augmented Shopping Market Revenue (Million) Forecast, by Application 2020 & 2033
- Table 50: Rest of Asia Pacific Augmented Shopping Market Volume (Billion) Forecast, by Application 2020 & 2033
- Table 51: Global Augmented Shopping Market Revenue Million Forecast, by Component 2020 & 2033
- Table 52: Global Augmented Shopping Market Volume Billion Forecast, by Component 2020 & 2033
- Table 53: Global Augmented Shopping Market Revenue Million Forecast, by Application 2020 & 2033
- Table 54: Global Augmented Shopping Market Volume Billion Forecast, by Application 2020 & 2033
- Table 55: Global Augmented Shopping Market Revenue Million Forecast, by Country 2020 & 2033
- Table 56: Global Augmented Shopping Market Volume Billion Forecast, by Country 2020 & 2033
- Table 57: Brazil Augmented Shopping Market Revenue (Million) Forecast, by Application 2020 & 2033
- Table 58: Brazil Augmented Shopping Market Volume (Billion) Forecast, by Application 2020 & 2033
- Table 59: Argentina Augmented Shopping Market Revenue (Million) Forecast, by Application 2020 & 2033
- Table 60: Argentina Augmented Shopping Market Volume (Billion) Forecast, by Application 2020 & 2033
- Table 61: Rest of South America Augmented Shopping Market Revenue (Million) Forecast, by Application 2020 & 2033
- Table 62: Rest of South America Augmented Shopping Market Volume (Billion) Forecast, by Application 2020 & 2033
- Table 63: Global Augmented Shopping Market Revenue Million Forecast, by Component 2020 & 2033
- Table 64: Global Augmented Shopping Market Volume Billion Forecast, by Component 2020 & 2033
- Table 65: Global Augmented Shopping Market Revenue Million Forecast, by Application 2020 & 2033
- Table 66: Global Augmented Shopping Market Volume Billion Forecast, by Application 2020 & 2033
- Table 67: Global Augmented Shopping Market Revenue Million Forecast, by Country 2020 & 2033
- Table 68: Global Augmented Shopping Market Volume Billion Forecast, by Country 2020 & 2033
- Table 69: United Arab Emirates Augmented Shopping Market Revenue (Million) Forecast, by Application 2020 & 2033
- Table 70: United Arab Emirates Augmented Shopping Market Volume (Billion) Forecast, by Application 2020 & 2033
- Table 71: Saudi Arabia Augmented Shopping Market Revenue (Million) Forecast, by Application 2020 & 2033
- Table 72: Saudi Arabia Augmented Shopping Market Volume (Billion) Forecast, by Application 2020 & 2033
- Table 73: Rest of Middle East Augmented Shopping Market Revenue (Million) Forecast, by Application 2020 & 2033
- Table 74: Rest of Middle East Augmented Shopping Market Volume (Billion) Forecast, by Application 2020 & 2033
Frequently Asked Questions
1. What is the projected Compound Annual Growth Rate (CAGR) of the Augmented Shopping Market?
The projected CAGR is approximately 15.78%.
2. Which companies are prominent players in the Augmented Shopping Market?
Key companies in the market include Magic Leap, Blippar, Groove Jones, IKEA Place, ModiFace, Obsess, HoloLens, Zugara Inc, PTC Vuforia, Apple Inc **List Not Exhaustive.
3. What are the main segments of the Augmented Shopping Market?
The market segments include Component , Application.
4. Can you provide details about the market size?
The market size is estimated to be USD 15.52 Million as of 2022.
5. What are some drivers contributing to market growth?
The Growing Number of Smartphone and Tablets is Driving the Market; Technological Advancements is Driving the Market.
6. What are the notable trends driving market growth?
Growing Demand for Furniture and Lighting in Asia-Pacific.
7. Are there any restraints impacting market growth?
The Growing Number of Smartphone and Tablets is Driving the Market; Technological Advancements is Driving the Market.
8. Can you provide examples of recent developments in the market?
May 2024: Alphabet Inc.'s Google and the augmented reality startup Magic Leap Inc. revealed a strategic partnership. The collaboration aims to focus on developing augmented reality (AR) and optical solutions.August 2023: In collaboration with Dufry, Blackjack Promotions, a UK travel retail and brand experience provider, introduced its first immersive augmented reality campaign targeted at families.
9. What pricing options are available for accessing the report?
Pricing options include single-user, multi-user, and enterprise licenses priced at USD 4750, USD 5250, and USD 8750 respectively.
10. Is the market size provided in terms of value or volume?
The market size is provided in terms of value, measured in Million and volume, measured in Billion.
11. Are there any specific market keywords associated with the report?
Yes, the market keyword associated with the report is "Augmented Shopping Market," which aids in identifying and referencing the specific market segment covered.
12. How do I determine which pricing option suits my needs best?
The pricing options vary based on user requirements and access needs. Individual users may opt for single-user licenses, while businesses requiring broader access may choose multi-user or enterprise licenses for cost-effective access to the report.
13. Are there any additional resources or data provided in the Augmented Shopping Market report?
While the report offers comprehensive insights, it's advisable to review the specific contents or supplementary materials provided to ascertain if additional resources or data are available.
14. How can I stay updated on further developments or reports in the Augmented Shopping Market?
To stay informed about further developments, trends, and reports in the Augmented Shopping Market, consider subscribing to industry newsletters, following relevant companies and organizations, or regularly checking reputable industry news sources and publications.
Methodology
Step 1 - Identification of Relevant Samples Size from Population Database


Step 2 - Approaches for Defining Global Market Size (Value, Volume* & Price*)

Note*: In applicable scenarios
Step 3 - Data Sources
Primary Research
- Web Analytics
- Survey Reports
- Research Institute
- Latest Research Reports
- Opinion Leaders
Secondary Research
- Annual Reports
- White Paper
- Latest Press Release
- Industry Association
- Paid Database
- Investor Presentations

Step 4 - Data Triangulation
Involves using different sources of information in order to increase the validity of a study
These sources are likely to be stakeholders in a program - participants, other researchers, program staff, other community members, and so on.
Then we put all data in single framework & apply various statistical tools to find out the dynamic on the market.
During the analysis stage, feedback from the stakeholder groups would be compared to determine areas of agreement as well as areas of divergence