

Key Insights
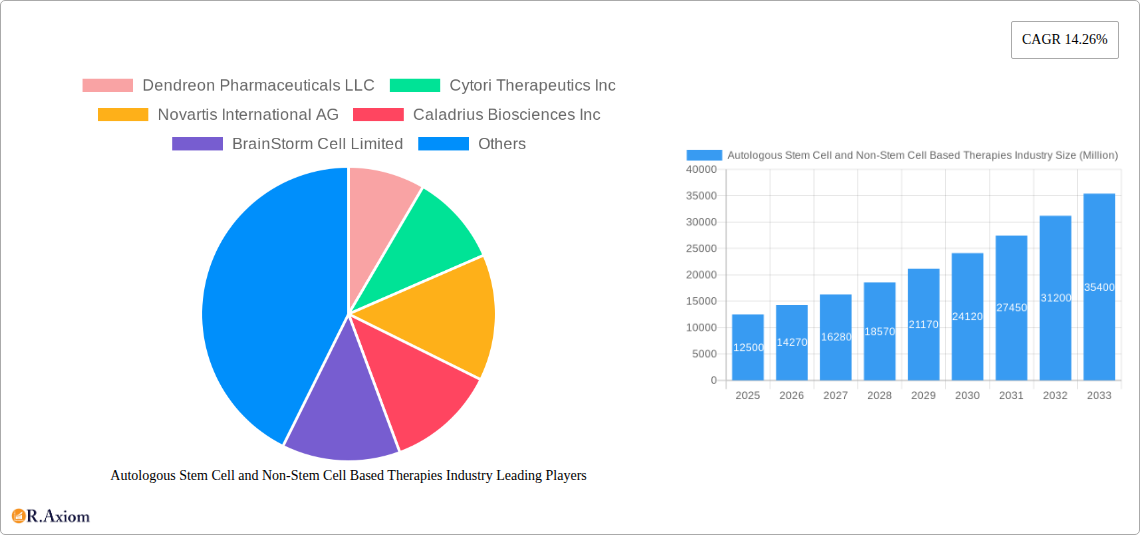
The Autologous Stem Cell and Non-Stem Cell Based Therapies market is projected for significant expansion, expected to reach USD 6.45 billion by 2025, with a compelling Compound Annual Growth Rate (CAGR) of 14.89%. This robust growth is driven by the rising incidence of chronic diseases, including cancer, neurodegenerative disorders, and cardiovascular conditions, where these advanced therapies offer innovative and superior treatment options. Advancements in regenerative medicine, increased adoption of cell-based treatments by healthcare professionals and patients, and the inherent safety and efficacy of autologous therapies (utilizing the patient's own cells) are key market accelerators. Growing R&D investments from leading pharmaceutical and biotechnology firms, supported by favorable regulatory environments, further contribute to market momentum.
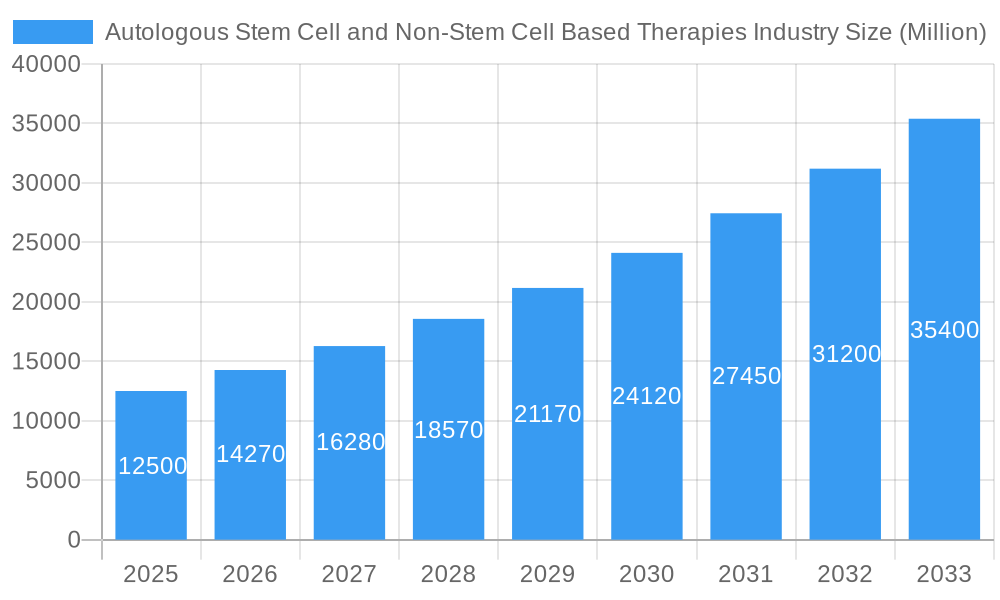
Autologous Stem Cell and Non-Stem Cell Based Therapies Industry Market Size (In Billion)
The market is segmented by cell type into Autologous Stem Cells and Autologous Non-Stem Cells. By application, Cancer therapies currently lead, followed by Neurodegenerative Disorders and Cardiovascular Diseases, with Orthopedic Diseases and Other Applications also showing promise. Hospitals and Research Facilities are the primary end-users, with Ambulatory Surgical Centers emerging as a critical delivery channel. Geographically, North America is anticipated to lead due to its advanced healthcare infrastructure and substantial R&D, while Europe and Asia Pacific will exhibit strong growth driven by increasing healthcare spending and patient populations. Key players such as Dendreon Pharmaceuticals, Novartis, and Caladrius Biosciences are actively investing in pipeline development and commercialization.
Autologous Stem Cell and Non-Stem Cell Based Therapies Industry Company Market Share
This report provides a comprehensive analysis of the Autologous Stem Cell and Non-Stem Cell Based Therapies market, detailing market size, CAGR, penetration, and competitive landscape from 2019–2033. It covers crucial segments including Autologous Stem Cells and Non-Stem cells, applications (Cancer, Neurodegenerative Disorders, Cardiovascular Disease, Orthopedic Diseases, and Others), and end-users (Hospitals, Ambulatory Surgical Centers, and Research Facilities). With a base year of 2025 and a forecast period of 2025–2033, this research offers actionable insights for industry stakeholders.
Autologous Stem Cell and Non-Stem Cell Based Therapies Industry Market Concentration & Innovation
The Autologous Stem Cell and Non-Stem Cell Based Therapies market exhibits a moderate to high concentration, with key players investing heavily in research and development to drive innovation. Regulatory frameworks, though evolving, are crucial in shaping market entry and product approvals, with organizations like the US FDA playing a pivotal role. Product substitutes, while limited in the regenerative medicine space, are emerging through advanced biomaterials and alternative cell sources. End-user trends are shifting towards personalized medicine and minimally invasive treatment options, compelling providers to adapt their offerings. Mergers and acquisitions (M&A) are a significant driver of market consolidation and pipeline expansion. For instance, Metcela's acquisition of Japan Regenerative Medicine Co. Ltd in April 2022 for an undisclosed sum aimed at bolstering its cardiac stem cell therapy pipeline. Similarly, the US FDA approval of CARVYKTI (ciltacabtagene autoleucel; cilta-cel) in February 2022 by Gilead Sciences Inc, a groundbreaking autologous T-cell immunotherapy for relapsed or refractory multiple myeloma, underscores the intense innovation and strategic M&A activity shaping this dynamic sector. Projected M&A deal values are expected to reach multi-million dollar figures as companies seek to acquire cutting-edge technologies and expand their therapeutic portfolios.
Autologous Stem Cell and Non-Stem Cell Based Therapies Industry Industry Trends & Insights
The Autologous Stem Cell and Non-Stem Cell Based Therapies industry is experiencing robust growth, propelled by a confluence of escalating demand for personalized medicine, advancements in cellular engineering, and a growing understanding of disease mechanisms at the cellular level. The market penetration of these advanced therapies is steadily increasing as clinical trial data matures and regulatory pathways become more defined. A significant growth driver is the rising prevalence of chronic diseases such as cancer, cardiovascular conditions, and neurodegenerative disorders, where autologous therapies offer novel treatment avenues with potentially superior efficacy and reduced side effects compared to traditional interventions. Technological disruptions, including gene editing techniques like CRISPR-Cas9 and advancements in stem cell culturing and differentiation, are continuously expanding the therapeutic potential of these treatments. Consumer preferences are increasingly leaning towards therapies that offer hope for conditions previously deemed untreatable, fostering a strong demand for innovative solutions. Competitive dynamics are characterized by a mix of established pharmaceutical giants and agile biotech startups, all vying for market share through strategic partnerships, intellectual property development, and clinical pipeline advancement. The projected Compound Annual Growth Rate (CAGR) for this market is estimated to be in the range of 15-20% over the forecast period, driven by an expanding range of approved therapies and a growing pipeline of investigational products. For example, the increasing success in CAR T-cell therapies for hematological malignancies is paving the way for similar approaches in solid tumors, further expanding the market's reach. The market is also witnessing a trend towards ex vivo gene modification and cell expansion, allowing for more potent and targeted therapeutic interventions. The development of off-the-shelf allogeneic therapies, while distinct, also influences the competitive landscape by offering alternative solutions for certain indications, pushing autologous therapy developers to further refine their platforms for enhanced efficacy and patient convenience.
Dominant Markets & Segments in Autologous Stem Cell and Non-Stem Cell Based Therapies Industry
The Autologous Stem Cell and Non-Stem Cell Based Therapies market is characterized by a strong dominance in certain geographical regions and specific application segments.
Leading Region: North America, particularly the United States, currently leads the global market. This dominance is attributable to several factors:
- Robust R&D Infrastructure: Significant investment in biotechnology and pharmaceutical research, coupled with a strong network of academic institutions and research facilities.
- Favorable Regulatory Environment: The US Food and Drug Administration (FDA) has established pathways for the approval of cell and gene therapies, albeit rigorous, encouraging innovation.
- High Healthcare Expenditure: Substantial healthcare spending allows for greater adoption of advanced and often expensive therapies.
- Early Adoption of Advanced Therapies: A patient population and healthcare system that are generally more receptive to novel treatment modalities.
Dominant Segment - Type: Autologous Stem Cells currently hold a larger market share.
- Key Drivers: The well-established understanding and therapeutic success of hematopoietic stem cell transplantation (HSCT) for hematological malignancies have laid a strong foundation. Continuous research into mesenchymal stem cells (MSCs) and induced pluripotent stem cells (iPSCs) for various regenerative applications is further fueling growth. The precise targeting and personalized nature of autologous stem cells are key advantages.
Dominant Segment - Application: Cancer treatment remains the leading application.
- Key Drivers: The remarkable success of CAR T-cell therapies in treating various blood cancers has been a major catalyst. The high unmet need in oncology, coupled with the potential for long-lasting remission, drives substantial investment and clinical development in this area.
- Emerging Applications: While cancer dominates, significant growth is anticipated in Neurodegenerative Disorders (e.g., Parkinson's, Alzheimer's), Cardiovascular Disease (e.g., myocardial infarction), and Orthopedic Diseases (e.g., osteoarthritis), with ongoing clinical trials showing promising results.
Dominant End User: Hospitals are the primary end users.
- Key Drivers: Hospitals possess the necessary infrastructure, specialized medical personnel, and regulatory compliance capabilities to administer complex cell and gene therapies. The inpatient and outpatient services provided by hospitals are crucial for patient management throughout the treatment cycle. Ambulatory Surgical Centers are emerging as significant players for specific procedures, and Research Facilities are instrumental in driving future innovation.
The market concentration within these segments is influenced by factors such as the availability of specialized manufacturing facilities, reimbursement policies, and the clinical efficacy demonstrated in large-scale trials. Economic policies promoting life sciences research and development, coupled with strong intellectual property protection, also contribute to the dominance of specific regions and companies.
Autologous Stem Cell and Non-Stem Cell Based Therapies Industry Product Developments
Product developments in the Autologous Stem Cell and Non-Stem Cell Based Therapies industry are characterized by a relentless pursuit of enhanced efficacy, safety, and broader applicability. Innovations include advanced methods for cell isolation, genetic modification, and ex vivo expansion, leading to more potent therapeutic agents. For instance, advancements in CAR T-cell technology are focusing on overcoming tumor heterogeneity and resistance mechanisms, thereby expanding the range of cancers treatable. Similarly, progress in stem cell differentiation protocols is enabling the generation of specific cell types for treating conditions like Parkinson's disease and spinal cord injuries. The competitive advantage of these products lies in their personalized nature, potentially reducing immunogenicity and improving patient outcomes. The focus is also shifting towards developing therapies for solid tumors and less common genetic disorders, reflecting a dynamic and rapidly evolving market landscape driven by technological breakthroughs and unmet clinical needs.
Report Scope & Segmentation Analysis
This report meticulously segments the Autologous Stem Cell and Non-Stem Cell Based Therapies market across several key dimensions to provide granular insights. The Type segmentation includes Autologous Stem Cells, encompassing therapies derived from a patient's own stem cells like hematopoietic and mesenchymal stem cells, and Autologous Non-Stem cells, which involve utilizing a patient's differentiated cells, such as T-cells for CAR T-cell therapies. The Application segmentation covers critical disease areas: Cancer, where therapies are primarily used for hematological malignancies and increasingly for solid tumors; Neurodegenerative Disorders, addressing conditions like Parkinson's and Alzheimer's; Cardiovascular Disease, focusing on repairing damaged heart tissue; Orthopedic Diseases, for cartilage regeneration and bone repair; and Other Applications, including wound healing and autoimmune disorders. The End User segmentation analyzes adoption by Hospitals, the primary treatment centers; Ambulatory Surgical Centers, for specific outpatient procedures; and Research Facilities, driving future innovation. Each segment is analyzed for its projected market size and growth dynamics, with a keen eye on competitive landscapes and evolving market penetration.
Key Drivers of Autologous Stem Cell and Non-Stem Cell Based Therapies Industry Growth
The Autologous Stem Cell and Non-Stem Cell Based Therapies industry is propelled by several synergistic growth drivers. A fundamental driver is the escalating global burden of chronic and degenerative diseases, creating a substantial unmet medical need that these advanced therapies are uniquely positioned to address. Technological advancements in cell biology, genetic engineering (e.g., CRISPR), and bioprocessing are continuously enhancing the efficacy, safety, and scalability of autologous therapies. Furthermore, increasing regulatory support and streamlined approval pathways for regenerative medicine products in key markets, such as those facilitated by the FDA, are crucial. Significant investments from venture capital and government grants, alongside strategic collaborations between research institutions and commercial entities, are fueling the innovation pipeline.
Challenges in the Autologous Stem Cell and Non-Stem Cell Based Therapies Industry Sector
Despite immense promise, the Autologous Stem Cell and Non-Stem Cell Based Therapies sector faces significant challenges. High manufacturing costs associated with personalized cell therapy production remain a major barrier to widespread adoption, often resulting in substantial patient treatment expenses. Complex regulatory hurdles and the need for extensive clinical validation, especially for novel applications, can lead to prolonged development timelines. Supply chain logistics for autologous products, requiring precise handling and timely delivery of patient-specific cells, present operational complexities. Moreover, reimbursement policies by payers can be inconsistent, impacting the financial viability of these therapies. Intense competition from alternative treatment modalities and the potential for unforeseen adverse events also pose ongoing challenges.
Emerging Opportunities in Autologous Stem Cell and Non-Stem Cell Based Therapies Industry
The Autologous Stem Cell and Non-Stem Cell Based Therapies market is ripe with emerging opportunities. Expansion into new therapeutic areas, particularly for solid tumors and chronic, debilitating diseases like Alzheimer's and advanced cardiovascular conditions, represents a significant growth frontier. Advancements in gene editing and synthetic biology are enabling the development of more sophisticated and targeted cellular therapies, such as off-the-shelf allogeneic products that could overcome the limitations of autologous manufacturing. Geographic expansion into emerging markets in Asia-Pacific and Latin America, where the prevalence of certain diseases is high and healthcare infrastructure is developing, presents substantial untapped potential. The development of standardized manufacturing processes and improved cost-effectiveness models will further democratize access to these life-changing treatments.
Leading Players in the Autologous Stem Cell and Non-Stem Cell Based Therapies Industry Market
- Dendreon Pharmaceuticals LLC
- Cytori Therapeutics Inc
- Novartis International AG
- Caladrius Biosciences Inc
- BrainStorm Cell Limited
- Vericel Corp
- Gilead Sciences Inc
- Castle Creek Biosciences Inc
- US Stem Cell Inc
- Holostem Terapie Avanzate Srl
Key Developments in Autologous Stem Cell and Non-Stem Cell Based Therapies Industry Industry
- April 2022: Metcela acquired Japan Regenerative Medicine Co. Ltd to develop cardiac stem cell-based therapy. Through the acquisition, Metcela will add an autologous cell product for pediatric congenital heart disease to its pipeline and significantly strengthen its clinical development infrastructure for regenerative medicine products.
- February 2022: The US FDA approved CARVYKTI (ciltacabtagene autoleucel; cilta-cel) for the treatment of adults with relapsed or refractory multiple myeloma (RRMM) after four or more prior lines of therapy. CARVYKTI is a B-cell maturation antigen-directed, genetically modified autologous T-cell immunotherapy.
Strategic Outlook for Autologous Stem Cell and Non-Stem Cell Based Therapies Industry Market
The strategic outlook for the Autologous Stem Cell and Non-Stem Cell Based Therapies market is exceptionally bright, characterized by continuous innovation and expanding therapeutic applications. Growth catalysts include the ongoing validation of existing therapies in larger patient populations and the progression of numerous promising candidates through clinical trials for previously untreatable conditions. Strategic partnerships between academia, biotechs, and large pharmaceutical companies will accelerate product development and market penetration. Furthermore, advancements in manufacturing technologies are expected to reduce costs and improve accessibility. The increasing focus on precision medicine and personalized treatment approaches will further solidify the demand for autologous therapies. Future growth will also be driven by the successful translation of laboratory discoveries into commercially viable products, addressing a wider spectrum of diseases and significantly improving patient quality of life.
Autologous Stem Cell and Non-Stem Cell Based Therapies Industry Segmentation
-
1. Type
- 1.1. Autologous Stem Cells
- 1.2. Autologous Non-Stem cells
-
2. Application
- 2.1. Cancer
- 2.2. Neurodegenerative Disorders
- 2.3. Cardiovascular Disease
- 2.4. Orthopedic Diseases
- 2.5. Other Applications
-
3. End User
- 3.1. Hospitals
- 3.2. Ambulatory Surgical Centers
- 3.3. Research Facilities
Autologous Stem Cell and Non-Stem Cell Based Therapies Industry Segmentation By Geography
-
1. North America
- 1.1. United States
- 1.2. Canada
- 1.3. Mexico
-
2. Europe
- 2.1. Germany
- 2.2. United Kingdom
- 2.3. France
- 2.4. Italy
- 2.5. Spain
- 2.6. Rest of Europe
-
3. Asia Pacific
- 3.1. China
- 3.2. Japan
- 3.3. India
- 3.4. Australia
- 3.5. South Korea
- 3.6. Rest of Asia Pacific
-
4. Middle East and Africa
- 4.1. GCC
- 4.2. South Africa
- 4.3. Rest of Middle East and Africa
-
5. South America
- 5.1. Brazil
- 5.2. Argentina
- 5.3. Rest of South America
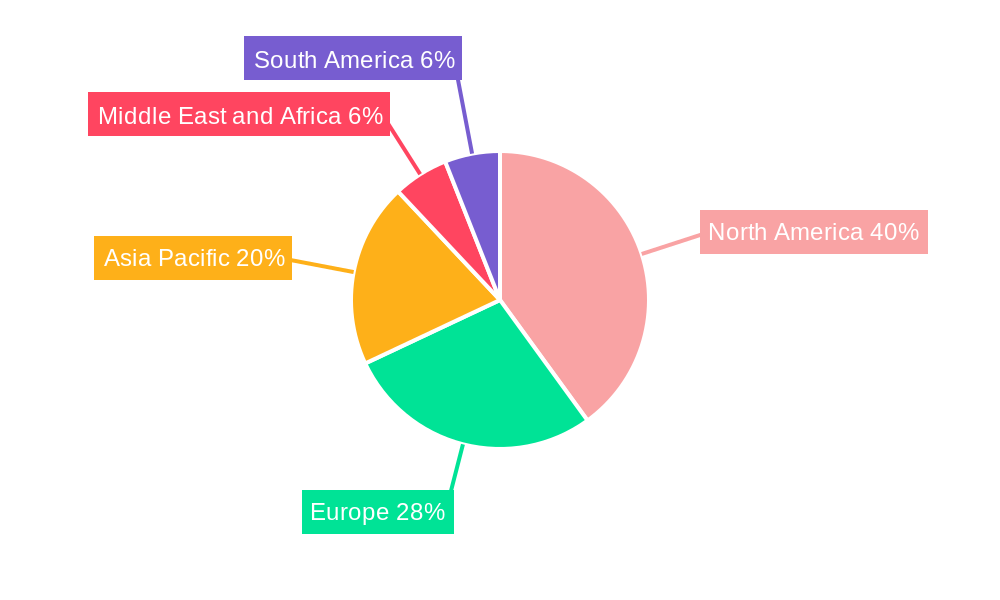
Autologous Stem Cell and Non-Stem Cell Based Therapies Industry Regional Market Share
Geographic Coverage of Autologous Stem Cell and Non-Stem Cell Based Therapies Industry
Autologous Stem Cell and Non-Stem Cell Based Therapies Industry REPORT HIGHLIGHTS
| Aspects | Details |
|---|---|
| Study Period | 2020-2034 |
| Base Year | 2025 |
| Estimated Year | 2026 |
| Forecast Period | 2026-2034 |
| Historical Period | 2020-2025 |
| Growth Rate | CAGR of 14.89% from 2020-2034 |
| Segmentation |
|
Table of Contents
- 1. Introduction
- 1.1. Research Scope
- 1.2. Market Segmentation
- 1.3. Research Objective
- 1.4. Definitions and Assumptions
- 2. Executive Summary
- 2.1. Market Snapshot
- 3. Market Dynamics
- 3.1. Market Drivers
- 3.2. Market Restrains
- 3.3. Market Trends
- 3.4. Market Opportunities
- 4. Market Factor Analysis
- 4.1. Porters Five Forces
- 4.1.1. Bargaining Power of Suppliers
- 4.1.2. Bargaining Power of Buyers
- 4.1.3. Threat of New Entrants
- 4.1.4. Threat of Substitutes
- 4.1.5. Competitive Rivalry
- 4.2. PESTEL analysis
- 4.3. BCG Analysis
- 4.3.1. Stars (High Growth, High Market Share)
- 4.3.2. Cash Cows (Low Growth, High Market Share)
- 4.3.3. Question Mark (High Growth, Low Market Share)
- 4.3.4. Dogs (Low Growth, Low Market Share)
- 4.4. Ansoff Matrix Analysis
- 4.5. Supply Chain Analysis
- 4.6. Regulatory Landscape
- 4.7. Current Market Potential and Opportunity Assessment (TAM–SAM–SOM Framework)
- 4.8. RAX Analyst Note
- 4.1. Porters Five Forces
- 5. Market Analysis, Insights and Forecast 2021-2033
- 5.1. Market Analysis, Insights and Forecast - by Type
- 5.1.1. Autologous Stem Cells
- 5.1.2. Autologous Non-Stem cells
- 5.2. Market Analysis, Insights and Forecast - by Application
- 5.2.1. Cancer
- 5.2.2. Neurodegenerative Disorders
- 5.2.3. Cardiovascular Disease
- 5.2.4. Orthopedic Diseases
- 5.2.5. Other Applications
- 5.3. Market Analysis, Insights and Forecast - by End User
- 5.3.1. Hospitals
- 5.3.2. Ambulatory Surgical Centers
- 5.3.3. Research Facilities
- 5.4. Market Analysis, Insights and Forecast - by Region
- 5.4.1. North America
- 5.4.2. Europe
- 5.4.3. Asia Pacific
- 5.4.4. Middle East and Africa
- 5.4.5. South America
- 5.1. Market Analysis, Insights and Forecast - by Type
- 6. Global Autologous Stem Cell and Non-Stem Cell Based Therapies Industry Analysis, Insights and Forecast, 2021-2033
- 6.1. Market Analysis, Insights and Forecast - by Type
- 6.1.1. Autologous Stem Cells
- 6.1.2. Autologous Non-Stem cells
- 6.2. Market Analysis, Insights and Forecast - by Application
- 6.2.1. Cancer
- 6.2.2. Neurodegenerative Disorders
- 6.2.3. Cardiovascular Disease
- 6.2.4. Orthopedic Diseases
- 6.2.5. Other Applications
- 6.3. Market Analysis, Insights and Forecast - by End User
- 6.3.1. Hospitals
- 6.3.2. Ambulatory Surgical Centers
- 6.3.3. Research Facilities
- 6.1. Market Analysis, Insights and Forecast - by Type
- 7. North America Autologous Stem Cell and Non-Stem Cell Based Therapies Industry Analysis, Insights and Forecast, 2020-2032
- 7.1. Market Analysis, Insights and Forecast - by Type
- 7.1.1. Autologous Stem Cells
- 7.1.2. Autologous Non-Stem cells
- 7.2. Market Analysis, Insights and Forecast - by Application
- 7.2.1. Cancer
- 7.2.2. Neurodegenerative Disorders
- 7.2.3. Cardiovascular Disease
- 7.2.4. Orthopedic Diseases
- 7.2.5. Other Applications
- 7.3. Market Analysis, Insights and Forecast - by End User
- 7.3.1. Hospitals
- 7.3.2. Ambulatory Surgical Centers
- 7.3.3. Research Facilities
- 7.1. Market Analysis, Insights and Forecast - by Type
- 8. Europe Autologous Stem Cell and Non-Stem Cell Based Therapies Industry Analysis, Insights and Forecast, 2020-2032
- 8.1. Market Analysis, Insights and Forecast - by Type
- 8.1.1. Autologous Stem Cells
- 8.1.2. Autologous Non-Stem cells
- 8.2. Market Analysis, Insights and Forecast - by Application
- 8.2.1. Cancer
- 8.2.2. Neurodegenerative Disorders
- 8.2.3. Cardiovascular Disease
- 8.2.4. Orthopedic Diseases
- 8.2.5. Other Applications
- 8.3. Market Analysis, Insights and Forecast - by End User
- 8.3.1. Hospitals
- 8.3.2. Ambulatory Surgical Centers
- 8.3.3. Research Facilities
- 8.1. Market Analysis, Insights and Forecast - by Type
- 9. Asia Pacific Autologous Stem Cell and Non-Stem Cell Based Therapies Industry Analysis, Insights and Forecast, 2020-2032
- 9.1. Market Analysis, Insights and Forecast - by Type
- 9.1.1. Autologous Stem Cells
- 9.1.2. Autologous Non-Stem cells
- 9.2. Market Analysis, Insights and Forecast - by Application
- 9.2.1. Cancer
- 9.2.2. Neurodegenerative Disorders
- 9.2.3. Cardiovascular Disease
- 9.2.4. Orthopedic Diseases
- 9.2.5. Other Applications
- 9.3. Market Analysis, Insights and Forecast - by End User
- 9.3.1. Hospitals
- 9.3.2. Ambulatory Surgical Centers
- 9.3.3. Research Facilities
- 9.1. Market Analysis, Insights and Forecast - by Type
- 10. Middle East and Africa Autologous Stem Cell and Non-Stem Cell Based Therapies Industry Analysis, Insights and Forecast, 2020-2032
- 10.1. Market Analysis, Insights and Forecast - by Type
- 10.1.1. Autologous Stem Cells
- 10.1.2. Autologous Non-Stem cells
- 10.2. Market Analysis, Insights and Forecast - by Application
- 10.2.1. Cancer
- 10.2.2. Neurodegenerative Disorders
- 10.2.3. Cardiovascular Disease
- 10.2.4. Orthopedic Diseases
- 10.2.5. Other Applications
- 10.3. Market Analysis, Insights and Forecast - by End User
- 10.3.1. Hospitals
- 10.3.2. Ambulatory Surgical Centers
- 10.3.3. Research Facilities
- 10.1. Market Analysis, Insights and Forecast - by Type
- 11. South America Autologous Stem Cell and Non-Stem Cell Based Therapies Industry Analysis, Insights and Forecast, 2020-2032
- 11.1. Market Analysis, Insights and Forecast - by Type
- 11.1.1. Autologous Stem Cells
- 11.1.2. Autologous Non-Stem cells
- 11.2. Market Analysis, Insights and Forecast - by Application
- 11.2.1. Cancer
- 11.2.2. Neurodegenerative Disorders
- 11.2.3. Cardiovascular Disease
- 11.2.4. Orthopedic Diseases
- 11.2.5. Other Applications
- 11.3. Market Analysis, Insights and Forecast - by End User
- 11.3.1. Hospitals
- 11.3.2. Ambulatory Surgical Centers
- 11.3.3. Research Facilities
- 11.1. Market Analysis, Insights and Forecast - by Type
- 12. Competitive Analysis
- 12.1. Company Profiles
- 12.1.1 Dendreon Pharmaceuticals LLC
- 12.1.1.1. Company Overview
- 12.1.1.2. Products
- 12.1.1.3. Company Financials
- 12.1.1.4. SWOT Analysis
- 12.1.2 Cytori Therapeutics Inc
- 12.1.2.1. Company Overview
- 12.1.2.2. Products
- 12.1.2.3. Company Financials
- 12.1.2.4. SWOT Analysis
- 12.1.3 Novartis International AG
- 12.1.3.1. Company Overview
- 12.1.3.2. Products
- 12.1.3.3. Company Financials
- 12.1.3.4. SWOT Analysis
- 12.1.4 Caladrius Biosciences Inc
- 12.1.4.1. Company Overview
- 12.1.4.2. Products
- 12.1.4.3. Company Financials
- 12.1.4.4. SWOT Analysis
- 12.1.5 BrainStorm Cell Limited
- 12.1.5.1. Company Overview
- 12.1.5.2. Products
- 12.1.5.3. Company Financials
- 12.1.5.4. SWOT Analysis
- 12.1.6 Vericel Corp
- 12.1.6.1. Company Overview
- 12.1.6.2. Products
- 12.1.6.3. Company Financials
- 12.1.6.4. SWOT Analysis
- 12.1.7 Gilead Sciences Inc
- 12.1.7.1. Company Overview
- 12.1.7.2. Products
- 12.1.7.3. Company Financials
- 12.1.7.4. SWOT Analysis
- 12.1.8 Castle Creek Biosciences Inc
- 12.1.8.1. Company Overview
- 12.1.8.2. Products
- 12.1.8.3. Company Financials
- 12.1.8.4. SWOT Analysis
- 12.1.9 US Stem Cell Inc
- 12.1.9.1. Company Overview
- 12.1.9.2. Products
- 12.1.9.3. Company Financials
- 12.1.9.4. SWOT Analysis
- 12.1.10 Holostem Terapie Avanzate Srl
- 12.1.10.1. Company Overview
- 12.1.10.2. Products
- 12.1.10.3. Company Financials
- 12.1.10.4. SWOT Analysis
- 12.1.1 Dendreon Pharmaceuticals LLC
- 12.2. Market Entropy
- 12.2.1 Company's Key Areas Served
- 12.2.2 Recent Developments
- 12.3. Company Market Share Analysis 2025
- 12.3.1 Top 5 Companies Market Share Analysis
- 12.3.2 Top 3 Companies Market Share Analysis
- 12.4. List of Potential Customers
- 13. Research Methodology
List of Figures
- Figure 1: Global Autologous Stem Cell and Non-Stem Cell Based Therapies Industry Revenue Breakdown (billion, %) by Region 2025 & 2033
- Figure 2: Global Autologous Stem Cell and Non-Stem Cell Based Therapies Industry Volume Breakdown (K Unit, %) by Region 2025 & 2033
- Figure 3: North America Autologous Stem Cell and Non-Stem Cell Based Therapies Industry Revenue (billion), by Type 2025 & 2033
- Figure 4: North America Autologous Stem Cell and Non-Stem Cell Based Therapies Industry Volume (K Unit), by Type 2025 & 2033
- Figure 5: North America Autologous Stem Cell and Non-Stem Cell Based Therapies Industry Revenue Share (%), by Type 2025 & 2033
- Figure 6: North America Autologous Stem Cell and Non-Stem Cell Based Therapies Industry Volume Share (%), by Type 2025 & 2033
- Figure 7: North America Autologous Stem Cell and Non-Stem Cell Based Therapies Industry Revenue (billion), by Application 2025 & 2033
- Figure 8: North America Autologous Stem Cell and Non-Stem Cell Based Therapies Industry Volume (K Unit), by Application 2025 & 2033
- Figure 9: North America Autologous Stem Cell and Non-Stem Cell Based Therapies Industry Revenue Share (%), by Application 2025 & 2033
- Figure 10: North America Autologous Stem Cell and Non-Stem Cell Based Therapies Industry Volume Share (%), by Application 2025 & 2033
- Figure 11: North America Autologous Stem Cell and Non-Stem Cell Based Therapies Industry Revenue (billion), by End User 2025 & 2033
- Figure 12: North America Autologous Stem Cell and Non-Stem Cell Based Therapies Industry Volume (K Unit), by End User 2025 & 2033
- Figure 13: North America Autologous Stem Cell and Non-Stem Cell Based Therapies Industry Revenue Share (%), by End User 2025 & 2033
- Figure 14: North America Autologous Stem Cell and Non-Stem Cell Based Therapies Industry Volume Share (%), by End User 2025 & 2033
- Figure 15: North America Autologous Stem Cell and Non-Stem Cell Based Therapies Industry Revenue (billion), by Country 2025 & 2033
- Figure 16: North America Autologous Stem Cell and Non-Stem Cell Based Therapies Industry Volume (K Unit), by Country 2025 & 2033
- Figure 17: North America Autologous Stem Cell and Non-Stem Cell Based Therapies Industry Revenue Share (%), by Country 2025 & 2033
- Figure 18: North America Autologous Stem Cell and Non-Stem Cell Based Therapies Industry Volume Share (%), by Country 2025 & 2033
- Figure 19: Europe Autologous Stem Cell and Non-Stem Cell Based Therapies Industry Revenue (billion), by Type 2025 & 2033
- Figure 20: Europe Autologous Stem Cell and Non-Stem Cell Based Therapies Industry Volume (K Unit), by Type 2025 & 2033
- Figure 21: Europe Autologous Stem Cell and Non-Stem Cell Based Therapies Industry Revenue Share (%), by Type 2025 & 2033
- Figure 22: Europe Autologous Stem Cell and Non-Stem Cell Based Therapies Industry Volume Share (%), by Type 2025 & 2033
- Figure 23: Europe Autologous Stem Cell and Non-Stem Cell Based Therapies Industry Revenue (billion), by Application 2025 & 2033
- Figure 24: Europe Autologous Stem Cell and Non-Stem Cell Based Therapies Industry Volume (K Unit), by Application 2025 & 2033
- Figure 25: Europe Autologous Stem Cell and Non-Stem Cell Based Therapies Industry Revenue Share (%), by Application 2025 & 2033
- Figure 26: Europe Autologous Stem Cell and Non-Stem Cell Based Therapies Industry Volume Share (%), by Application 2025 & 2033
- Figure 27: Europe Autologous Stem Cell and Non-Stem Cell Based Therapies Industry Revenue (billion), by End User 2025 & 2033
- Figure 28: Europe Autologous Stem Cell and Non-Stem Cell Based Therapies Industry Volume (K Unit), by End User 2025 & 2033
- Figure 29: Europe Autologous Stem Cell and Non-Stem Cell Based Therapies Industry Revenue Share (%), by End User 2025 & 2033
- Figure 30: Europe Autologous Stem Cell and Non-Stem Cell Based Therapies Industry Volume Share (%), by End User 2025 & 2033
- Figure 31: Europe Autologous Stem Cell and Non-Stem Cell Based Therapies Industry Revenue (billion), by Country 2025 & 2033
- Figure 32: Europe Autologous Stem Cell and Non-Stem Cell Based Therapies Industry Volume (K Unit), by Country 2025 & 2033
- Figure 33: Europe Autologous Stem Cell and Non-Stem Cell Based Therapies Industry Revenue Share (%), by Country 2025 & 2033
- Figure 34: Europe Autologous Stem Cell and Non-Stem Cell Based Therapies Industry Volume Share (%), by Country 2025 & 2033
- Figure 35: Asia Pacific Autologous Stem Cell and Non-Stem Cell Based Therapies Industry Revenue (billion), by Type 2025 & 2033
- Figure 36: Asia Pacific Autologous Stem Cell and Non-Stem Cell Based Therapies Industry Volume (K Unit), by Type 2025 & 2033
- Figure 37: Asia Pacific Autologous Stem Cell and Non-Stem Cell Based Therapies Industry Revenue Share (%), by Type 2025 & 2033
- Figure 38: Asia Pacific Autologous Stem Cell and Non-Stem Cell Based Therapies Industry Volume Share (%), by Type 2025 & 2033
- Figure 39: Asia Pacific Autologous Stem Cell and Non-Stem Cell Based Therapies Industry Revenue (billion), by Application 2025 & 2033
- Figure 40: Asia Pacific Autologous Stem Cell and Non-Stem Cell Based Therapies Industry Volume (K Unit), by Application 2025 & 2033
- Figure 41: Asia Pacific Autologous Stem Cell and Non-Stem Cell Based Therapies Industry Revenue Share (%), by Application 2025 & 2033
- Figure 42: Asia Pacific Autologous Stem Cell and Non-Stem Cell Based Therapies Industry Volume Share (%), by Application 2025 & 2033
- Figure 43: Asia Pacific Autologous Stem Cell and Non-Stem Cell Based Therapies Industry Revenue (billion), by End User 2025 & 2033
- Figure 44: Asia Pacific Autologous Stem Cell and Non-Stem Cell Based Therapies Industry Volume (K Unit), by End User 2025 & 2033
- Figure 45: Asia Pacific Autologous Stem Cell and Non-Stem Cell Based Therapies Industry Revenue Share (%), by End User 2025 & 2033
- Figure 46: Asia Pacific Autologous Stem Cell and Non-Stem Cell Based Therapies Industry Volume Share (%), by End User 2025 & 2033
- Figure 47: Asia Pacific Autologous Stem Cell and Non-Stem Cell Based Therapies Industry Revenue (billion), by Country 2025 & 2033
- Figure 48: Asia Pacific Autologous Stem Cell and Non-Stem Cell Based Therapies Industry Volume (K Unit), by Country 2025 & 2033
- Figure 49: Asia Pacific Autologous Stem Cell and Non-Stem Cell Based Therapies Industry Revenue Share (%), by Country 2025 & 2033
- Figure 50: Asia Pacific Autologous Stem Cell and Non-Stem Cell Based Therapies Industry Volume Share (%), by Country 2025 & 2033
- Figure 51: Middle East and Africa Autologous Stem Cell and Non-Stem Cell Based Therapies Industry Revenue (billion), by Type 2025 & 2033
- Figure 52: Middle East and Africa Autologous Stem Cell and Non-Stem Cell Based Therapies Industry Volume (K Unit), by Type 2025 & 2033
- Figure 53: Middle East and Africa Autologous Stem Cell and Non-Stem Cell Based Therapies Industry Revenue Share (%), by Type 2025 & 2033
- Figure 54: Middle East and Africa Autologous Stem Cell and Non-Stem Cell Based Therapies Industry Volume Share (%), by Type 2025 & 2033
- Figure 55: Middle East and Africa Autologous Stem Cell and Non-Stem Cell Based Therapies Industry Revenue (billion), by Application 2025 & 2033
- Figure 56: Middle East and Africa Autologous Stem Cell and Non-Stem Cell Based Therapies Industry Volume (K Unit), by Application 2025 & 2033
- Figure 57: Middle East and Africa Autologous Stem Cell and Non-Stem Cell Based Therapies Industry Revenue Share (%), by Application 2025 & 2033
- Figure 58: Middle East and Africa Autologous Stem Cell and Non-Stem Cell Based Therapies Industry Volume Share (%), by Application 2025 & 2033
- Figure 59: Middle East and Africa Autologous Stem Cell and Non-Stem Cell Based Therapies Industry Revenue (billion), by End User 2025 & 2033
- Figure 60: Middle East and Africa Autologous Stem Cell and Non-Stem Cell Based Therapies Industry Volume (K Unit), by End User 2025 & 2033
- Figure 61: Middle East and Africa Autologous Stem Cell and Non-Stem Cell Based Therapies Industry Revenue Share (%), by End User 2025 & 2033
- Figure 62: Middle East and Africa Autologous Stem Cell and Non-Stem Cell Based Therapies Industry Volume Share (%), by End User 2025 & 2033
- Figure 63: Middle East and Africa Autologous Stem Cell and Non-Stem Cell Based Therapies Industry Revenue (billion), by Country 2025 & 2033
- Figure 64: Middle East and Africa Autologous Stem Cell and Non-Stem Cell Based Therapies Industry Volume (K Unit), by Country 2025 & 2033
- Figure 65: Middle East and Africa Autologous Stem Cell and Non-Stem Cell Based Therapies Industry Revenue Share (%), by Country 2025 & 2033
- Figure 66: Middle East and Africa Autologous Stem Cell and Non-Stem Cell Based Therapies Industry Volume Share (%), by Country 2025 & 2033
- Figure 67: South America Autologous Stem Cell and Non-Stem Cell Based Therapies Industry Revenue (billion), by Type 2025 & 2033
- Figure 68: South America Autologous Stem Cell and Non-Stem Cell Based Therapies Industry Volume (K Unit), by Type 2025 & 2033
- Figure 69: South America Autologous Stem Cell and Non-Stem Cell Based Therapies Industry Revenue Share (%), by Type 2025 & 2033
- Figure 70: South America Autologous Stem Cell and Non-Stem Cell Based Therapies Industry Volume Share (%), by Type 2025 & 2033
- Figure 71: South America Autologous Stem Cell and Non-Stem Cell Based Therapies Industry Revenue (billion), by Application 2025 & 2033
- Figure 72: South America Autologous Stem Cell and Non-Stem Cell Based Therapies Industry Volume (K Unit), by Application 2025 & 2033
- Figure 73: South America Autologous Stem Cell and Non-Stem Cell Based Therapies Industry Revenue Share (%), by Application 2025 & 2033
- Figure 74: South America Autologous Stem Cell and Non-Stem Cell Based Therapies Industry Volume Share (%), by Application 2025 & 2033
- Figure 75: South America Autologous Stem Cell and Non-Stem Cell Based Therapies Industry Revenue (billion), by End User 2025 & 2033
- Figure 76: South America Autologous Stem Cell and Non-Stem Cell Based Therapies Industry Volume (K Unit), by End User 2025 & 2033
- Figure 77: South America Autologous Stem Cell and Non-Stem Cell Based Therapies Industry Revenue Share (%), by End User 2025 & 2033
- Figure 78: South America Autologous Stem Cell and Non-Stem Cell Based Therapies Industry Volume Share (%), by End User 2025 & 2033
- Figure 79: South America Autologous Stem Cell and Non-Stem Cell Based Therapies Industry Revenue (billion), by Country 2025 & 2033
- Figure 80: South America Autologous Stem Cell and Non-Stem Cell Based Therapies Industry Volume (K Unit), by Country 2025 & 2033
- Figure 81: South America Autologous Stem Cell and Non-Stem Cell Based Therapies Industry Revenue Share (%), by Country 2025 & 2033
- Figure 82: South America Autologous Stem Cell and Non-Stem Cell Based Therapies Industry Volume Share (%), by Country 2025 & 2033
List of Tables
- Table 1: Global Autologous Stem Cell and Non-Stem Cell Based Therapies Industry Revenue billion Forecast, by Type 2020 & 2033
- Table 2: Global Autologous Stem Cell and Non-Stem Cell Based Therapies Industry Volume K Unit Forecast, by Type 2020 & 2033
- Table 3: Global Autologous Stem Cell and Non-Stem Cell Based Therapies Industry Revenue billion Forecast, by Application 2020 & 2033
- Table 4: Global Autologous Stem Cell and Non-Stem Cell Based Therapies Industry Volume K Unit Forecast, by Application 2020 & 2033
- Table 5: Global Autologous Stem Cell and Non-Stem Cell Based Therapies Industry Revenue billion Forecast, by End User 2020 & 2033
- Table 6: Global Autologous Stem Cell and Non-Stem Cell Based Therapies Industry Volume K Unit Forecast, by End User 2020 & 2033
- Table 7: Global Autologous Stem Cell and Non-Stem Cell Based Therapies Industry Revenue billion Forecast, by Region 2020 & 2033
- Table 8: Global Autologous Stem Cell and Non-Stem Cell Based Therapies Industry Volume K Unit Forecast, by Region 2020 & 2033
- Table 9: Global Autologous Stem Cell and Non-Stem Cell Based Therapies Industry Revenue billion Forecast, by Type 2020 & 2033
- Table 10: Global Autologous Stem Cell and Non-Stem Cell Based Therapies Industry Volume K Unit Forecast, by Type 2020 & 2033
- Table 11: Global Autologous Stem Cell and Non-Stem Cell Based Therapies Industry Revenue billion Forecast, by Application 2020 & 2033
- Table 12: Global Autologous Stem Cell and Non-Stem Cell Based Therapies Industry Volume K Unit Forecast, by Application 2020 & 2033
- Table 13: Global Autologous Stem Cell and Non-Stem Cell Based Therapies Industry Revenue billion Forecast, by End User 2020 & 2033
- Table 14: Global Autologous Stem Cell and Non-Stem Cell Based Therapies Industry Volume K Unit Forecast, by End User 2020 & 2033
- Table 15: Global Autologous Stem Cell and Non-Stem Cell Based Therapies Industry Revenue billion Forecast, by Country 2020 & 2033
- Table 16: Global Autologous Stem Cell and Non-Stem Cell Based Therapies Industry Volume K Unit Forecast, by Country 2020 & 2033
- Table 17: United States Autologous Stem Cell and Non-Stem Cell Based Therapies Industry Revenue (billion) Forecast, by Application 2020 & 2033
- Table 18: United States Autologous Stem Cell and Non-Stem Cell Based Therapies Industry Volume (K Unit) Forecast, by Application 2020 & 2033
- Table 19: Canada Autologous Stem Cell and Non-Stem Cell Based Therapies Industry Revenue (billion) Forecast, by Application 2020 & 2033
- Table 20: Canada Autologous Stem Cell and Non-Stem Cell Based Therapies Industry Volume (K Unit) Forecast, by Application 2020 & 2033
- Table 21: Mexico Autologous Stem Cell and Non-Stem Cell Based Therapies Industry Revenue (billion) Forecast, by Application 2020 & 2033
- Table 22: Mexico Autologous Stem Cell and Non-Stem Cell Based Therapies Industry Volume (K Unit) Forecast, by Application 2020 & 2033
- Table 23: Global Autologous Stem Cell and Non-Stem Cell Based Therapies Industry Revenue billion Forecast, by Type 2020 & 2033
- Table 24: Global Autologous Stem Cell and Non-Stem Cell Based Therapies Industry Volume K Unit Forecast, by Type 2020 & 2033
- Table 25: Global Autologous Stem Cell and Non-Stem Cell Based Therapies Industry Revenue billion Forecast, by Application 2020 & 2033
- Table 26: Global Autologous Stem Cell and Non-Stem Cell Based Therapies Industry Volume K Unit Forecast, by Application 2020 & 2033
- Table 27: Global Autologous Stem Cell and Non-Stem Cell Based Therapies Industry Revenue billion Forecast, by End User 2020 & 2033
- Table 28: Global Autologous Stem Cell and Non-Stem Cell Based Therapies Industry Volume K Unit Forecast, by End User 2020 & 2033
- Table 29: Global Autologous Stem Cell and Non-Stem Cell Based Therapies Industry Revenue billion Forecast, by Country 2020 & 2033
- Table 30: Global Autologous Stem Cell and Non-Stem Cell Based Therapies Industry Volume K Unit Forecast, by Country 2020 & 2033
- Table 31: Germany Autologous Stem Cell and Non-Stem Cell Based Therapies Industry Revenue (billion) Forecast, by Application 2020 & 2033
- Table 32: Germany Autologous Stem Cell and Non-Stem Cell Based Therapies Industry Volume (K Unit) Forecast, by Application 2020 & 2033
- Table 33: United Kingdom Autologous Stem Cell and Non-Stem Cell Based Therapies Industry Revenue (billion) Forecast, by Application 2020 & 2033
- Table 34: United Kingdom Autologous Stem Cell and Non-Stem Cell Based Therapies Industry Volume (K Unit) Forecast, by Application 2020 & 2033
- Table 35: France Autologous Stem Cell and Non-Stem Cell Based Therapies Industry Revenue (billion) Forecast, by Application 2020 & 2033
- Table 36: France Autologous Stem Cell and Non-Stem Cell Based Therapies Industry Volume (K Unit) Forecast, by Application 2020 & 2033
- Table 37: Italy Autologous Stem Cell and Non-Stem Cell Based Therapies Industry Revenue (billion) Forecast, by Application 2020 & 2033
- Table 38: Italy Autologous Stem Cell and Non-Stem Cell Based Therapies Industry Volume (K Unit) Forecast, by Application 2020 & 2033
- Table 39: Spain Autologous Stem Cell and Non-Stem Cell Based Therapies Industry Revenue (billion) Forecast, by Application 2020 & 2033
- Table 40: Spain Autologous Stem Cell and Non-Stem Cell Based Therapies Industry Volume (K Unit) Forecast, by Application 2020 & 2033
- Table 41: Rest of Europe Autologous Stem Cell and Non-Stem Cell Based Therapies Industry Revenue (billion) Forecast, by Application 2020 & 2033
- Table 42: Rest of Europe Autologous Stem Cell and Non-Stem Cell Based Therapies Industry Volume (K Unit) Forecast, by Application 2020 & 2033
- Table 43: Global Autologous Stem Cell and Non-Stem Cell Based Therapies Industry Revenue billion Forecast, by Type 2020 & 2033
- Table 44: Global Autologous Stem Cell and Non-Stem Cell Based Therapies Industry Volume K Unit Forecast, by Type 2020 & 2033
- Table 45: Global Autologous Stem Cell and Non-Stem Cell Based Therapies Industry Revenue billion Forecast, by Application 2020 & 2033
- Table 46: Global Autologous Stem Cell and Non-Stem Cell Based Therapies Industry Volume K Unit Forecast, by Application 2020 & 2033
- Table 47: Global Autologous Stem Cell and Non-Stem Cell Based Therapies Industry Revenue billion Forecast, by End User 2020 & 2033
- Table 48: Global Autologous Stem Cell and Non-Stem Cell Based Therapies Industry Volume K Unit Forecast, by End User 2020 & 2033
- Table 49: Global Autologous Stem Cell and Non-Stem Cell Based Therapies Industry Revenue billion Forecast, by Country 2020 & 2033
- Table 50: Global Autologous Stem Cell and Non-Stem Cell Based Therapies Industry Volume K Unit Forecast, by Country 2020 & 2033
- Table 51: China Autologous Stem Cell and Non-Stem Cell Based Therapies Industry Revenue (billion) Forecast, by Application 2020 & 2033
- Table 52: China Autologous Stem Cell and Non-Stem Cell Based Therapies Industry Volume (K Unit) Forecast, by Application 2020 & 2033
- Table 53: Japan Autologous Stem Cell and Non-Stem Cell Based Therapies Industry Revenue (billion) Forecast, by Application 2020 & 2033
- Table 54: Japan Autologous Stem Cell and Non-Stem Cell Based Therapies Industry Volume (K Unit) Forecast, by Application 2020 & 2033
- Table 55: India Autologous Stem Cell and Non-Stem Cell Based Therapies Industry Revenue (billion) Forecast, by Application 2020 & 2033
- Table 56: India Autologous Stem Cell and Non-Stem Cell Based Therapies Industry Volume (K Unit) Forecast, by Application 2020 & 2033
- Table 57: Australia Autologous Stem Cell and Non-Stem Cell Based Therapies Industry Revenue (billion) Forecast, by Application 2020 & 2033
- Table 58: Australia Autologous Stem Cell and Non-Stem Cell Based Therapies Industry Volume (K Unit) Forecast, by Application 2020 & 2033
- Table 59: South Korea Autologous Stem Cell and Non-Stem Cell Based Therapies Industry Revenue (billion) Forecast, by Application 2020 & 2033
- Table 60: South Korea Autologous Stem Cell and Non-Stem Cell Based Therapies Industry Volume (K Unit) Forecast, by Application 2020 & 2033
- Table 61: Rest of Asia Pacific Autologous Stem Cell and Non-Stem Cell Based Therapies Industry Revenue (billion) Forecast, by Application 2020 & 2033
- Table 62: Rest of Asia Pacific Autologous Stem Cell and Non-Stem Cell Based Therapies Industry Volume (K Unit) Forecast, by Application 2020 & 2033
- Table 63: Global Autologous Stem Cell and Non-Stem Cell Based Therapies Industry Revenue billion Forecast, by Type 2020 & 2033
- Table 64: Global Autologous Stem Cell and Non-Stem Cell Based Therapies Industry Volume K Unit Forecast, by Type 2020 & 2033
- Table 65: Global Autologous Stem Cell and Non-Stem Cell Based Therapies Industry Revenue billion Forecast, by Application 2020 & 2033
- Table 66: Global Autologous Stem Cell and Non-Stem Cell Based Therapies Industry Volume K Unit Forecast, by Application 2020 & 2033
- Table 67: Global Autologous Stem Cell and Non-Stem Cell Based Therapies Industry Revenue billion Forecast, by End User 2020 & 2033
- Table 68: Global Autologous Stem Cell and Non-Stem Cell Based Therapies Industry Volume K Unit Forecast, by End User 2020 & 2033
- Table 69: Global Autologous Stem Cell and Non-Stem Cell Based Therapies Industry Revenue billion Forecast, by Country 2020 & 2033
- Table 70: Global Autologous Stem Cell and Non-Stem Cell Based Therapies Industry Volume K Unit Forecast, by Country 2020 & 2033
- Table 71: GCC Autologous Stem Cell and Non-Stem Cell Based Therapies Industry Revenue (billion) Forecast, by Application 2020 & 2033
- Table 72: GCC Autologous Stem Cell and Non-Stem Cell Based Therapies Industry Volume (K Unit) Forecast, by Application 2020 & 2033
- Table 73: South Africa Autologous Stem Cell and Non-Stem Cell Based Therapies Industry Revenue (billion) Forecast, by Application 2020 & 2033
- Table 74: South Africa Autologous Stem Cell and Non-Stem Cell Based Therapies Industry Volume (K Unit) Forecast, by Application 2020 & 2033
- Table 75: Rest of Middle East and Africa Autologous Stem Cell and Non-Stem Cell Based Therapies Industry Revenue (billion) Forecast, by Application 2020 & 2033
- Table 76: Rest of Middle East and Africa Autologous Stem Cell and Non-Stem Cell Based Therapies Industry Volume (K Unit) Forecast, by Application 2020 & 2033
- Table 77: Global Autologous Stem Cell and Non-Stem Cell Based Therapies Industry Revenue billion Forecast, by Type 2020 & 2033
- Table 78: Global Autologous Stem Cell and Non-Stem Cell Based Therapies Industry Volume K Unit Forecast, by Type 2020 & 2033
- Table 79: Global Autologous Stem Cell and Non-Stem Cell Based Therapies Industry Revenue billion Forecast, by Application 2020 & 2033
- Table 80: Global Autologous Stem Cell and Non-Stem Cell Based Therapies Industry Volume K Unit Forecast, by Application 2020 & 2033
- Table 81: Global Autologous Stem Cell and Non-Stem Cell Based Therapies Industry Revenue billion Forecast, by End User 2020 & 2033
- Table 82: Global Autologous Stem Cell and Non-Stem Cell Based Therapies Industry Volume K Unit Forecast, by End User 2020 & 2033
- Table 83: Global Autologous Stem Cell and Non-Stem Cell Based Therapies Industry Revenue billion Forecast, by Country 2020 & 2033
- Table 84: Global Autologous Stem Cell and Non-Stem Cell Based Therapies Industry Volume K Unit Forecast, by Country 2020 & 2033
- Table 85: Brazil Autologous Stem Cell and Non-Stem Cell Based Therapies Industry Revenue (billion) Forecast, by Application 2020 & 2033
- Table 86: Brazil Autologous Stem Cell and Non-Stem Cell Based Therapies Industry Volume (K Unit) Forecast, by Application 2020 & 2033
- Table 87: Argentina Autologous Stem Cell and Non-Stem Cell Based Therapies Industry Revenue (billion) Forecast, by Application 2020 & 2033
- Table 88: Argentina Autologous Stem Cell and Non-Stem Cell Based Therapies Industry Volume (K Unit) Forecast, by Application 2020 & 2033
- Table 89: Rest of South America Autologous Stem Cell and Non-Stem Cell Based Therapies Industry Revenue (billion) Forecast, by Application 2020 & 2033
- Table 90: Rest of South America Autologous Stem Cell and Non-Stem Cell Based Therapies Industry Volume (K Unit) Forecast, by Application 2020 & 2033
Frequently Asked Questions
1. What is the projected Compound Annual Growth Rate (CAGR) of the Autologous Stem Cell and Non-Stem Cell Based Therapies Industry?
The projected CAGR is approximately 14.89%.
2. Which companies are prominent players in the Autologous Stem Cell and Non-Stem Cell Based Therapies Industry?
Key companies in the market include Dendreon Pharmaceuticals LLC, Cytori Therapeutics Inc, Novartis International AG, Caladrius Biosciences Inc, BrainStorm Cell Limited, Vericel Corp, Gilead Sciences Inc , Castle Creek Biosciences Inc, US Stem Cell Inc, Holostem Terapie Avanzate Srl.
3. What are the main segments of the Autologous Stem Cell and Non-Stem Cell Based Therapies Industry?
The market segments include Type, Application, End User.
4. Can you provide details about the market size?
The market size is estimated to be USD 6.45 billion as of 2022.
5. What are some drivers contributing to market growth?
Rising Prevalence of Targeted Diseases; Introduction of Novel Autologous Stem Cell Based Therapies in Regenerative Medicine; Increasing Geriatric Population.
6. What are the notable trends driving market growth?
Cancer Segment Holds Significant Share in the Autologous Stem Cell and Non-Stem Cell Based Therapies Market.
7. Are there any restraints impacting market growth?
High Cost of Autologous Cellular Therapies; Lack of Skilled Professionals.
8. Can you provide examples of recent developments in the market?
In April 2022, Metcela acquired Japan Regenerative Medicine Co. Ltd to develop cardiac stem cell-based therapy. Through the acquisition, Metcela will add an autologous cell product for pediatric congenital heart disease to its pipeline and significantly strengthen its clinical development infrastructure for regenerative medicine products.
9. What pricing options are available for accessing the report?
Pricing options include single-user, multi-user, and enterprise licenses priced at USD 4750, USD 5250, and USD 8750 respectively.
10. Is the market size provided in terms of value or volume?
The market size is provided in terms of value, measured in billion and volume, measured in K Unit.
11. Are there any specific market keywords associated with the report?
Yes, the market keyword associated with the report is "Autologous Stem Cell and Non-Stem Cell Based Therapies Industry," which aids in identifying and referencing the specific market segment covered.
12. How do I determine which pricing option suits my needs best?
The pricing options vary based on user requirements and access needs. Individual users may opt for single-user licenses, while businesses requiring broader access may choose multi-user or enterprise licenses for cost-effective access to the report.
13. Are there any additional resources or data provided in the Autologous Stem Cell and Non-Stem Cell Based Therapies Industry report?
While the report offers comprehensive insights, it's advisable to review the specific contents or supplementary materials provided to ascertain if additional resources or data are available.
14. How can I stay updated on further developments or reports in the Autologous Stem Cell and Non-Stem Cell Based Therapies Industry?
To stay informed about further developments, trends, and reports in the Autologous Stem Cell and Non-Stem Cell Based Therapies Industry, consider subscribing to industry newsletters, following relevant companies and organizations, or regularly checking reputable industry news sources and publications.
Methodology
Step 1 - Identification of Relevant Samples Size from Population Database


Step 2 - Approaches for Defining Global Market Size (Value, Volume* & Price*)

Note*: In applicable scenarios
Step 3 - Data Sources
Primary Research
- Web Analytics
- Survey Reports
- Research Institute
- Latest Research Reports
- Opinion Leaders
Secondary Research
- Annual Reports
- White Paper
- Latest Press Release
- Industry Association
- Paid Database
- Investor Presentations

Step 4 - Data Triangulation
Involves using different sources of information in order to increase the validity of a study
These sources are likely to be stakeholders in a program - participants, other researchers, program staff, other community members, and so on.
Then we put all data in single framework & apply various statistical tools to find out the dynamic on the market.
During the analysis stage, feedback from the stakeholder groups would be compared to determine areas of agreement as well as areas of divergence