
Key Insights
The Autonomous Mobile Robot (AMR) market for intralogistics applications is experiencing explosive growth, projected to reach a substantial size by 2033. A 33.80% CAGR indicates significant market expansion driven by several key factors. The increasing demand for efficient and flexible warehouse and manufacturing operations is a major catalyst, pushing businesses to automate material handling tasks. E-commerce growth and the resulting need for faster order fulfillment are further boosting adoption. The market is segmented by environment (manufacturing – automotive, electronics, food & beverage, chemicals – and non-manufacturing – logistics centers, warehouses) and robot form factor (tow tractors, order picking, load carrying). The manufacturing sector currently dominates, with automotive and electronics showing particularly strong demand. However, the non-manufacturing segment is expected to grow rapidly due to the rising popularity of automated warehouses and fulfillment centers. Leading players are continuously innovating, introducing advanced functionalities like AI-powered navigation and increased payload capacities, driving market penetration. Despite initial investment costs, the long-term return on investment (ROI) from improved efficiency and reduced labor costs is attracting significant interest from businesses of all sizes.
Technological advancements, particularly in AI and machine learning, are paving the way for more sophisticated and adaptable AMRs. Integration with warehouse management systems (WMS) is becoming increasingly seamless, allowing for better orchestration of material flow within complex logistical networks. However, challenges remain. High initial investment costs and concerns about job displacement can hinder adoption, particularly among smaller companies. Furthermore, the need for robust cybersecurity measures and skilled labor to implement and maintain these systems are crucial considerations. The market is geographically diversified, with North America and Asia-Pacific representing significant regional markets, driven by robust manufacturing sectors and burgeoning e-commerce. Europe is also a major player, showcasing a strong focus on automation in various sectors. The continuing evolution of AMR technology, coupled with increasing demand for automation in logistics, will drive continued market expansion in the coming years.
This in-depth report provides a comprehensive analysis of the Autonomous Mobile Robots (AMRs) market for intralogistics applications, offering valuable insights for stakeholders across the supply chain. The study period spans from 2019 to 2033, with 2025 serving as the base and estimated year. The report covers market size, segmentation, growth drivers, challenges, key players, and emerging trends, providing a 360-degree view of this rapidly evolving market. With a focus on actionable data and strategic recommendations, this report is an essential resource for businesses seeking to navigate the complexities of the AMR landscape.
Autonomous Mobile Robots Market For Intralogistics Applications Market Concentration & Innovation
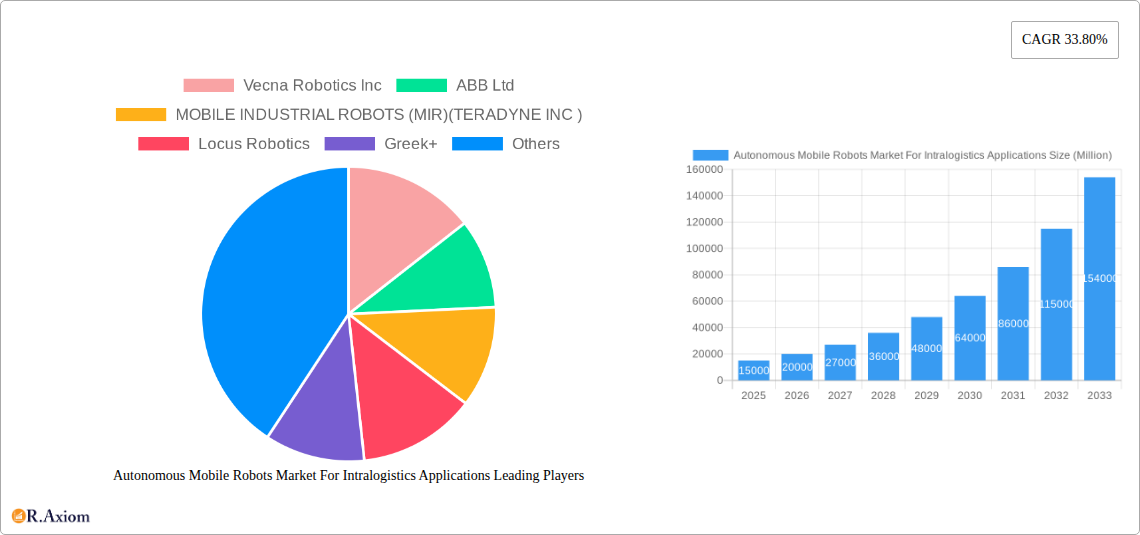
The Autonomous Mobile Robots (AMR) market for intralogistics is experiencing a period of dynamic growth and consolidation. Market concentration is moderate, with several key players holding significant market share, but a large number of smaller, specialized companies also contributing to innovation. The top five companies—including Vecna Robotics Inc, ABB Ltd, Mobile Industrial Robots (MIR) (Teradyne Inc), Locus Robotics, and Grey Orange Pte Ltd—are estimated to hold a combined xx% market share in 2025, with this percentage anticipated to xx% by 2033. However, the market remains relatively fragmented, offering opportunities for both established players and emerging companies.
Several factors drive innovation in this sector. The need for increased efficiency and productivity in warehouses and manufacturing facilities fuels demand for advanced AMR technologies. Technological advancements in areas such as AI, machine learning, and sensor technology are constantly improving the capabilities of AMRs, enhancing their autonomy, navigation, and payload handling capacity. Furthermore, regulatory frameworks are evolving, adapting to the increasing adoption of AMRs and facilitating their safe and effective integration into various operational environments. The presence of product substitutes, such as traditional material handling equipment, is also a driving force for innovation, pushing AMRs towards improved cost-effectiveness and performance. Recent M&A activities, such as the strategic partnership between Solo Brands Inc. and Locus Robotics in September 2023, showcase the consolidating nature of the market and the significant investment in this technology. The value of these M&A deals is estimated at xx Million in 2024, and it's projected to reach xx Million by 2033. End-user trends, focused on automation and digital transformation, further accelerate this growth.
Autonomous Mobile Robots Market For Intralogistics Applications Industry Trends & Insights
The global Autonomous Mobile Robots market for intralogistics applications is experiencing remarkable growth, driven by a confluence of factors. The rising demand for efficient and flexible warehousing and manufacturing solutions is a major catalyst, prompting businesses to adopt automated technologies to optimize their operations. This demand is particularly strong in the e-commerce sector, which is witnessing an unprecedented surge in online orders and demands near-instant fulfillment. Technological advancements in artificial intelligence (AI), machine learning (ML), and computer vision are constantly improving the capabilities of AMRs, enabling them to handle more complex tasks with greater precision and efficiency. This progress contributes to a higher return on investment (ROI) and greater market penetration. The market is expected to exhibit a Compound Annual Growth Rate (CAGR) of xx% during the forecast period (2025-2033). This growth can be attributed to the growing adoption of AMRs in diverse sectors, including manufacturing (automotive, electronics, food and beverage, chemical and pharmaceuticals), logistics (distribution centers, warehouses), and retail. Consumer preferences for faster delivery times and increased transparency in the supply chain are also driving the adoption of AMRs. The competitive dynamics within the market are intense, with both established players and new entrants vying for market share. This competitive landscape is characterized by continuous product development, strategic partnerships, and mergers and acquisitions. The market penetration of AMRs in the intralogistics sector is gradually increasing, with a projected xx% penetration by 2033, indicating the growing acceptance and adoption of this technology.
Dominant Markets & Segments in Autonomous Mobile Robots Market For Intralogistics Applications
The Autonomous Mobile Robots market for intralogistics applications displays significant regional variations in its dominance. While data on specific country-level dominance isn't available, certain segments show clear leadership:
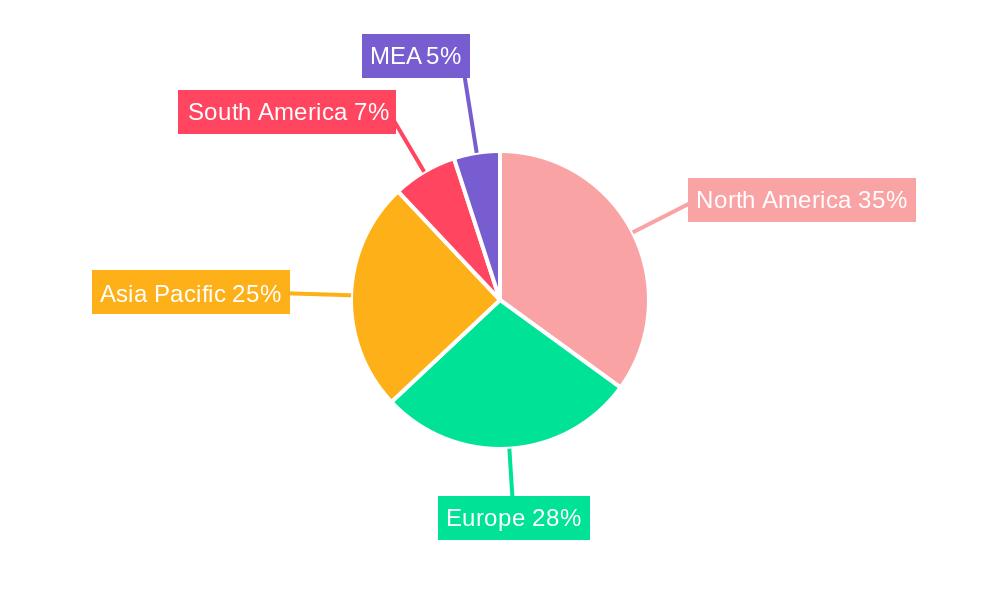
Leading Region: North America and Europe currently hold the largest market share, owing to factors like advanced infrastructure, high adoption rates of automation technologies, and the presence of major AMR manufacturers. Asia-Pacific is projected to witness significant growth, particularly in countries like China and Japan, driven by the expansion of e-commerce and manufacturing industries.
Dominant Environment of Operation: The manufacturing sector, specifically the automotive, electrical & electronics, and food & beverage industries, are leading adopters of AMRs due to the high volume, repetitive nature of their tasks. Non-manufacturing sectors, particularly logistics centers and warehouses, are witnessing rapid growth in AMR deployment.
Leading Form Factor: The order picking/fulfillment segment, particularly unit load and deck load applications, constitutes a large portion of the AMR market, given the need for efficient order processing in e-commerce and logistics. However, the load carrying (forklifts/counterbalance) segment shows strong potential for future growth.
Key Drivers:
- Manufacturing: High labor costs, increasing demand, need for efficiency improvements in production and material handling.
- Non-manufacturing (Logistics): E-commerce growth, pressure to reduce shipping times, the need for improved warehouse space utilization.
The dominance analysis demonstrates the interconnectedness of these sectors. The growth of e-commerce directly boosts demand for AMRs in logistics, while manufacturing's focus on lean principles drives the adoption of AMRs for internal material transport.
Autonomous Mobile Robots Market For Intralogistics Applications Product Developments
Recent product innovations in the AMR market highlight a strong emphasis on improving efficiency, safety, and flexibility. New AMRs feature advanced AI capabilities for more sophisticated navigation and task execution, often incorporating technologies like SLAM (Simultaneous Localization and Mapping) for dynamic environment adaptation. The integration of collaborative robotics (cobots) allows AMRs to seamlessly interact with human workers, enhancing safety and operational efficiency. Companies are focusing on developing AMRs with modular designs and customizable features to cater to the diverse needs of various industries and applications. These developments enhance the competitiveness of AMRs by addressing specific industry needs and improving their cost-effectiveness compared to traditional methods. This has resulted in increased market penetration, particularly in warehouses and logistics centers.
Report Scope & Segmentation Analysis
This report comprehensively segments the Autonomous Mobile Robots market for intralogistics based on environment of operation, form factor, and payload capacity.
Environment of Operation: Manufacturing (Automotive, Electrical & Electronics, Food & Beverage, Chemical & Pharmaceuticals), and Non-Manufacturing (Logistics Centers/Distribution Centers/Warehouses) each demonstrate significant growth potential, with the market size and growth projections varying depending on regional and technological factors. Competitive dynamics differ between these segments, with manufacturers often requiring more robust and specialized solutions compared to logistics centers.
Form Factor: Tow/Tractor/Tug, Order Picking/Fulfillment (Unit Load/Deck Load/Assembly Line), and Load Carrying (Forklifts/Counterbalance) segments show varying growth trajectories, reflecting the unique applications and requirements of each form factor. Competitive landscape is shaped by specialization, with some companies focusing on specific form factors.
Growth projections for each segment vary based on factors including technological advancements, industry-specific adoption rates, and regulatory environments. Competitive dynamics are nuanced, influenced by factors such as pricing strategies, technological differentiation, and partnerships.
Key Drivers of Autonomous Mobile Robots Market For Intralogistics Applications Growth
The growth of the AMR market for intralogistics is propelled by several interconnected factors. Firstly, the ongoing labor shortages in various industries push businesses toward automation to ensure consistent operational efficiency. Secondly, the ever-increasing demand for faster order fulfillment in e-commerce drives the adoption of AMRs for rapid and accurate material handling. Thirdly, technological advancements such as AI, machine learning, and computer vision enhance the capabilities of AMRs, leading to improved accuracy, speed, and safety. Finally, favorable regulatory environments in many countries are facilitating the smooth integration of AMRs into operational settings.
Challenges in the Autonomous Mobile Robots Market For Intralogistics Applications Sector
Despite significant growth potential, the AMR market faces certain challenges. High initial investment costs for AMR implementation can be a significant barrier for smaller businesses. Concerns about the safety and reliability of AMRs in dynamic environments require continuous technological improvements. Integration complexities with existing warehouse management systems (WMS) can also hinder the adoption process. Furthermore, the supply chain constraints and fluctuating component prices impacting manufacturing costs and delivery schedules pose additional challenges. These factors can influence the speed of market penetration and expansion.
Emerging Opportunities in Autonomous Mobile Robots Market For Intralogistics Applications
The AMR market presents several emerging opportunities. The growing adoption of cloud-based AMR management platforms enhances centralized control and data analytics, leading to optimized operations. The integration of AMRs with other automation technologies, like Automated Guided Vehicles (AGVs) and warehouse execution systems (WES), creates synergistic opportunities for enhanced efficiency and supply chain visibility. Expansion into new industries, such as healthcare and construction, presents further growth potential. Advancements in battery technology and charging infrastructure will further unlock the possibilities of AMRs, overcoming limitations in deployment and operational range.
Leading Players in the Autonomous Mobile Robots Market For Intralogistics Applications Market
- Vecna Robotics Inc
- ABB Ltd
- MOBILE INDUSTRIAL ROBOTS (MIR)(TERADYNE INC )
- Locus Robotics
- Greek+
- Guozi Robotics
- Seegrid
- Fetch Robotics
- Aethon
- KION GROUP AG
- HikRobot
- Addverb Technologies Limited
- Agilox
- Suzhou Junion Intelligent Technology Co Ltd
- Dematic
- Grey Orange Pte Ltd
- 6 River Systems LLC
- Clearpath
- Omron
Key Developments in Autonomous Mobile Robots Market For Intralogistics Applications Industry
- September 2023: Solo Brands Inc. and Locus Robotics announced a strategic partnership to enhance order fulfillment operations using AI-powered AMRs.
- September 2023: OTTO Motors launched the OTTO 1200, a high-performance, heavy-duty AMR for tight spaces.
These developments highlight the increasing adoption of AMRs across diverse sectors and the continuous advancements in AMR technology. The strategic partnership between Solo Brands Inc. and Locus Robotics signifies the growing interest from major brands in leveraging AMR technology to optimize their operations. The launch of OTTO 1200 demonstrates the focus on developing AMRs that can effectively navigate challenging environments.
Strategic Outlook for Autonomous Mobile Robots Market For Intralogistics Applications Market
The future of the Autonomous Mobile Robots market for intralogistics applications is exceptionally promising. Continued technological advancements, particularly in AI and machine learning, will enable AMRs to perform even more complex tasks with greater autonomy and efficiency. The increasing demand for automation across various industries, coupled with the growing pressure to optimize supply chains and enhance operational efficiency, will further drive market growth. The emergence of new applications and integration with other automation technologies will expand the market's reach and create new opportunities for innovation. The market is poised for significant expansion, driven by the convergence of technological advancements and evolving industry needs.
Autonomous Mobile Robots Market For Intralogistics Applications Segmentation
-
1. Form Factor
- 1.1. Tow/Tractor/Tug
- 1.2. Order Pi
- 1.3. Load Carrying (Forklifts/Counterbalance)
-
2. Environment of Operation
- 2.1. Manufact
- 2.2. Non-Manu
Autonomous Mobile Robots Market For Intralogistics Applications Segmentation By Geography
- 1. United States
- 2. Europe
- 3. Asia Pacific
- 4. China
- 5. India
- 6. Rest of the World
Autonomous Mobile Robots Market For Intralogistics Applications REPORT HIGHLIGHTS
| Aspects | Details |
|---|---|
| Study Period | 2019-2033 |
| Base Year | 2024 |
| Estimated Year | 2025 |
| Forecast Period | 2025-2033 |
| Historical Period | 2019-2024 |
| Growth Rate | CAGR of 33.80% from 2019-2033 |
| Segmentation |
|
Table of Contents
- 1. Introduction
- 1.1. Research Scope
- 1.2. Market Segmentation
- 1.3. Research Methodology
- 1.4. Definitions and Assumptions
- 2. Executive Summary
- 2.1. Introduction
- 3. Market Dynamics
- 3.1. Introduction
- 3.2. Market Drivers
- 3.2.1. Increasing Demand for Automation across the End-user Industries; Labor-related Challenges Coupled with Advancements in Technology
- 3.3. Market Restrains
- 3.3.1. Communication and Connectivity Issues (navigation and Perception); High Capital Requirements
- 3.4. Market Trends
- 3.4.1. Manufacturing to be the Largest End-user Industry
- 4. Market Factor Analysis
- 4.1. Porters Five Forces
- 4.2. Supply/Value Chain
- 4.3. PESTEL analysis
- 4.4. Market Entropy
- 4.5. Patent/Trademark Analysis
- 5. Global Autonomous Mobile Robots Market For Intralogistics Applications Analysis, Insights and Forecast, 2019-2031
- 5.1. Market Analysis, Insights and Forecast - by Form Factor
- 5.1.1. Tow/Tractor/Tug
- 5.1.2. Order Pi
- 5.1.3. Load Carrying (Forklifts/Counterbalance)
- 5.2. Market Analysis, Insights and Forecast - by Environment of Operation
- 5.2.1. Manufact
- 5.2.2. Non-Manu
- 5.3. Market Analysis, Insights and Forecast - by Region
- 5.3.1. United States
- 5.3.2. Europe
- 5.3.3. Asia Pacific
- 5.3.4. China
- 5.3.5. India
- 5.3.6. Rest of the World
- 5.1. Market Analysis, Insights and Forecast - by Form Factor
- 6. United States Autonomous Mobile Robots Market For Intralogistics Applications Analysis, Insights and Forecast, 2019-2031
- 6.1. Market Analysis, Insights and Forecast - by Form Factor
- 6.1.1. Tow/Tractor/Tug
- 6.1.2. Order Pi
- 6.1.3. Load Carrying (Forklifts/Counterbalance)
- 6.2. Market Analysis, Insights and Forecast - by Environment of Operation
- 6.2.1. Manufact
- 6.2.2. Non-Manu
- 6.1. Market Analysis, Insights and Forecast - by Form Factor
- 7. Europe Autonomous Mobile Robots Market For Intralogistics Applications Analysis, Insights and Forecast, 2019-2031
- 7.1. Market Analysis, Insights and Forecast - by Form Factor
- 7.1.1. Tow/Tractor/Tug
- 7.1.2. Order Pi
- 7.1.3. Load Carrying (Forklifts/Counterbalance)
- 7.2. Market Analysis, Insights and Forecast - by Environment of Operation
- 7.2.1. Manufact
- 7.2.2. Non-Manu
- 7.1. Market Analysis, Insights and Forecast - by Form Factor
- 8. Asia Pacific Autonomous Mobile Robots Market For Intralogistics Applications Analysis, Insights and Forecast, 2019-2031
- 8.1. Market Analysis, Insights and Forecast - by Form Factor
- 8.1.1. Tow/Tractor/Tug
- 8.1.2. Order Pi
- 8.1.3. Load Carrying (Forklifts/Counterbalance)
- 8.2. Market Analysis, Insights and Forecast - by Environment of Operation
- 8.2.1. Manufact
- 8.2.2. Non-Manu
- 8.1. Market Analysis, Insights and Forecast - by Form Factor
- 9. China Autonomous Mobile Robots Market For Intralogistics Applications Analysis, Insights and Forecast, 2019-2031
- 9.1. Market Analysis, Insights and Forecast - by Form Factor
- 9.1.1. Tow/Tractor/Tug
- 9.1.2. Order Pi
- 9.1.3. Load Carrying (Forklifts/Counterbalance)
- 9.2. Market Analysis, Insights and Forecast - by Environment of Operation
- 9.2.1. Manufact
- 9.2.2. Non-Manu
- 9.1. Market Analysis, Insights and Forecast - by Form Factor
- 10. India Autonomous Mobile Robots Market For Intralogistics Applications Analysis, Insights and Forecast, 2019-2031
- 10.1. Market Analysis, Insights and Forecast - by Form Factor
- 10.1.1. Tow/Tractor/Tug
- 10.1.2. Order Pi
- 10.1.3. Load Carrying (Forklifts/Counterbalance)
- 10.2. Market Analysis, Insights and Forecast - by Environment of Operation
- 10.2.1. Manufact
- 10.2.2. Non-Manu
- 10.1. Market Analysis, Insights and Forecast - by Form Factor
- 11. Rest of the World Autonomous Mobile Robots Market For Intralogistics Applications Analysis, Insights and Forecast, 2019-2031
- 11.1. Market Analysis, Insights and Forecast - by Form Factor
- 11.1.1. Tow/Tractor/Tug
- 11.1.2. Order Pi
- 11.1.3. Load Carrying (Forklifts/Counterbalance)
- 11.2. Market Analysis, Insights and Forecast - by Environment of Operation
- 11.2.1. Manufact
- 11.2.2. Non-Manu
- 11.1. Market Analysis, Insights and Forecast - by Form Factor
- 12. North America Autonomous Mobile Robots Market For Intralogistics Applications Analysis, Insights and Forecast, 2019-2031
- 12.1. Market Analysis, Insights and Forecast - By Country/Sub-region
- 12.1.1 United States
- 12.1.2 Canada
- 12.1.3 Mexico
- 13. Europe Autonomous Mobile Robots Market For Intralogistics Applications Analysis, Insights and Forecast, 2019-2031
- 13.1. Market Analysis, Insights and Forecast - By Country/Sub-region
- 13.1.1 Germany
- 13.1.2 United Kingdom
- 13.1.3 France
- 13.1.4 Spain
- 13.1.5 Italy
- 13.1.6 Spain
- 13.1.7 Belgium
- 13.1.8 Netherland
- 13.1.9 Nordics
- 13.1.10 Rest of Europe
- 14. Asia Pacific Autonomous Mobile Robots Market For Intralogistics Applications Analysis, Insights and Forecast, 2019-2031
- 14.1. Market Analysis, Insights and Forecast - By Country/Sub-region
- 14.1.1 China
- 14.1.2 Japan
- 14.1.3 India
- 14.1.4 South Korea
- 14.1.5 Southeast Asia
- 14.1.6 Australia
- 14.1.7 Indonesia
- 14.1.8 Phillipes
- 14.1.9 Singapore
- 14.1.10 Thailandc
- 14.1.11 Rest of Asia Pacific
- 15. South America Autonomous Mobile Robots Market For Intralogistics Applications Analysis, Insights and Forecast, 2019-2031
- 15.1. Market Analysis, Insights and Forecast - By Country/Sub-region
- 15.1.1 Brazil
- 15.1.2 Argentina
- 15.1.3 Peru
- 15.1.4 Chile
- 15.1.5 Colombia
- 15.1.6 Ecuador
- 15.1.7 Venezuela
- 15.1.8 Rest of South America
- 16. MEA Autonomous Mobile Robots Market For Intralogistics Applications Analysis, Insights and Forecast, 2019-2031
- 16.1. Market Analysis, Insights and Forecast - By Country/Sub-region
- 16.1.1 United Arab Emirates
- 16.1.2 Saudi Arabia
- 16.1.3 South Africa
- 16.1.4 Rest of Middle East and Africa
- 17. Competitive Analysis
- 17.1. Global Market Share Analysis 2024
- 17.2. Company Profiles
- 17.2.1 Vecna Robotics Inc
- 17.2.1.1. Overview
- 17.2.1.2. Products
- 17.2.1.3. SWOT Analysis
- 17.2.1.4. Recent Developments
- 17.2.1.5. Financials (Based on Availability)
- 17.2.2 ABB Ltd
- 17.2.2.1. Overview
- 17.2.2.2. Products
- 17.2.2.3. SWOT Analysis
- 17.2.2.4. Recent Developments
- 17.2.2.5. Financials (Based on Availability)
- 17.2.3 MOBILE INDUSTRIAL ROBOTS (MIR)(TERADYNE INC )
- 17.2.3.1. Overview
- 17.2.3.2. Products
- 17.2.3.3. SWOT Analysis
- 17.2.3.4. Recent Developments
- 17.2.3.5. Financials (Based on Availability)
- 17.2.4 Locus Robotics
- 17.2.4.1. Overview
- 17.2.4.2. Products
- 17.2.4.3. SWOT Analysis
- 17.2.4.4. Recent Developments
- 17.2.4.5. Financials (Based on Availability)
- 17.2.5 Greek+
- 17.2.5.1. Overview
- 17.2.5.2. Products
- 17.2.5.3. SWOT Analysis
- 17.2.5.4. Recent Developments
- 17.2.5.5. Financials (Based on Availability)
- 17.2.6 Guozi Robotics
- 17.2.6.1. Overview
- 17.2.6.2. Products
- 17.2.6.3. SWOT Analysis
- 17.2.6.4. Recent Developments
- 17.2.6.5. Financials (Based on Availability)
- 17.2.7 Seegrid
- 17.2.7.1. Overview
- 17.2.7.2. Products
- 17.2.7.3. SWOT Analysis
- 17.2.7.4. Recent Developments
- 17.2.7.5. Financials (Based on Availability)
- 17.2.8 Fetch Robotics
- 17.2.8.1. Overview
- 17.2.8.2. Products
- 17.2.8.3. SWOT Analysis
- 17.2.8.4. Recent Developments
- 17.2.8.5. Financials (Based on Availability)
- 17.2.9 Aethon
- 17.2.9.1. Overview
- 17.2.9.2. Products
- 17.2.9.3. SWOT Analysis
- 17.2.9.4. Recent Developments
- 17.2.9.5. Financials (Based on Availability)
- 17.2.10 KION GROUP AG
- 17.2.10.1. Overview
- 17.2.10.2. Products
- 17.2.10.3. SWOT Analysis
- 17.2.10.4. Recent Developments
- 17.2.10.5. Financials (Based on Availability)
- 17.2.11 HikRobot
- 17.2.11.1. Overview
- 17.2.11.2. Products
- 17.2.11.3. SWOT Analysis
- 17.2.11.4. Recent Developments
- 17.2.11.5. Financials (Based on Availability)
- 17.2.12 Addverb Technologies Limited
- 17.2.12.1. Overview
- 17.2.12.2. Products
- 17.2.12.3. SWOT Analysis
- 17.2.12.4. Recent Developments
- 17.2.12.5. Financials (Based on Availability)
- 17.2.13 Agilox
- 17.2.13.1. Overview
- 17.2.13.2. Products
- 17.2.13.3. SWOT Analysis
- 17.2.13.4. Recent Developments
- 17.2.13.5. Financials (Based on Availability)
- 17.2.14 Suzhou Junion Intelligent Technology Co Ltd
- 17.2.14.1. Overview
- 17.2.14.2. Products
- 17.2.14.3. SWOT Analysis
- 17.2.14.4. Recent Developments
- 17.2.14.5. Financials (Based on Availability)
- 17.2.15 Dematic
- 17.2.15.1. Overview
- 17.2.15.2. Products
- 17.2.15.3. SWOT Analysis
- 17.2.15.4. Recent Developments
- 17.2.15.5. Financials (Based on Availability)
- 17.2.16 Grey Orange Pte Ltd
- 17.2.16.1. Overview
- 17.2.16.2. Products
- 17.2.16.3. SWOT Analysis
- 17.2.16.4. Recent Developments
- 17.2.16.5. Financials (Based on Availability)
- 17.2.17 6 River Systems LLC
- 17.2.17.1. Overview
- 17.2.17.2. Products
- 17.2.17.3. SWOT Analysis
- 17.2.17.4. Recent Developments
- 17.2.17.5. Financials (Based on Availability)
- 17.2.18 Clearpath
- 17.2.18.1. Overview
- 17.2.18.2. Products
- 17.2.18.3. SWOT Analysis
- 17.2.18.4. Recent Developments
- 17.2.18.5. Financials (Based on Availability)
- 17.2.19 Omron
- 17.2.19.1. Overview
- 17.2.19.2. Products
- 17.2.19.3. SWOT Analysis
- 17.2.19.4. Recent Developments
- 17.2.19.5. Financials (Based on Availability)
- 17.2.1 Vecna Robotics Inc
List of Figures
- Figure 1: Global Autonomous Mobile Robots Market For Intralogistics Applications Revenue Breakdown (Million, %) by Region 2024 & 2032
- Figure 2: Global Autonomous Mobile Robots Market For Intralogistics Applications Volume Breakdown (K Units, %) by Region 2024 & 2032
- Figure 3: North America Autonomous Mobile Robots Market For Intralogistics Applications Revenue (Million), by Country 2024 & 2032
- Figure 4: North America Autonomous Mobile Robots Market For Intralogistics Applications Volume (K Units), by Country 2024 & 2032
- Figure 5: North America Autonomous Mobile Robots Market For Intralogistics Applications Revenue Share (%), by Country 2024 & 2032
- Figure 6: North America Autonomous Mobile Robots Market For Intralogistics Applications Volume Share (%), by Country 2024 & 2032
- Figure 7: Europe Autonomous Mobile Robots Market For Intralogistics Applications Revenue (Million), by Country 2024 & 2032
- Figure 8: Europe Autonomous Mobile Robots Market For Intralogistics Applications Volume (K Units), by Country 2024 & 2032
- Figure 9: Europe Autonomous Mobile Robots Market For Intralogistics Applications Revenue Share (%), by Country 2024 & 2032
- Figure 10: Europe Autonomous Mobile Robots Market For Intralogistics Applications Volume Share (%), by Country 2024 & 2032
- Figure 11: Asia Pacific Autonomous Mobile Robots Market For Intralogistics Applications Revenue (Million), by Country 2024 & 2032
- Figure 12: Asia Pacific Autonomous Mobile Robots Market For Intralogistics Applications Volume (K Units), by Country 2024 & 2032
- Figure 13: Asia Pacific Autonomous Mobile Robots Market For Intralogistics Applications Revenue Share (%), by Country 2024 & 2032
- Figure 14: Asia Pacific Autonomous Mobile Robots Market For Intralogistics Applications Volume Share (%), by Country 2024 & 2032
- Figure 15: South America Autonomous Mobile Robots Market For Intralogistics Applications Revenue (Million), by Country 2024 & 2032
- Figure 16: South America Autonomous Mobile Robots Market For Intralogistics Applications Volume (K Units), by Country 2024 & 2032
- Figure 17: South America Autonomous Mobile Robots Market For Intralogistics Applications Revenue Share (%), by Country 2024 & 2032
- Figure 18: South America Autonomous Mobile Robots Market For Intralogistics Applications Volume Share (%), by Country 2024 & 2032
- Figure 19: MEA Autonomous Mobile Robots Market For Intralogistics Applications Revenue (Million), by Country 2024 & 2032
- Figure 20: MEA Autonomous Mobile Robots Market For Intralogistics Applications Volume (K Units), by Country 2024 & 2032
- Figure 21: MEA Autonomous Mobile Robots Market For Intralogistics Applications Revenue Share (%), by Country 2024 & 2032
- Figure 22: MEA Autonomous Mobile Robots Market For Intralogistics Applications Volume Share (%), by Country 2024 & 2032
- Figure 23: United States Autonomous Mobile Robots Market For Intralogistics Applications Revenue (Million), by Form Factor 2024 & 2032
- Figure 24: United States Autonomous Mobile Robots Market For Intralogistics Applications Volume (K Units), by Form Factor 2024 & 2032
- Figure 25: United States Autonomous Mobile Robots Market For Intralogistics Applications Revenue Share (%), by Form Factor 2024 & 2032
- Figure 26: United States Autonomous Mobile Robots Market For Intralogistics Applications Volume Share (%), by Form Factor 2024 & 2032
- Figure 27: United States Autonomous Mobile Robots Market For Intralogistics Applications Revenue (Million), by Environment of Operation 2024 & 2032
- Figure 28: United States Autonomous Mobile Robots Market For Intralogistics Applications Volume (K Units), by Environment of Operation 2024 & 2032
- Figure 29: United States Autonomous Mobile Robots Market For Intralogistics Applications Revenue Share (%), by Environment of Operation 2024 & 2032
- Figure 30: United States Autonomous Mobile Robots Market For Intralogistics Applications Volume Share (%), by Environment of Operation 2024 & 2032
- Figure 31: United States Autonomous Mobile Robots Market For Intralogistics Applications Revenue (Million), by Country 2024 & 2032
- Figure 32: United States Autonomous Mobile Robots Market For Intralogistics Applications Volume (K Units), by Country 2024 & 2032
- Figure 33: United States Autonomous Mobile Robots Market For Intralogistics Applications Revenue Share (%), by Country 2024 & 2032
- Figure 34: United States Autonomous Mobile Robots Market For Intralogistics Applications Volume Share (%), by Country 2024 & 2032
- Figure 35: Europe Autonomous Mobile Robots Market For Intralogistics Applications Revenue (Million), by Form Factor 2024 & 2032
- Figure 36: Europe Autonomous Mobile Robots Market For Intralogistics Applications Volume (K Units), by Form Factor 2024 & 2032
- Figure 37: Europe Autonomous Mobile Robots Market For Intralogistics Applications Revenue Share (%), by Form Factor 2024 & 2032
- Figure 38: Europe Autonomous Mobile Robots Market For Intralogistics Applications Volume Share (%), by Form Factor 2024 & 2032
- Figure 39: Europe Autonomous Mobile Robots Market For Intralogistics Applications Revenue (Million), by Environment of Operation 2024 & 2032
- Figure 40: Europe Autonomous Mobile Robots Market For Intralogistics Applications Volume (K Units), by Environment of Operation 2024 & 2032
- Figure 41: Europe Autonomous Mobile Robots Market For Intralogistics Applications Revenue Share (%), by Environment of Operation 2024 & 2032
- Figure 42: Europe Autonomous Mobile Robots Market For Intralogistics Applications Volume Share (%), by Environment of Operation 2024 & 2032
- Figure 43: Europe Autonomous Mobile Robots Market For Intralogistics Applications Revenue (Million), by Country 2024 & 2032
- Figure 44: Europe Autonomous Mobile Robots Market For Intralogistics Applications Volume (K Units), by Country 2024 & 2032
- Figure 45: Europe Autonomous Mobile Robots Market For Intralogistics Applications Revenue Share (%), by Country 2024 & 2032
- Figure 46: Europe Autonomous Mobile Robots Market For Intralogistics Applications Volume Share (%), by Country 2024 & 2032
- Figure 47: Asia Pacific Autonomous Mobile Robots Market For Intralogistics Applications Revenue (Million), by Form Factor 2024 & 2032
- Figure 48: Asia Pacific Autonomous Mobile Robots Market For Intralogistics Applications Volume (K Units), by Form Factor 2024 & 2032
- Figure 49: Asia Pacific Autonomous Mobile Robots Market For Intralogistics Applications Revenue Share (%), by Form Factor 2024 & 2032
- Figure 50: Asia Pacific Autonomous Mobile Robots Market For Intralogistics Applications Volume Share (%), by Form Factor 2024 & 2032
- Figure 51: Asia Pacific Autonomous Mobile Robots Market For Intralogistics Applications Revenue (Million), by Environment of Operation 2024 & 2032
- Figure 52: Asia Pacific Autonomous Mobile Robots Market For Intralogistics Applications Volume (K Units), by Environment of Operation 2024 & 2032
- Figure 53: Asia Pacific Autonomous Mobile Robots Market For Intralogistics Applications Revenue Share (%), by Environment of Operation 2024 & 2032
- Figure 54: Asia Pacific Autonomous Mobile Robots Market For Intralogistics Applications Volume Share (%), by Environment of Operation 2024 & 2032
- Figure 55: Asia Pacific Autonomous Mobile Robots Market For Intralogistics Applications Revenue (Million), by Country 2024 & 2032
- Figure 56: Asia Pacific Autonomous Mobile Robots Market For Intralogistics Applications Volume (K Units), by Country 2024 & 2032
- Figure 57: Asia Pacific Autonomous Mobile Robots Market For Intralogistics Applications Revenue Share (%), by Country 2024 & 2032
- Figure 58: Asia Pacific Autonomous Mobile Robots Market For Intralogistics Applications Volume Share (%), by Country 2024 & 2032
- Figure 59: China Autonomous Mobile Robots Market For Intralogistics Applications Revenue (Million), by Form Factor 2024 & 2032
- Figure 60: China Autonomous Mobile Robots Market For Intralogistics Applications Volume (K Units), by Form Factor 2024 & 2032
- Figure 61: China Autonomous Mobile Robots Market For Intralogistics Applications Revenue Share (%), by Form Factor 2024 & 2032
- Figure 62: China Autonomous Mobile Robots Market For Intralogistics Applications Volume Share (%), by Form Factor 2024 & 2032
- Figure 63: China Autonomous Mobile Robots Market For Intralogistics Applications Revenue (Million), by Environment of Operation 2024 & 2032
- Figure 64: China Autonomous Mobile Robots Market For Intralogistics Applications Volume (K Units), by Environment of Operation 2024 & 2032
- Figure 65: China Autonomous Mobile Robots Market For Intralogistics Applications Revenue Share (%), by Environment of Operation 2024 & 2032
- Figure 66: China Autonomous Mobile Robots Market For Intralogistics Applications Volume Share (%), by Environment of Operation 2024 & 2032
- Figure 67: China Autonomous Mobile Robots Market For Intralogistics Applications Revenue (Million), by Country 2024 & 2032
- Figure 68: China Autonomous Mobile Robots Market For Intralogistics Applications Volume (K Units), by Country 2024 & 2032
- Figure 69: China Autonomous Mobile Robots Market For Intralogistics Applications Revenue Share (%), by Country 2024 & 2032
- Figure 70: China Autonomous Mobile Robots Market For Intralogistics Applications Volume Share (%), by Country 2024 & 2032
- Figure 71: India Autonomous Mobile Robots Market For Intralogistics Applications Revenue (Million), by Form Factor 2024 & 2032
- Figure 72: India Autonomous Mobile Robots Market For Intralogistics Applications Volume (K Units), by Form Factor 2024 & 2032
- Figure 73: India Autonomous Mobile Robots Market For Intralogistics Applications Revenue Share (%), by Form Factor 2024 & 2032
- Figure 74: India Autonomous Mobile Robots Market For Intralogistics Applications Volume Share (%), by Form Factor 2024 & 2032
- Figure 75: India Autonomous Mobile Robots Market For Intralogistics Applications Revenue (Million), by Environment of Operation 2024 & 2032
- Figure 76: India Autonomous Mobile Robots Market For Intralogistics Applications Volume (K Units), by Environment of Operation 2024 & 2032
- Figure 77: India Autonomous Mobile Robots Market For Intralogistics Applications Revenue Share (%), by Environment of Operation 2024 & 2032
- Figure 78: India Autonomous Mobile Robots Market For Intralogistics Applications Volume Share (%), by Environment of Operation 2024 & 2032
- Figure 79: India Autonomous Mobile Robots Market For Intralogistics Applications Revenue (Million), by Country 2024 & 2032
- Figure 80: India Autonomous Mobile Robots Market For Intralogistics Applications Volume (K Units), by Country 2024 & 2032
- Figure 81: India Autonomous Mobile Robots Market For Intralogistics Applications Revenue Share (%), by Country 2024 & 2032
- Figure 82: India Autonomous Mobile Robots Market For Intralogistics Applications Volume Share (%), by Country 2024 & 2032
- Figure 83: Rest of the World Autonomous Mobile Robots Market For Intralogistics Applications Revenue (Million), by Form Factor 2024 & 2032
- Figure 84: Rest of the World Autonomous Mobile Robots Market For Intralogistics Applications Volume (K Units), by Form Factor 2024 & 2032
- Figure 85: Rest of the World Autonomous Mobile Robots Market For Intralogistics Applications Revenue Share (%), by Form Factor 2024 & 2032
- Figure 86: Rest of the World Autonomous Mobile Robots Market For Intralogistics Applications Volume Share (%), by Form Factor 2024 & 2032
- Figure 87: Rest of the World Autonomous Mobile Robots Market For Intralogistics Applications Revenue (Million), by Environment of Operation 2024 & 2032
- Figure 88: Rest of the World Autonomous Mobile Robots Market For Intralogistics Applications Volume (K Units), by Environment of Operation 2024 & 2032
- Figure 89: Rest of the World Autonomous Mobile Robots Market For Intralogistics Applications Revenue Share (%), by Environment of Operation 2024 & 2032
- Figure 90: Rest of the World Autonomous Mobile Robots Market For Intralogistics Applications Volume Share (%), by Environment of Operation 2024 & 2032
- Figure 91: Rest of the World Autonomous Mobile Robots Market For Intralogistics Applications Revenue (Million), by Country 2024 & 2032
- Figure 92: Rest of the World Autonomous Mobile Robots Market For Intralogistics Applications Volume (K Units), by Country 2024 & 2032
- Figure 93: Rest of the World Autonomous Mobile Robots Market For Intralogistics Applications Revenue Share (%), by Country 2024 & 2032
- Figure 94: Rest of the World Autonomous Mobile Robots Market For Intralogistics Applications Volume Share (%), by Country 2024 & 2032
List of Tables
- Table 1: Global Autonomous Mobile Robots Market For Intralogistics Applications Revenue Million Forecast, by Region 2019 & 2032
- Table 2: Global Autonomous Mobile Robots Market For Intralogistics Applications Volume K Units Forecast, by Region 2019 & 2032
- Table 3: Global Autonomous Mobile Robots Market For Intralogistics Applications Revenue Million Forecast, by Form Factor 2019 & 2032
- Table 4: Global Autonomous Mobile Robots Market For Intralogistics Applications Volume K Units Forecast, by Form Factor 2019 & 2032
- Table 5: Global Autonomous Mobile Robots Market For Intralogistics Applications Revenue Million Forecast, by Environment of Operation 2019 & 2032
- Table 6: Global Autonomous Mobile Robots Market For Intralogistics Applications Volume K Units Forecast, by Environment of Operation 2019 & 2032
- Table 7: Global Autonomous Mobile Robots Market For Intralogistics Applications Revenue Million Forecast, by Region 2019 & 2032
- Table 8: Global Autonomous Mobile Robots Market For Intralogistics Applications Volume K Units Forecast, by Region 2019 & 2032
- Table 9: Global Autonomous Mobile Robots Market For Intralogistics Applications Revenue Million Forecast, by Country 2019 & 2032
- Table 10: Global Autonomous Mobile Robots Market For Intralogistics Applications Volume K Units Forecast, by Country 2019 & 2032
- Table 11: United States Autonomous Mobile Robots Market For Intralogistics Applications Revenue (Million) Forecast, by Application 2019 & 2032
- Table 12: United States Autonomous Mobile Robots Market For Intralogistics Applications Volume (K Units) Forecast, by Application 2019 & 2032
- Table 13: Canada Autonomous Mobile Robots Market For Intralogistics Applications Revenue (Million) Forecast, by Application 2019 & 2032
- Table 14: Canada Autonomous Mobile Robots Market For Intralogistics Applications Volume (K Units) Forecast, by Application 2019 & 2032
- Table 15: Mexico Autonomous Mobile Robots Market For Intralogistics Applications Revenue (Million) Forecast, by Application 2019 & 2032
- Table 16: Mexico Autonomous Mobile Robots Market For Intralogistics Applications Volume (K Units) Forecast, by Application 2019 & 2032
- Table 17: Global Autonomous Mobile Robots Market For Intralogistics Applications Revenue Million Forecast, by Country 2019 & 2032
- Table 18: Global Autonomous Mobile Robots Market For Intralogistics Applications Volume K Units Forecast, by Country 2019 & 2032
- Table 19: Germany Autonomous Mobile Robots Market For Intralogistics Applications Revenue (Million) Forecast, by Application 2019 & 2032
- Table 20: Germany Autonomous Mobile Robots Market For Intralogistics Applications Volume (K Units) Forecast, by Application 2019 & 2032
- Table 21: United Kingdom Autonomous Mobile Robots Market For Intralogistics Applications Revenue (Million) Forecast, by Application 2019 & 2032
- Table 22: United Kingdom Autonomous Mobile Robots Market For Intralogistics Applications Volume (K Units) Forecast, by Application 2019 & 2032
- Table 23: France Autonomous Mobile Robots Market For Intralogistics Applications Revenue (Million) Forecast, by Application 2019 & 2032
- Table 24: France Autonomous Mobile Robots Market For Intralogistics Applications Volume (K Units) Forecast, by Application 2019 & 2032
- Table 25: Spain Autonomous Mobile Robots Market For Intralogistics Applications Revenue (Million) Forecast, by Application 2019 & 2032
- Table 26: Spain Autonomous Mobile Robots Market For Intralogistics Applications Volume (K Units) Forecast, by Application 2019 & 2032
- Table 27: Italy Autonomous Mobile Robots Market For Intralogistics Applications Revenue (Million) Forecast, by Application 2019 & 2032
- Table 28: Italy Autonomous Mobile Robots Market For Intralogistics Applications Volume (K Units) Forecast, by Application 2019 & 2032
- Table 29: Spain Autonomous Mobile Robots Market For Intralogistics Applications Revenue (Million) Forecast, by Application 2019 & 2032
- Table 30: Spain Autonomous Mobile Robots Market For Intralogistics Applications Volume (K Units) Forecast, by Application 2019 & 2032
- Table 31: Belgium Autonomous Mobile Robots Market For Intralogistics Applications Revenue (Million) Forecast, by Application 2019 & 2032
- Table 32: Belgium Autonomous Mobile Robots Market For Intralogistics Applications Volume (K Units) Forecast, by Application 2019 & 2032
- Table 33: Netherland Autonomous Mobile Robots Market For Intralogistics Applications Revenue (Million) Forecast, by Application 2019 & 2032
- Table 34: Netherland Autonomous Mobile Robots Market For Intralogistics Applications Volume (K Units) Forecast, by Application 2019 & 2032
- Table 35: Nordics Autonomous Mobile Robots Market For Intralogistics Applications Revenue (Million) Forecast, by Application 2019 & 2032
- Table 36: Nordics Autonomous Mobile Robots Market For Intralogistics Applications Volume (K Units) Forecast, by Application 2019 & 2032
- Table 37: Rest of Europe Autonomous Mobile Robots Market For Intralogistics Applications Revenue (Million) Forecast, by Application 2019 & 2032
- Table 38: Rest of Europe Autonomous Mobile Robots Market For Intralogistics Applications Volume (K Units) Forecast, by Application 2019 & 2032
- Table 39: Global Autonomous Mobile Robots Market For Intralogistics Applications Revenue Million Forecast, by Country 2019 & 2032
- Table 40: Global Autonomous Mobile Robots Market For Intralogistics Applications Volume K Units Forecast, by Country 2019 & 2032
- Table 41: China Autonomous Mobile Robots Market For Intralogistics Applications Revenue (Million) Forecast, by Application 2019 & 2032
- Table 42: China Autonomous Mobile Robots Market For Intralogistics Applications Volume (K Units) Forecast, by Application 2019 & 2032
- Table 43: Japan Autonomous Mobile Robots Market For Intralogistics Applications Revenue (Million) Forecast, by Application 2019 & 2032
- Table 44: Japan Autonomous Mobile Robots Market For Intralogistics Applications Volume (K Units) Forecast, by Application 2019 & 2032
- Table 45: India Autonomous Mobile Robots Market For Intralogistics Applications Revenue (Million) Forecast, by Application 2019 & 2032
- Table 46: India Autonomous Mobile Robots Market For Intralogistics Applications Volume (K Units) Forecast, by Application 2019 & 2032
- Table 47: South Korea Autonomous Mobile Robots Market For Intralogistics Applications Revenue (Million) Forecast, by Application 2019 & 2032
- Table 48: South Korea Autonomous Mobile Robots Market For Intralogistics Applications Volume (K Units) Forecast, by Application 2019 & 2032
- Table 49: Southeast Asia Autonomous Mobile Robots Market For Intralogistics Applications Revenue (Million) Forecast, by Application 2019 & 2032
- Table 50: Southeast Asia Autonomous Mobile Robots Market For Intralogistics Applications Volume (K Units) Forecast, by Application 2019 & 2032
- Table 51: Australia Autonomous Mobile Robots Market For Intralogistics Applications Revenue (Million) Forecast, by Application 2019 & 2032
- Table 52: Australia Autonomous Mobile Robots Market For Intralogistics Applications Volume (K Units) Forecast, by Application 2019 & 2032
- Table 53: Indonesia Autonomous Mobile Robots Market For Intralogistics Applications Revenue (Million) Forecast, by Application 2019 & 2032
- Table 54: Indonesia Autonomous Mobile Robots Market For Intralogistics Applications Volume (K Units) Forecast, by Application 2019 & 2032
- Table 55: Phillipes Autonomous Mobile Robots Market For Intralogistics Applications Revenue (Million) Forecast, by Application 2019 & 2032
- Table 56: Phillipes Autonomous Mobile Robots Market For Intralogistics Applications Volume (K Units) Forecast, by Application 2019 & 2032
- Table 57: Singapore Autonomous Mobile Robots Market For Intralogistics Applications Revenue (Million) Forecast, by Application 2019 & 2032
- Table 58: Singapore Autonomous Mobile Robots Market For Intralogistics Applications Volume (K Units) Forecast, by Application 2019 & 2032
- Table 59: Thailandc Autonomous Mobile Robots Market For Intralogistics Applications Revenue (Million) Forecast, by Application 2019 & 2032
- Table 60: Thailandc Autonomous Mobile Robots Market For Intralogistics Applications Volume (K Units) Forecast, by Application 2019 & 2032
- Table 61: Rest of Asia Pacific Autonomous Mobile Robots Market For Intralogistics Applications Revenue (Million) Forecast, by Application 2019 & 2032
- Table 62: Rest of Asia Pacific Autonomous Mobile Robots Market For Intralogistics Applications Volume (K Units) Forecast, by Application 2019 & 2032
- Table 63: Global Autonomous Mobile Robots Market For Intralogistics Applications Revenue Million Forecast, by Country 2019 & 2032
- Table 64: Global Autonomous Mobile Robots Market For Intralogistics Applications Volume K Units Forecast, by Country 2019 & 2032
- Table 65: Brazil Autonomous Mobile Robots Market For Intralogistics Applications Revenue (Million) Forecast, by Application 2019 & 2032
- Table 66: Brazil Autonomous Mobile Robots Market For Intralogistics Applications Volume (K Units) Forecast, by Application 2019 & 2032
- Table 67: Argentina Autonomous Mobile Robots Market For Intralogistics Applications Revenue (Million) Forecast, by Application 2019 & 2032
- Table 68: Argentina Autonomous Mobile Robots Market For Intralogistics Applications Volume (K Units) Forecast, by Application 2019 & 2032
- Table 69: Peru Autonomous Mobile Robots Market For Intralogistics Applications Revenue (Million) Forecast, by Application 2019 & 2032
- Table 70: Peru Autonomous Mobile Robots Market For Intralogistics Applications Volume (K Units) Forecast, by Application 2019 & 2032
- Table 71: Chile Autonomous Mobile Robots Market For Intralogistics Applications Revenue (Million) Forecast, by Application 2019 & 2032
- Table 72: Chile Autonomous Mobile Robots Market For Intralogistics Applications Volume (K Units) Forecast, by Application 2019 & 2032
- Table 73: Colombia Autonomous Mobile Robots Market For Intralogistics Applications Revenue (Million) Forecast, by Application 2019 & 2032
- Table 74: Colombia Autonomous Mobile Robots Market For Intralogistics Applications Volume (K Units) Forecast, by Application 2019 & 2032
- Table 75: Ecuador Autonomous Mobile Robots Market For Intralogistics Applications Revenue (Million) Forecast, by Application 2019 & 2032
- Table 76: Ecuador Autonomous Mobile Robots Market For Intralogistics Applications Volume (K Units) Forecast, by Application 2019 & 2032
- Table 77: Venezuela Autonomous Mobile Robots Market For Intralogistics Applications Revenue (Million) Forecast, by Application 2019 & 2032
- Table 78: Venezuela Autonomous Mobile Robots Market For Intralogistics Applications Volume (K Units) Forecast, by Application 2019 & 2032
- Table 79: Rest of South America Autonomous Mobile Robots Market For Intralogistics Applications Revenue (Million) Forecast, by Application 2019 & 2032
- Table 80: Rest of South America Autonomous Mobile Robots Market For Intralogistics Applications Volume (K Units) Forecast, by Application 2019 & 2032
- Table 81: Global Autonomous Mobile Robots Market For Intralogistics Applications Revenue Million Forecast, by Country 2019 & 2032
- Table 82: Global Autonomous Mobile Robots Market For Intralogistics Applications Volume K Units Forecast, by Country 2019 & 2032
- Table 83: United Arab Emirates Autonomous Mobile Robots Market For Intralogistics Applications Revenue (Million) Forecast, by Application 2019 & 2032
- Table 84: United Arab Emirates Autonomous Mobile Robots Market For Intralogistics Applications Volume (K Units) Forecast, by Application 2019 & 2032
- Table 85: Saudi Arabia Autonomous Mobile Robots Market For Intralogistics Applications Revenue (Million) Forecast, by Application 2019 & 2032
- Table 86: Saudi Arabia Autonomous Mobile Robots Market For Intralogistics Applications Volume (K Units) Forecast, by Application 2019 & 2032
- Table 87: South Africa Autonomous Mobile Robots Market For Intralogistics Applications Revenue (Million) Forecast, by Application 2019 & 2032
- Table 88: South Africa Autonomous Mobile Robots Market For Intralogistics Applications Volume (K Units) Forecast, by Application 2019 & 2032
- Table 89: Rest of Middle East and Africa Autonomous Mobile Robots Market For Intralogistics Applications Revenue (Million) Forecast, by Application 2019 & 2032
- Table 90: Rest of Middle East and Africa Autonomous Mobile Robots Market For Intralogistics Applications Volume (K Units) Forecast, by Application 2019 & 2032
- Table 91: Global Autonomous Mobile Robots Market For Intralogistics Applications Revenue Million Forecast, by Form Factor 2019 & 2032
- Table 92: Global Autonomous Mobile Robots Market For Intralogistics Applications Volume K Units Forecast, by Form Factor 2019 & 2032
- Table 93: Global Autonomous Mobile Robots Market For Intralogistics Applications Revenue Million Forecast, by Environment of Operation 2019 & 2032
- Table 94: Global Autonomous Mobile Robots Market For Intralogistics Applications Volume K Units Forecast, by Environment of Operation 2019 & 2032
- Table 95: Global Autonomous Mobile Robots Market For Intralogistics Applications Revenue Million Forecast, by Country 2019 & 2032
- Table 96: Global Autonomous Mobile Robots Market For Intralogistics Applications Volume K Units Forecast, by Country 2019 & 2032
- Table 97: Global Autonomous Mobile Robots Market For Intralogistics Applications Revenue Million Forecast, by Form Factor 2019 & 2032
- Table 98: Global Autonomous Mobile Robots Market For Intralogistics Applications Volume K Units Forecast, by Form Factor 2019 & 2032
- Table 99: Global Autonomous Mobile Robots Market For Intralogistics Applications Revenue Million Forecast, by Environment of Operation 2019 & 2032
- Table 100: Global Autonomous Mobile Robots Market For Intralogistics Applications Volume K Units Forecast, by Environment of Operation 2019 & 2032
- Table 101: Global Autonomous Mobile Robots Market For Intralogistics Applications Revenue Million Forecast, by Country 2019 & 2032
- Table 102: Global Autonomous Mobile Robots Market For Intralogistics Applications Volume K Units Forecast, by Country 2019 & 2032
- Table 103: Global Autonomous Mobile Robots Market For Intralogistics Applications Revenue Million Forecast, by Form Factor 2019 & 2032
- Table 104: Global Autonomous Mobile Robots Market For Intralogistics Applications Volume K Units Forecast, by Form Factor 2019 & 2032
- Table 105: Global Autonomous Mobile Robots Market For Intralogistics Applications Revenue Million Forecast, by Environment of Operation 2019 & 2032
- Table 106: Global Autonomous Mobile Robots Market For Intralogistics Applications Volume K Units Forecast, by Environment of Operation 2019 & 2032
- Table 107: Global Autonomous Mobile Robots Market For Intralogistics Applications Revenue Million Forecast, by Country 2019 & 2032
- Table 108: Global Autonomous Mobile Robots Market For Intralogistics Applications Volume K Units Forecast, by Country 2019 & 2032
- Table 109: Global Autonomous Mobile Robots Market For Intralogistics Applications Revenue Million Forecast, by Form Factor 2019 & 2032
- Table 110: Global Autonomous Mobile Robots Market For Intralogistics Applications Volume K Units Forecast, by Form Factor 2019 & 2032
- Table 111: Global Autonomous Mobile Robots Market For Intralogistics Applications Revenue Million Forecast, by Environment of Operation 2019 & 2032
- Table 112: Global Autonomous Mobile Robots Market For Intralogistics Applications Volume K Units Forecast, by Environment of Operation 2019 & 2032
- Table 113: Global Autonomous Mobile Robots Market For Intralogistics Applications Revenue Million Forecast, by Country 2019 & 2032
- Table 114: Global Autonomous Mobile Robots Market For Intralogistics Applications Volume K Units Forecast, by Country 2019 & 2032
- Table 115: Global Autonomous Mobile Robots Market For Intralogistics Applications Revenue Million Forecast, by Form Factor 2019 & 2032
- Table 116: Global Autonomous Mobile Robots Market For Intralogistics Applications Volume K Units Forecast, by Form Factor 2019 & 2032
- Table 117: Global Autonomous Mobile Robots Market For Intralogistics Applications Revenue Million Forecast, by Environment of Operation 2019 & 2032
- Table 118: Global Autonomous Mobile Robots Market For Intralogistics Applications Volume K Units Forecast, by Environment of Operation 2019 & 2032
- Table 119: Global Autonomous Mobile Robots Market For Intralogistics Applications Revenue Million Forecast, by Country 2019 & 2032
- Table 120: Global Autonomous Mobile Robots Market For Intralogistics Applications Volume K Units Forecast, by Country 2019 & 2032
- Table 121: Global Autonomous Mobile Robots Market For Intralogistics Applications Revenue Million Forecast, by Form Factor 2019 & 2032
- Table 122: Global Autonomous Mobile Robots Market For Intralogistics Applications Volume K Units Forecast, by Form Factor 2019 & 2032
- Table 123: Global Autonomous Mobile Robots Market For Intralogistics Applications Revenue Million Forecast, by Environment of Operation 2019 & 2032
- Table 124: Global Autonomous Mobile Robots Market For Intralogistics Applications Volume K Units Forecast, by Environment of Operation 2019 & 2032
- Table 125: Global Autonomous Mobile Robots Market For Intralogistics Applications Revenue Million Forecast, by Country 2019 & 2032
- Table 126: Global Autonomous Mobile Robots Market For Intralogistics Applications Volume K Units Forecast, by Country 2019 & 2032
Frequently Asked Questions
1. What is the projected Compound Annual Growth Rate (CAGR) of the Autonomous Mobile Robots Market For Intralogistics Applications?
The projected CAGR is approximately 33.80%.
2. Which companies are prominent players in the Autonomous Mobile Robots Market For Intralogistics Applications?
Key companies in the market include Vecna Robotics Inc, ABB Ltd, MOBILE INDUSTRIAL ROBOTS (MIR)(TERADYNE INC ), Locus Robotics, Greek+, Guozi Robotics, Seegrid, Fetch Robotics, Aethon, KION GROUP AG, HikRobot, Addverb Technologies Limited, Agilox, Suzhou Junion Intelligent Technology Co Ltd, Dematic, Grey Orange Pte Ltd, 6 River Systems LLC, Clearpath, Omron.
3. What are the main segments of the Autonomous Mobile Robots Market For Intralogistics Applications?
The market segments include Form Factor, Environment of Operation.
4. Can you provide details about the market size?
The market size is estimated to be USD XX Million as of 2022.
5. What are some drivers contributing to market growth?
Increasing Demand for Automation across the End-user Industries; Labor-related Challenges Coupled with Advancements in Technology.
6. What are the notable trends driving market growth?
Manufacturing to be the Largest End-user Industry.
7. Are there any restraints impacting market growth?
Communication and Connectivity Issues (navigation and Perception); High Capital Requirements.
8. Can you provide examples of recent developments in the market?
September 2023: Solo Brands Inc., a prominent global lifestyle brand, and Locus Robotics announced their strategic partnership. This collaboration aims to enhance and streamline Solo Brands' order fulfillment operations through the implementation of cutting-edge AI-powered Autonomous Mobile Robots (AMRs) at their fulfillment warehouse located in Mexicali, Mexico.
9. What pricing options are available for accessing the report?
Pricing options include single-user, multi-user, and enterprise licenses priced at USD 4750, USD 5250, and USD 8750 respectively.
10. Is the market size provided in terms of value or volume?
The market size is provided in terms of value, measured in Million and volume, measured in K Units.
11. Are there any specific market keywords associated with the report?
Yes, the market keyword associated with the report is "Autonomous Mobile Robots Market For Intralogistics Applications," which aids in identifying and referencing the specific market segment covered.
12. How do I determine which pricing option suits my needs best?
The pricing options vary based on user requirements and access needs. Individual users may opt for single-user licenses, while businesses requiring broader access may choose multi-user or enterprise licenses for cost-effective access to the report.
13. Are there any additional resources or data provided in the Autonomous Mobile Robots Market For Intralogistics Applications report?
While the report offers comprehensive insights, it's advisable to review the specific contents or supplementary materials provided to ascertain if additional resources or data are available.
14. How can I stay updated on further developments or reports in the Autonomous Mobile Robots Market For Intralogistics Applications?
To stay informed about further developments, trends, and reports in the Autonomous Mobile Robots Market For Intralogistics Applications, consider subscribing to industry newsletters, following relevant companies and organizations, or regularly checking reputable industry news sources and publications.
Methodology
Step 1 - Identification of Relevant Samples Size from Population Database


Step 2 - Approaches for Defining Global Market Size (Value, Volume* & Price*)

Note*: In applicable scenarios
Step 3 - Data Sources
Primary Research
- Web Analytics
- Survey Reports
- Research Institute
- Latest Research Reports
- Opinion Leaders
Secondary Research
- Annual Reports
- White Paper
- Latest Press Release
- Industry Association
- Paid Database
- Investor Presentations

Step 4 - Data Triangulation
Involves using different sources of information in order to increase the validity of a study
These sources are likely to be stakeholders in a program - participants, other researchers, program staff, other community members, and so on.
Then we put all data in single framework & apply various statistical tools to find out the dynamic on the market.
During the analysis stage, feedback from the stakeholder groups would be compared to determine areas of agreement as well as areas of divergence


