
Key Insights
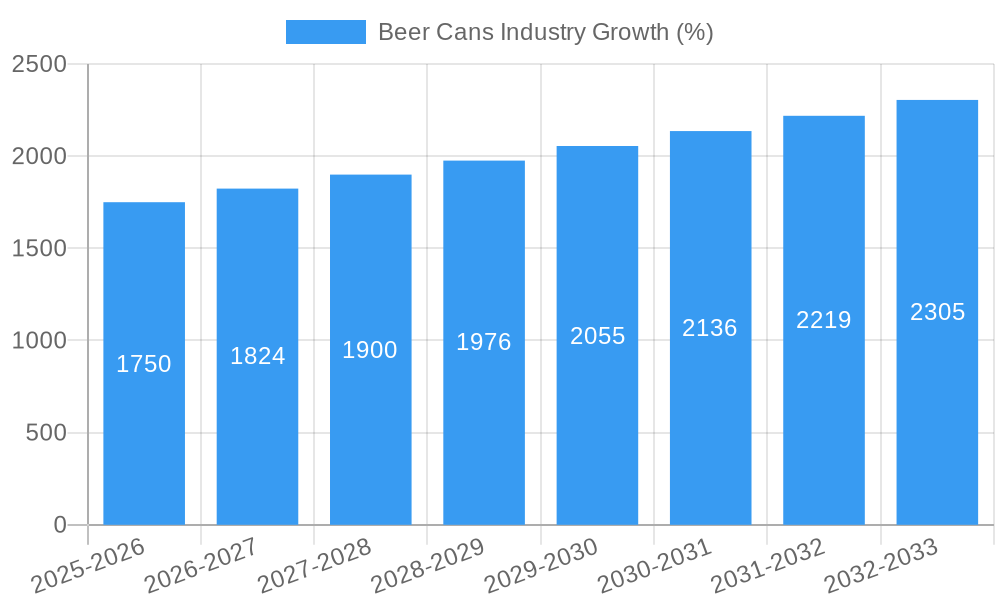
The global beer can market, currently experiencing a 3.50% CAGR, presents a robust growth trajectory projected through 2033. Driven by increasing beer consumption, particularly in emerging economies, and the lightweight, recyclable nature of aluminum and steel cans, the market exhibits strong potential. Consumer preference for convenient, portable packaging fuels demand, while advancements in can design and printing technology enhance brand appeal and shelf life. The market is segmented by product type, primarily aluminum and steel/tin cans, with aluminum cans dominating due to their superior recyclability and cost-effectiveness. Major players, including Toyo Seikan Kaisha Ltd, Ball Corporation, and Crown Holdings Inc., are strategically investing in capacity expansion and technological innovation to meet rising demand. However, fluctuating raw material prices, particularly aluminum, pose a significant challenge, potentially impacting profitability. Furthermore, growing environmental concerns necessitate sustainable manufacturing practices and increased recycling initiatives across the value chain to ensure long-term market stability.
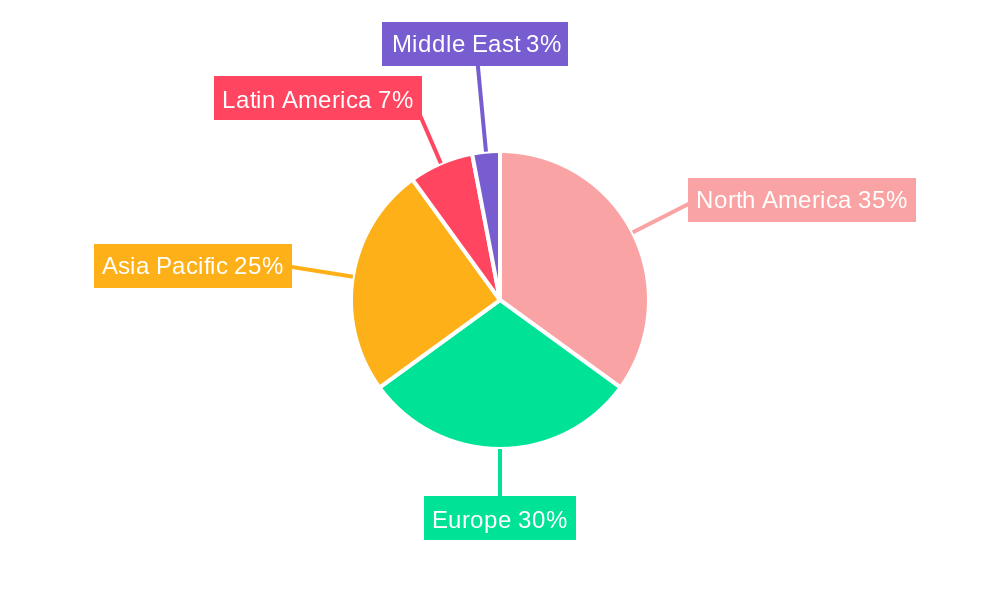
The North American and European markets currently hold significant market share, driven by established beer consumption habits and robust distribution networks. However, the Asia-Pacific region is anticipated to witness the fastest growth due to rising disposable incomes, urbanization, and a burgeoning young adult population with increasing beer consumption. The competitive landscape is characterized by both large multinational corporations and regional players. Successful companies are focusing on differentiation through innovative can designs, sustainable packaging options, and strategic partnerships to secure market share in a dynamic and evolving global landscape. Future growth will be significantly influenced by the adoption of sustainable manufacturing processes, the effectiveness of recycling initiatives, and the response to fluctuating raw material costs. The market's future hinges on adapting to evolving consumer preferences, encompassing a balance between affordability, sustainability, and innovative product packaging.
Beer Cans Industry: A Comprehensive Market Report (2019-2033)
This detailed report provides a comprehensive analysis of the global beer cans industry, encompassing market size, segmentation, growth drivers, challenges, and future opportunities. The study period covers 2019-2033, with 2025 as the base and estimated year. The report leverages extensive primary and secondary research, offering invaluable insights for industry stakeholders, investors, and strategic decision-makers.
Beer Cans Industry Market Concentration & Innovation
The global beer cans industry exhibits a moderately concentrated market structure, with a few major players holding significant market share. While precise market share figures for each company vary and are not consistently publicly available, companies like Ball Corporation, Crown Holdings Inc, and Toyo Seikan Kaisha Ltd. are recognized as leading players, collectively accounting for an estimated xx Million market share in 2024. The industry is characterized by ongoing innovation, driven by several factors:
- Sustainability Initiatives: Increasing consumer demand for eco-friendly packaging fuels innovation in lightweighting, recycled content utilization, and improved recyclability. Recent examples include Ball Corporation's launch of smaller, higher recycled content aluminum cups and Crown Holdings' 4% global average can weight reduction.
- Technological Advancements: Developments in can manufacturing processes, coating technologies, and design capabilities contribute to improved efficiency, reduced costs, and enhanced product appeal.
- Regulatory Frameworks: Government regulations regarding material usage, recyclability, and sustainability influence the industry's innovation trajectory, pushing companies toward more environmentally responsible practices.
- Product Substitutes: While aluminum and steel/tin cans dominate the market, competition from alternative packaging materials like plastic bottles and cartons exists. This necessitates continuous innovation to maintain market share.
- End-User Trends: Shifting consumer preferences, such as the growing popularity of craft beers and premiumization, impact can design, size, and functionality.
- Mergers & Acquisitions (M&A): Consolidation through M&A activities shapes market dynamics, impacting competition and market concentration. While precise M&A deal values are not consistently public, the overall trend shows a significant investment in expanding capacity and market reach. The total value of M&A deals in the industry from 2019-2024 is estimated at approximately xx Million.
Beer Cans Industry Industry Trends & Insights
The global beer cans industry is experiencing robust growth, driven by several key trends:
The Compound Annual Growth Rate (CAGR) for the beer cans industry from 2019 to 2024 is estimated at xx%, while the projected CAGR from 2025 to 2033 is estimated at xx%. This growth is fueled by several factors:
- Rising Beer Consumption: Global beer consumption continues to increase, particularly in emerging markets, creating a strong demand for beer cans as a preferred packaging format.
- Technological Disruptions: Innovations in manufacturing processes and material science drive efficiency improvements and cost reductions, making cans more competitive.
- Consumer Preferences: Consumers increasingly prefer convenient, portable, and resealable packaging, boosting the demand for beer cans.
- Competitive Dynamics: Intense competition among major players drives innovation and efficiency improvements, benefiting consumers and industry growth.
- Market Penetration: The market penetration of beer cans continues to rise, especially in regions where beer consumption is high, further augmenting industry growth. The estimated market penetration rate in 2024 is xx%.
Dominant Markets & Segments in Beer Cans Industry
The North American and European regions are currently the dominant markets for beer cans, driven by high beer consumption levels and well-established distribution networks. However, rapid growth is observed in Asia-Pacific, especially in developing economies, indicating significant future potential.
- Aluminum Cans: This segment holds the largest market share, due to its lightweight, recyclability, and cost-effectiveness. The projected market size for aluminum cans in 2033 is xx Million.
- Steel/Tin Cans: This segment retains a significant market share, with strengths in durability and cost-effectiveness in certain applications. The projected market size for steel/tin cans in 2033 is xx Million.
Key Drivers of Regional Dominance:
- Economic Policies: Favorable economic policies and strong consumer spending are pivotal in regions with high beer consumption.
- Infrastructure: Well-developed infrastructure, including transportation and distribution networks, supports the efficient delivery of beer cans to consumers.
- Consumer Preferences: Regional variations in consumer preferences affect the popularity of beer cans compared to alternative packaging formats.
Beer Cans Industry Product Developments
The beer can industry is witnessing continuous product innovation, including lighter-weight cans, improved coatings for enhanced durability and shelf life, and more creative designs to cater to consumer preferences. Technological advancements in manufacturing, such as high-speed production lines and precision printing techniques, enhance both efficiency and aesthetic appeal. This focus on sustainable and consumer-centric designs ensures market relevance and competitiveness.
Report Scope & Segmentation Analysis
This report segments the beer cans industry by product type:
- Aluminum Cans: This segment is characterized by high growth driven by recyclability and lightweight properties. Competitive dynamics are intense, with key players focusing on innovation and cost optimization.
- Steel/Tin Cans: This segment offers a cost-effective alternative, particularly for certain beer styles. The segment's growth rate is expected to be moderate, driven by price competitiveness in specific niche markets.
Key Drivers of Beer Cans Industry Growth
Several factors contribute to the industry's growth:
- Technological Advancements: Improved manufacturing processes, lightweighting, and enhanced recyclability contribute to efficiency and cost reduction.
- Economic Growth: Rising disposable incomes in developing economies fuel increased beer consumption and packaging demand.
- Favorable Regulations: Supportive government policies promoting sustainable packaging materials contribute to growth.
Challenges in the Beer Cans Industry Sector
The industry faces several challenges:
- Fluctuating Raw Material Prices: Price volatility in aluminum and steel impacts production costs and profitability.
- Supply Chain Disruptions: Global supply chain issues can affect the timely delivery of raw materials and finished products.
- Intense Competition: The highly competitive landscape necessitates continuous innovation and cost optimization to maintain market share.
Emerging Opportunities in Beer Cans Industry
The industry presents several emerging opportunities:
- Sustainable Packaging: Growing consumer demand for eco-friendly packaging creates opportunities for innovative solutions.
- New Markets: Expanding into emerging markets with rising beer consumption offers substantial growth potential.
- Premiumization: Meeting the increasing demand for premium beer varieties with innovative can designs presents lucrative opportunities.
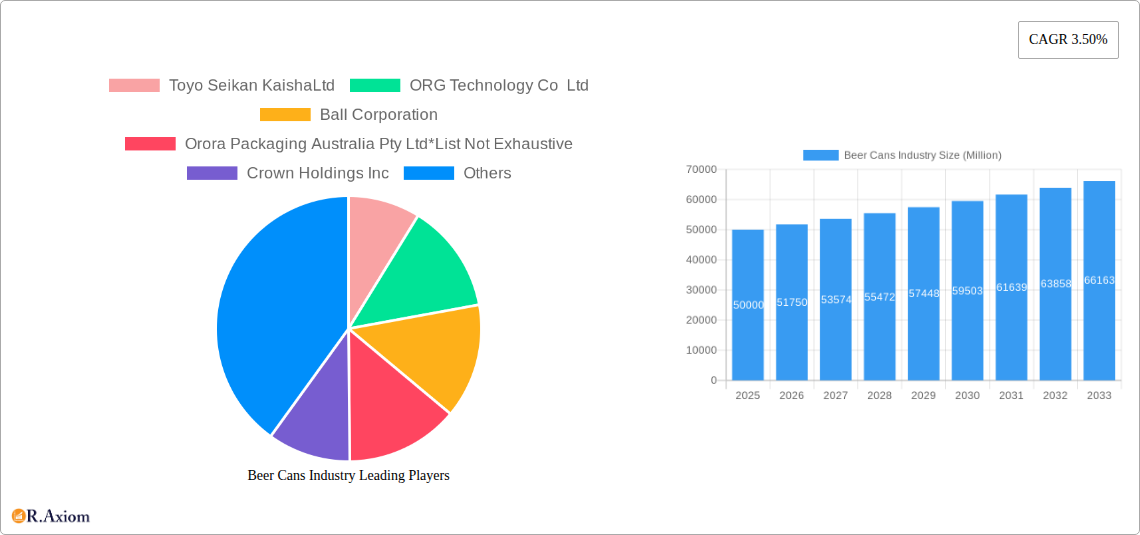
Leading Players in the Beer Cans Industry Market
- Toyo Seikan Kaisha Ltd
- ORG Technology Co Ltd
- Ball Corporation
- Orora Packaging Australia Pty Ltd
- Crown Holdings Inc
- Shenzhen Xin Yuheng Can Co Ltd
- Kaufman Container
- Daiwa Can Co
- Can-Pack S A
Key Developments in Beer Cans Industry Industry
- September 2022: Crown Holdings, Inc. announced a 4% global average reduction in standard 12 oz. can weight, enhancing sustainability and reducing GHG emissions.
- October 2022: Ball Corporation expanded its infinitely recyclable aluminum cup portfolio with two new smaller sizes (9-ounce and 12-ounce), featuring 90% recycled content.
Strategic Outlook for Beer Cans Industry Market
The beer cans industry is poised for continued growth, driven by increasing beer consumption, technological advancements, and a focus on sustainability. Emerging markets and the growing demand for premium products present significant opportunities. The industry's future success hinges on continuous innovation, efficient operations, and proactive adaptation to evolving consumer preferences and regulatory landscapes.
Beer Cans Industry Segmentation
-
1. Product Type
- 1.1. Aluminum Can
- 1.2. Steel/Tin Can
Beer Cans Industry Segmentation By Geography
-
1. North America
- 1.1. United States
- 1.2. Canada
-
2. Europe
- 2.1. Germany
- 2.2. France
- 2.3. United Kingdom
- 2.4. Spain
- 2.5. Rest of Europe
-
3. Asia Pacific
- 3.1. China
- 3.2. Japan
- 3.3. India
- 3.4. Australia
- 3.5. Rest of Asia Pacific
-
4. Latin America
- 4.1. Brazil
- 4.2. Rest of Latin America
- 5. Middle East
Beer Cans Industry REPORT HIGHLIGHTS
| Aspects | Details |
|---|---|
| Study Period | 2019-2033 |
| Base Year | 2024 |
| Estimated Year | 2025 |
| Forecast Period | 2025-2033 |
| Historical Period | 2019-2024 |
| Growth Rate | CAGR of 3.50% from 2019-2033 |
| Segmentation |
|
Table of Contents
- 1. Introduction
- 1.1. Research Scope
- 1.2. Market Segmentation
- 1.3. Research Methodology
- 1.4. Definitions and Assumptions
- 2. Executive Summary
- 2.1. Introduction
- 3. Market Dynamics
- 3.1. Introduction
- 3.2. Market Drivers
- 3.2.1. Growing Consumption of Craft Beer Across Various Regions; Recreational and Environmental Benefits
- 3.3. Market Restrains
- 3.3.1. Changing Consumer Preferences
- 3.4. Market Trends
- 3.4.1. Aluminium is Expected to Hold the Largest Market Share
- 4. Market Factor Analysis
- 4.1. Porters Five Forces
- 4.2. Supply/Value Chain
- 4.3. PESTEL analysis
- 4.4. Market Entropy
- 4.5. Patent/Trademark Analysis
- 5. Global Beer Cans Industry Analysis, Insights and Forecast, 2019-2031
- 5.1. Market Analysis, Insights and Forecast - by Product Type
- 5.1.1. Aluminum Can
- 5.1.2. Steel/Tin Can
- 5.2. Market Analysis, Insights and Forecast - by Region
- 5.2.1. North America
- 5.2.2. Europe
- 5.2.3. Asia Pacific
- 5.2.4. Latin America
- 5.2.5. Middle East
- 5.1. Market Analysis, Insights and Forecast - by Product Type
- 6. North America Beer Cans Industry Analysis, Insights and Forecast, 2019-2031
- 6.1. Market Analysis, Insights and Forecast - by Product Type
- 6.1.1. Aluminum Can
- 6.1.2. Steel/Tin Can
- 6.1. Market Analysis, Insights and Forecast - by Product Type
- 7. Europe Beer Cans Industry Analysis, Insights and Forecast, 2019-2031
- 7.1. Market Analysis, Insights and Forecast - by Product Type
- 7.1.1. Aluminum Can
- 7.1.2. Steel/Tin Can
- 7.1. Market Analysis, Insights and Forecast - by Product Type
- 8. Asia Pacific Beer Cans Industry Analysis, Insights and Forecast, 2019-2031
- 8.1. Market Analysis, Insights and Forecast - by Product Type
- 8.1.1. Aluminum Can
- 8.1.2. Steel/Tin Can
- 8.1. Market Analysis, Insights and Forecast - by Product Type
- 9. Latin America Beer Cans Industry Analysis, Insights and Forecast, 2019-2031
- 9.1. Market Analysis, Insights and Forecast - by Product Type
- 9.1.1. Aluminum Can
- 9.1.2. Steel/Tin Can
- 9.1. Market Analysis, Insights and Forecast - by Product Type
- 10. Middle East Beer Cans Industry Analysis, Insights and Forecast, 2019-2031
- 10.1. Market Analysis, Insights and Forecast - by Product Type
- 10.1.1. Aluminum Can
- 10.1.2. Steel/Tin Can
- 10.1. Market Analysis, Insights and Forecast - by Product Type
- 11. North America Beer Cans Industry Analysis, Insights and Forecast, 2019-2031
- 11.1. Market Analysis, Insights and Forecast - By Country/Sub-region
- 11.1.1 United States
- 11.1.2 Canada
- 12. Europe Beer Cans Industry Analysis, Insights and Forecast, 2019-2031
- 12.1. Market Analysis, Insights and Forecast - By Country/Sub-region
- 12.1.1 Germany
- 12.1.2 France
- 12.1.3 United Kingdom
- 12.1.4 Spain
- 12.1.5 Rest of Europe
- 13. Asia Pacific Beer Cans Industry Analysis, Insights and Forecast, 2019-2031
- 13.1. Market Analysis, Insights and Forecast - By Country/Sub-region
- 13.1.1 China
- 13.1.2 Japan
- 13.1.3 India
- 13.1.4 Australia
- 13.1.5 Rest of Asia Pacific
- 14. Latin America Beer Cans Industry Analysis, Insights and Forecast, 2019-2031
- 14.1. Market Analysis, Insights and Forecast - By Country/Sub-region
- 14.1.1 Brazil
- 14.1.2 Rest of Latin America
- 15. Middle East Beer Cans Industry Analysis, Insights and Forecast, 2019-2031
- 15.1. Market Analysis, Insights and Forecast - By Country/Sub-region
- 15.1.1.
- 16. Competitive Analysis
- 16.1. Global Market Share Analysis 2024
- 16.2. Company Profiles
- 16.2.1 Toyo Seikan KaishaLtd
- 16.2.1.1. Overview
- 16.2.1.2. Products
- 16.2.1.3. SWOT Analysis
- 16.2.1.4. Recent Developments
- 16.2.1.5. Financials (Based on Availability)
- 16.2.2 ORG Technology Co Ltd
- 16.2.2.1. Overview
- 16.2.2.2. Products
- 16.2.2.3. SWOT Analysis
- 16.2.2.4. Recent Developments
- 16.2.2.5. Financials (Based on Availability)
- 16.2.3 Ball Corporation
- 16.2.3.1. Overview
- 16.2.3.2. Products
- 16.2.3.3. SWOT Analysis
- 16.2.3.4. Recent Developments
- 16.2.3.5. Financials (Based on Availability)
- 16.2.4 Orora Packaging Australia Pty Ltd*List Not Exhaustive
- 16.2.4.1. Overview
- 16.2.4.2. Products
- 16.2.4.3. SWOT Analysis
- 16.2.4.4. Recent Developments
- 16.2.4.5. Financials (Based on Availability)
- 16.2.5 Crown Holdings Inc
- 16.2.5.1. Overview
- 16.2.5.2. Products
- 16.2.5.3. SWOT Analysis
- 16.2.5.4. Recent Developments
- 16.2.5.5. Financials (Based on Availability)
- 16.2.6 Shenzhen Xin Yuheng Can Co Ltd
- 16.2.6.1. Overview
- 16.2.6.2. Products
- 16.2.6.3. SWOT Analysis
- 16.2.6.4. Recent Developments
- 16.2.6.5. Financials (Based on Availability)
- 16.2.7 Kaufman Container
- 16.2.7.1. Overview
- 16.2.7.2. Products
- 16.2.7.3. SWOT Analysis
- 16.2.7.4. Recent Developments
- 16.2.7.5. Financials (Based on Availability)
- 16.2.8 Daiwa Can Co
- 16.2.8.1. Overview
- 16.2.8.2. Products
- 16.2.8.3. SWOT Analysis
- 16.2.8.4. Recent Developments
- 16.2.8.5. Financials (Based on Availability)
- 16.2.9 Can-Pack S A
- 16.2.9.1. Overview
- 16.2.9.2. Products
- 16.2.9.3. SWOT Analysis
- 16.2.9.4. Recent Developments
- 16.2.9.5. Financials (Based on Availability)
- 16.2.1 Toyo Seikan KaishaLtd
List of Figures
- Figure 1: Global Beer Cans Industry Revenue Breakdown (Million, %) by Region 2024 & 2032
- Figure 2: North America Beer Cans Industry Revenue (Million), by Country 2024 & 2032
- Figure 3: North America Beer Cans Industry Revenue Share (%), by Country 2024 & 2032
- Figure 4: Europe Beer Cans Industry Revenue (Million), by Country 2024 & 2032
- Figure 5: Europe Beer Cans Industry Revenue Share (%), by Country 2024 & 2032
- Figure 6: Asia Pacific Beer Cans Industry Revenue (Million), by Country 2024 & 2032
- Figure 7: Asia Pacific Beer Cans Industry Revenue Share (%), by Country 2024 & 2032
- Figure 8: Latin America Beer Cans Industry Revenue (Million), by Country 2024 & 2032
- Figure 9: Latin America Beer Cans Industry Revenue Share (%), by Country 2024 & 2032
- Figure 10: Middle East Beer Cans Industry Revenue (Million), by Country 2024 & 2032
- Figure 11: Middle East Beer Cans Industry Revenue Share (%), by Country 2024 & 2032
- Figure 12: North America Beer Cans Industry Revenue (Million), by Product Type 2024 & 2032
- Figure 13: North America Beer Cans Industry Revenue Share (%), by Product Type 2024 & 2032
- Figure 14: North America Beer Cans Industry Revenue (Million), by Country 2024 & 2032
- Figure 15: North America Beer Cans Industry Revenue Share (%), by Country 2024 & 2032
- Figure 16: Europe Beer Cans Industry Revenue (Million), by Product Type 2024 & 2032
- Figure 17: Europe Beer Cans Industry Revenue Share (%), by Product Type 2024 & 2032
- Figure 18: Europe Beer Cans Industry Revenue (Million), by Country 2024 & 2032
- Figure 19: Europe Beer Cans Industry Revenue Share (%), by Country 2024 & 2032
- Figure 20: Asia Pacific Beer Cans Industry Revenue (Million), by Product Type 2024 & 2032
- Figure 21: Asia Pacific Beer Cans Industry Revenue Share (%), by Product Type 2024 & 2032
- Figure 22: Asia Pacific Beer Cans Industry Revenue (Million), by Country 2024 & 2032
- Figure 23: Asia Pacific Beer Cans Industry Revenue Share (%), by Country 2024 & 2032
- Figure 24: Latin America Beer Cans Industry Revenue (Million), by Product Type 2024 & 2032
- Figure 25: Latin America Beer Cans Industry Revenue Share (%), by Product Type 2024 & 2032
- Figure 26: Latin America Beer Cans Industry Revenue (Million), by Country 2024 & 2032
- Figure 27: Latin America Beer Cans Industry Revenue Share (%), by Country 2024 & 2032
- Figure 28: Middle East Beer Cans Industry Revenue (Million), by Product Type 2024 & 2032
- Figure 29: Middle East Beer Cans Industry Revenue Share (%), by Product Type 2024 & 2032
- Figure 30: Middle East Beer Cans Industry Revenue (Million), by Country 2024 & 2032
- Figure 31: Middle East Beer Cans Industry Revenue Share (%), by Country 2024 & 2032
List of Tables
- Table 1: Global Beer Cans Industry Revenue Million Forecast, by Region 2019 & 2032
- Table 2: Global Beer Cans Industry Revenue Million Forecast, by Product Type 2019 & 2032
- Table 3: Global Beer Cans Industry Revenue Million Forecast, by Region 2019 & 2032
- Table 4: Global Beer Cans Industry Revenue Million Forecast, by Country 2019 & 2032
- Table 5: United States Beer Cans Industry Revenue (Million) Forecast, by Application 2019 & 2032
- Table 6: Canada Beer Cans Industry Revenue (Million) Forecast, by Application 2019 & 2032
- Table 7: Global Beer Cans Industry Revenue Million Forecast, by Country 2019 & 2032
- Table 8: Germany Beer Cans Industry Revenue (Million) Forecast, by Application 2019 & 2032
- Table 9: France Beer Cans Industry Revenue (Million) Forecast, by Application 2019 & 2032
- Table 10: United Kingdom Beer Cans Industry Revenue (Million) Forecast, by Application 2019 & 2032
- Table 11: Spain Beer Cans Industry Revenue (Million) Forecast, by Application 2019 & 2032
- Table 12: Rest of Europe Beer Cans Industry Revenue (Million) Forecast, by Application 2019 & 2032
- Table 13: Global Beer Cans Industry Revenue Million Forecast, by Country 2019 & 2032
- Table 14: China Beer Cans Industry Revenue (Million) Forecast, by Application 2019 & 2032
- Table 15: Japan Beer Cans Industry Revenue (Million) Forecast, by Application 2019 & 2032
- Table 16: India Beer Cans Industry Revenue (Million) Forecast, by Application 2019 & 2032
- Table 17: Australia Beer Cans Industry Revenue (Million) Forecast, by Application 2019 & 2032
- Table 18: Rest of Asia Pacific Beer Cans Industry Revenue (Million) Forecast, by Application 2019 & 2032
- Table 19: Global Beer Cans Industry Revenue Million Forecast, by Country 2019 & 2032
- Table 20: Brazil Beer Cans Industry Revenue (Million) Forecast, by Application 2019 & 2032
- Table 21: Rest of Latin America Beer Cans Industry Revenue (Million) Forecast, by Application 2019 & 2032
- Table 22: Global Beer Cans Industry Revenue Million Forecast, by Country 2019 & 2032
- Table 23: Beer Cans Industry Revenue (Million) Forecast, by Application 2019 & 2032
- Table 24: Global Beer Cans Industry Revenue Million Forecast, by Product Type 2019 & 2032
- Table 25: Global Beer Cans Industry Revenue Million Forecast, by Country 2019 & 2032
- Table 26: United States Beer Cans Industry Revenue (Million) Forecast, by Application 2019 & 2032
- Table 27: Canada Beer Cans Industry Revenue (Million) Forecast, by Application 2019 & 2032
- Table 28: Global Beer Cans Industry Revenue Million Forecast, by Product Type 2019 & 2032
- Table 29: Global Beer Cans Industry Revenue Million Forecast, by Country 2019 & 2032
- Table 30: Germany Beer Cans Industry Revenue (Million) Forecast, by Application 2019 & 2032
- Table 31: France Beer Cans Industry Revenue (Million) Forecast, by Application 2019 & 2032
- Table 32: United Kingdom Beer Cans Industry Revenue (Million) Forecast, by Application 2019 & 2032
- Table 33: Spain Beer Cans Industry Revenue (Million) Forecast, by Application 2019 & 2032
- Table 34: Rest of Europe Beer Cans Industry Revenue (Million) Forecast, by Application 2019 & 2032
- Table 35: Global Beer Cans Industry Revenue Million Forecast, by Product Type 2019 & 2032
- Table 36: Global Beer Cans Industry Revenue Million Forecast, by Country 2019 & 2032
- Table 37: China Beer Cans Industry Revenue (Million) Forecast, by Application 2019 & 2032
- Table 38: Japan Beer Cans Industry Revenue (Million) Forecast, by Application 2019 & 2032
- Table 39: India Beer Cans Industry Revenue (Million) Forecast, by Application 2019 & 2032
- Table 40: Australia Beer Cans Industry Revenue (Million) Forecast, by Application 2019 & 2032
- Table 41: Rest of Asia Pacific Beer Cans Industry Revenue (Million) Forecast, by Application 2019 & 2032
- Table 42: Global Beer Cans Industry Revenue Million Forecast, by Product Type 2019 & 2032
- Table 43: Global Beer Cans Industry Revenue Million Forecast, by Country 2019 & 2032
- Table 44: Brazil Beer Cans Industry Revenue (Million) Forecast, by Application 2019 & 2032
- Table 45: Rest of Latin America Beer Cans Industry Revenue (Million) Forecast, by Application 2019 & 2032
- Table 46: Global Beer Cans Industry Revenue Million Forecast, by Product Type 2019 & 2032
- Table 47: Global Beer Cans Industry Revenue Million Forecast, by Country 2019 & 2032
Frequently Asked Questions
1. What is the projected Compound Annual Growth Rate (CAGR) of the Beer Cans Industry?
The projected CAGR is approximately 3.50%.
2. Which companies are prominent players in the Beer Cans Industry?
Key companies in the market include Toyo Seikan KaishaLtd, ORG Technology Co Ltd, Ball Corporation, Orora Packaging Australia Pty Ltd*List Not Exhaustive, Crown Holdings Inc, Shenzhen Xin Yuheng Can Co Ltd, Kaufman Container, Daiwa Can Co, Can-Pack S A.
3. What are the main segments of the Beer Cans Industry?
The market segments include Product Type.
4. Can you provide details about the market size?
The market size is estimated to be USD XX Million as of 2022.
5. What are some drivers contributing to market growth?
Growing Consumption of Craft Beer Across Various Regions; Recreational and Environmental Benefits.
6. What are the notable trends driving market growth?
Aluminium is Expected to Hold the Largest Market Share.
7. Are there any restraints impacting market growth?
Changing Consumer Preferences.
8. Can you provide examples of recent developments in the market?
October 2022 - Ball Corporation announced the portfolio expansion of its infinitely recyclable ball aluminum cup with the launch of two new, smaller sizes (9-ounce and 12-ounce cup sizes). The Ball Aluminum Cup available for food service customers is now composed of 90% recycled content, making it the cup with the highest recycled content rate of any beverage packaging in its category.
9. What pricing options are available for accessing the report?
Pricing options include single-user, multi-user, and enterprise licenses priced at USD 4750, USD 5250, and USD 8750 respectively.
10. Is the market size provided in terms of value or volume?
The market size is provided in terms of value, measured in Million.
11. Are there any specific market keywords associated with the report?
Yes, the market keyword associated with the report is "Beer Cans Industry," which aids in identifying and referencing the specific market segment covered.
12. How do I determine which pricing option suits my needs best?
The pricing options vary based on user requirements and access needs. Individual users may opt for single-user licenses, while businesses requiring broader access may choose multi-user or enterprise licenses for cost-effective access to the report.
13. Are there any additional resources or data provided in the Beer Cans Industry report?
While the report offers comprehensive insights, it's advisable to review the specific contents or supplementary materials provided to ascertain if additional resources or data are available.
14. How can I stay updated on further developments or reports in the Beer Cans Industry?
To stay informed about further developments, trends, and reports in the Beer Cans Industry, consider subscribing to industry newsletters, following relevant companies and organizations, or regularly checking reputable industry news sources and publications.
Methodology
Step 1 - Identification of Relevant Samples Size from Population Database


Step 2 - Approaches for Defining Global Market Size (Value, Volume* & Price*)

Note*: In applicable scenarios
Step 3 - Data Sources
Primary Research
- Web Analytics
- Survey Reports
- Research Institute
- Latest Research Reports
- Opinion Leaders
Secondary Research
- Annual Reports
- White Paper
- Latest Press Release
- Industry Association
- Paid Database
- Investor Presentations

Step 4 - Data Triangulation
Involves using different sources of information in order to increase the validity of a study
These sources are likely to be stakeholders in a program - participants, other researchers, program staff, other community members, and so on.
Then we put all data in single framework & apply various statistical tools to find out the dynamic on the market.
During the analysis stage, feedback from the stakeholder groups would be compared to determine areas of agreement as well as areas of divergence


