

Key Insights
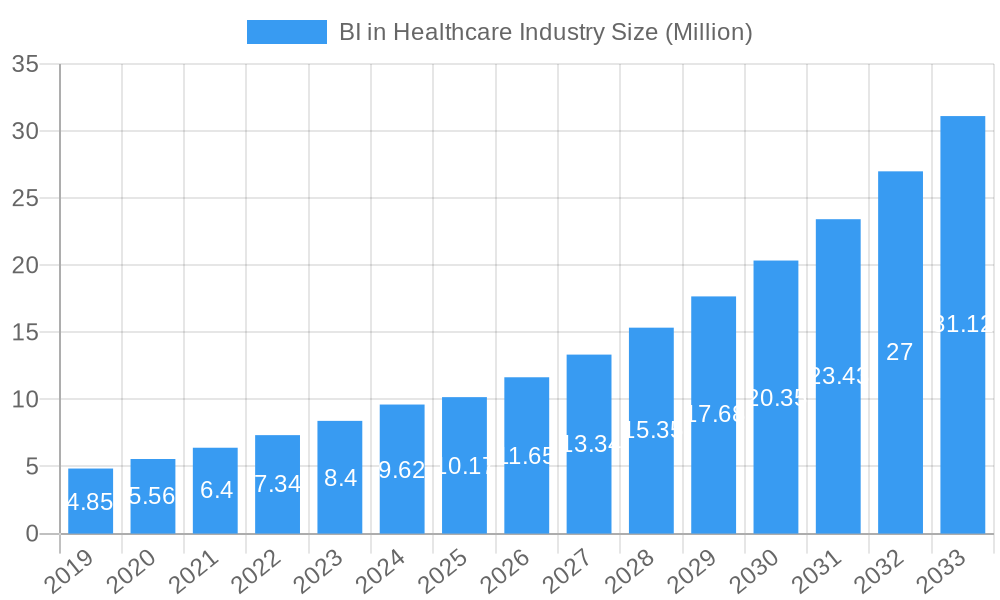
The Business Intelligence (BI) in Healthcare market is poised for substantial growth, projected to reach $10.17 Million by 2025, exhibiting a robust 14.41% CAGR over the forecast period. This expansion is primarily fueled by the increasing need for efficient data management and analysis within the healthcare sector to improve patient outcomes, streamline operations, and reduce costs. Key drivers include the growing adoption of electronic health records (EHRs), the proliferation of healthcare data from various sources like wearables and IoT devices, and the pressing demand for predictive analytics to identify disease outbreaks and personalize treatment plans. Furthermore, regulatory compliance mandates and the push towards value-based care are compelling healthcare organizations to invest in sophisticated BI solutions. The market is segmented across components, with both Software and Services playing crucial roles in delivering comprehensive analytics. Delivery modes are evolving, with a notable shift towards Cloud-based models due to their scalability, flexibility, and cost-effectiveness, though Hybrid and On-premise models still hold relevance for certain segments.
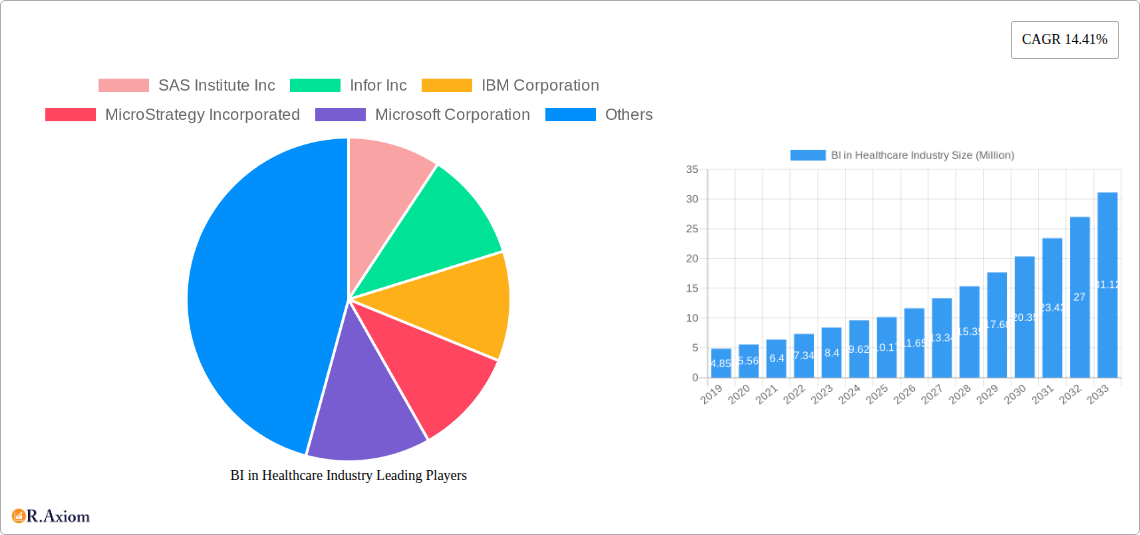
BI in Healthcare Industry Market Size (In Million)
The application spectrum of BI in Healthcare is broad and impactful, encompassing critical areas such as Financial Analysis for revenue cycle management and cost optimization, Clinical Data Analysis for research and evidence-based medicine, and Patient Care Analysis for improving treatment efficacy and patient satisfaction. These applications directly benefit healthcare providers and payers, enabling them to make informed decisions, identify areas for improvement, and enhance the overall quality of care delivery. The competitive landscape is characterized by the presence of major technology players and specialized healthcare analytics firms, all vying to offer advanced solutions that address the unique challenges of the healthcare industry. Emerging trends like the integration of AI and machine learning into BI platforms, the rise of real-time analytics, and the focus on data visualization for user-friendly insights will further shape market dynamics and drive innovation in the coming years.
BI in Healthcare Industry Company Market Share
This comprehensive market research report provides an in-depth analysis of the Business Intelligence (BI) in the Healthcare Industry market, offering actionable insights for stakeholders to navigate this dynamic and rapidly evolving sector. With a study period spanning from 2019 to 2033, including a base year of 2025 and a forecast period from 2025 to 2033, this report delivers critical data and expert analysis to inform strategic decision-making. The market is experiencing significant growth, driven by the increasing demand for data analytics to improve patient outcomes, optimize operational efficiency, and reduce healthcare costs.
The report delves into the intricate workings of the BI in Healthcare Industry market, covering everything from market concentration and innovation drivers to dominant segments and emerging opportunities. We analyze the impact of technological advancements, regulatory shifts, and evolving end-user preferences on the market landscape. With a focus on high-traffic keywords such as "healthcare analytics," "clinical data solutions," "payer analytics," "provider BI," and "healthcare IT innovation," this report ensures maximum visibility and engagement for industry professionals.
BI in Healthcare Industry Market Concentration & Innovation
The BI in Healthcare Industry market exhibits a moderate to high level of concentration, with several key players dominating the landscape through strategic acquisitions and continuous product innovation. Major companies like SAS Institute Inc., IBM Corporation, Microsoft Corporation, and Oracle Corporation are at the forefront, leveraging their extensive resources and established market presence. Innovation is a primary driver, fueled by advancements in artificial intelligence (AI), machine learning (ML), and cloud computing, enabling more sophisticated data analysis and predictive capabilities. Regulatory frameworks, such as HIPAA and GDPR, play a crucial role in shaping data security and privacy measures, influencing product development and market entry strategies. While direct product substitutes are limited, the integration of BI functionalities into broader healthcare IT platforms poses a competitive challenge. End-user trends indicate a growing demand for personalized patient care analytics and financial transparency. M&A activities are significant, with deal values often in the hundreds of millions to billions of dollars, as larger corporations seek to expand their offerings and market reach. For instance, the acquisition of Cerner Corporation by Oracle Corporation for an estimated $28.3 billion underscores the consolidation trend.
BI in Healthcare Industry Industry Trends & Insights
The BI in Healthcare Industry market is poised for substantial growth, projected to achieve a Compound Annual Growth Rate (CAGR) of approximately 12.5% during the forecast period. This expansion is primarily propelled by the escalating need for data-driven decision-making across all facets of healthcare. Technological disruptions, including the proliferation of Electronic Health Records (EHRs), the rise of the Internet of Medical Things (IoMT), and the increasing adoption of AI and ML algorithms, are fundamental growth drivers. These technologies generate vast amounts of data that require sophisticated BI solutions for effective analysis and interpretation. Consumer preferences are shifting towards value-based care and personalized medicine, necessitating BI tools that can identify patient cohorts, predict health risks, and personalize treatment plans. Competitive dynamics are intensifying, with companies investing heavily in R&D to offer advanced analytics, predictive modeling, and real-time insights. Market penetration is steadily increasing as more healthcare organizations recognize the ROI of BI implementations, leading to improved operational efficiencies, reduced readmission rates, and enhanced patient satisfaction. The global market size for BI in Healthcare is estimated to reach approximately $35.2 billion by 2025, with projections indicating a significant surge to over $70 billion by 2033.
Dominant Markets & Segments in BI in Healthcare Industry
The BI in Healthcare Industry market is characterized by distinct dominant segments that are shaping its trajectory.
- Component: The Software segment holds a commanding market share, estimated to be over 65% in 2025, due to the increasing demand for advanced analytics platforms, data warehousing solutions, and specialized healthcare BI applications. Services, including implementation, consulting, and support, represent a significant and growing portion, estimated at around 35%.
- Mode of Delivery: The Cloud-based Model is the fastest-growing delivery mode, expected to capture over 55% of the market by 2025. Its scalability, cost-effectiveness, and ease of deployment make it highly attractive to healthcare organizations. The Hybrid Model is also gaining traction, offering flexibility, while the On-premise Model, though declining, still holds a considerable share, particularly among larger institutions with existing infrastructure and stringent data security requirements.
- Application: Clinical Data Analysis is the largest application segment, accounting for an estimated 45% of the market in 2025. This is driven by the critical need to analyze patient data for improved diagnosis, treatment, and outcomes. Financial Analysis follows closely, with an estimated 30% share, as organizations seek to optimize revenue cycles and control costs. Patient Care Analysis and Other Applications, such as operational efficiency and population health management, collectively contribute the remaining market share.
- End User: Healthcare Providers represent the largest end-user segment, comprising over 60% of the market in 2025. This includes hospitals, clinics, and physician groups that directly leverage BI for clinical and operational improvements. Payers, including insurance companies, constitute approximately 30% of the market, utilizing BI for risk assessment, fraud detection, and member engagement. Other End Users, such as pharmaceutical companies and research institutions, make up the remaining 10%.
BI in Healthcare Industry Product Developments
Product developments in the BI in Healthcare Industry are focused on delivering more intuitive, predictive, and integrated solutions. Companies are increasingly embedding AI and ML capabilities into their platforms to offer advanced predictive analytics for patient readmissions, disease outbreaks, and resource allocation. The emphasis is on creating vendor-agnostic platforms that can seamlessly integrate with diverse healthcare IT ecosystems, ensuring comprehensive data utilization. Key competitive advantages are being built around real-time data processing, enhanced data visualization, and specialized modules for financial management, clinical decision support, and population health. The trend towards self-service BI tools empowers healthcare professionals to derive insights directly, reducing reliance on IT departments and accelerating the adoption of data-driven strategies.
Report Scope & Segmentation Analysis
This report meticulously segments the BI in Healthcare Industry market across several key dimensions.
- Component: The market is analyzed into Software (analytics platforms, data visualization tools, data warehousing solutions) and Services (implementation, consulting, training, maintenance). The Software segment is projected to dominate, with an estimated market size of $22.5 Billion in 2025, while Services are expected to grow at a CAGR of 13% to reach $12.7 Billion.
- Mode of Delivery: Segments include On-premise Model, Hybrid Model, and Cloud-based Model. The Cloud-based Model is anticipated to experience the highest growth, driven by its scalability and agility, reaching an estimated market size of $19.3 Billion by 2033.
- Application: Analysis covers Financial Analysis, Clinical Data Analysis, Patient Care Analysis, and Other Applications (e.g., operational efficiency, population health). Clinical Data Analysis is expected to maintain its leadership, with an estimated market size of $15.8 Billion in 2025.
- End User: Key segments are Payers, Healthcare Providers, and Other End Users. Healthcare Providers are projected to be the largest segment, with an estimated market size of $22.1 Billion in 2025, due to their direct need for operational and clinical insights.
Key Drivers of BI in Healthcare Industry Growth
Several key factors are propelling the growth of the BI in Healthcare Industry.
- Technological Advancements: The rapid evolution of AI, ML, big data analytics, and cloud computing provides the foundational technology for sophisticated BI solutions.
- Increasing Data Volume: The digitization of healthcare records, IoMT devices, and genomic sequencing generates massive datasets that require robust BI tools for meaningful interpretation.
- Focus on Value-Based Care: The shift towards value-based reimbursement models necessitates BI for performance measurement, cost optimization, and quality improvement.
- Regulatory Mandates: Government initiatives promoting data interoperability and health information exchange encourage the adoption of BI solutions to meet compliance and reporting requirements.
- Demand for Improved Patient Outcomes: BI enables healthcare providers to gain deeper insights into patient populations, personalize treatments, and predict health risks, ultimately leading to better patient care.
Challenges in the BI in Healthcare Industry Sector
Despite robust growth, the BI in Healthcare Industry faces several challenges.
- Data Silos and Interoperability: Fragmented data sources across different healthcare systems hinder comprehensive analysis and require significant effort to integrate.
- Data Security and Privacy Concerns: Stringent regulations and the sensitive nature of health data necessitate advanced security measures, increasing implementation costs and complexity.
- Skill Gap: A shortage of skilled data scientists and analysts proficient in healthcare analytics can slow down the adoption and effective utilization of BI solutions.
- High Implementation Costs: The initial investment in BI software, hardware, and professional services can be substantial, posing a barrier for smaller healthcare organizations.
- Resistance to Change: Overcoming organizational inertia and fostering a data-driven culture within healthcare institutions can be a significant challenge.
Emerging Opportunities in BI in Healthcare Industry
The BI in Healthcare Industry presents numerous emerging opportunities for growth and innovation.
- Predictive Analytics for Preventative Care: Leveraging AI and ML to predict disease outbreaks, identify high-risk patients, and enable proactive interventions.
- Personalized Medicine and Genomics: Analyzing genomic data alongside clinical information to tailor treatments for individual patients.
- Population Health Management: Utilizing BI to monitor and improve the health outcomes of specific patient populations, reducing the burden on healthcare systems.
- AI-Powered Clinical Decision Support: Integrating AI into BI platforms to provide real-time, evidence-based recommendations to clinicians.
- Enhanced Patient Engagement Tools: Developing BI solutions that empower patients with access to their health data and personalized insights, fostering active participation in their care.
Leading Players in the BI in Healthcare Industry Market
- SAS Institute Inc.
- Infor Inc.
- IBM Corporation
- MicroStrategy Incorporated
- Microsoft Corporation
- CareCloud Inc.
- EPIC SYSTEMS
- QlikTech International AB
- Information Builders
- Oracle Corporation
- Salesforce
- Sisense Inc.
- Domo Inc.
- SAP SE
Key Developments in BI in Healthcare Industry Industry
- Jun 2022: Oracle Corporation completed the acquisition of Cerner Corporation, a supplier of health information technology services, for an estimated $28.3 billion, significantly bolstering Oracle's presence in the healthcare IT market.
- Jan 2022: PINC AI, the technology and services platform of Premier Inc., launched INsights, an enhanced self-service healthcare solution to create customized, on-demand analytics. INsights is a vendor-agnostic analytics platform that accesses PINC AI's cleansed, standardized, and risk-adjusted healthcare data, covering more than 45% of all US hospital inpatient discharges.
- Jan 2022: CareCloud Inc., one of the leaders in healthcare technology solutions for medical practices and health systems nationwide, announced the launch of its abridged business intelligence platform, PrecisionBI Lite (PBI Lite), to expand the company's addressable market and extend powerful, financial analytics and business insights to small, independent practices.
Strategic Outlook for BI in Healthcare Industry Market
The strategic outlook for the BI in Healthcare Industry market is exceptionally positive, driven by an ongoing digital transformation within the sector. Future growth will be catalyzed by the continued integration of AI and ML for predictive and prescriptive analytics, enabling healthcare organizations to move from reactive to proactive care models. The increasing emphasis on value-based care and personalized medicine will further fuel demand for sophisticated BI solutions. Furthermore, strategic partnerships and collaborations between technology providers and healthcare institutions will be crucial for developing tailored solutions that address specific clinical and operational challenges. The expansion of cloud-based BI offerings will democratize access to powerful analytics, particularly for smaller practices and providers, driving market penetration and fostering innovation across the entire healthcare ecosystem. The market is set to experience sustained growth, with opportunities arising from emerging technologies and evolving patient expectations.
BI in Healthcare Industry Segmentation
-
1. Component
- 1.1. Software
- 1.2. Services
-
2. Mode of Delivery
- 2.1. On-premise Model
- 2.2. Hybrid Model
- 2.3. Cloud-based Model
-
3. Application
- 3.1. Financial Analysis
- 3.2. Clinical Data Analysis
- 3.3. Patient Care Analysis
- 3.4. Other Applications
-
4. End User
- 4.1. Payers
- 4.2. Healthcare Providers
- 4.3. Other End Users
BI in Healthcare Industry Segmentation By Geography
-
1. North America
- 1.1. United States
- 1.2. Canada
- 1.3. Mexico
-
2. Europe
- 2.1. Germany
- 2.2. United Kingdom
- 2.3. France
- 2.4. Italy
- 2.5. Spain
- 2.6. Rest of Europe
-
3. Asia Pacific
- 3.1. China
- 3.2. Japan
- 3.3. India
- 3.4. Australia
- 3.5. South Korea
- 3.6. Rest of Asia Pacific
-
4. Middle East and Africa
- 4.1. GCC
- 4.2. South Africa
- 4.3. Rest of Middle East and Africa
-
5. South America
- 5.1. Brazil
- 5.2. Argentina
- 5.3. Rest of South America
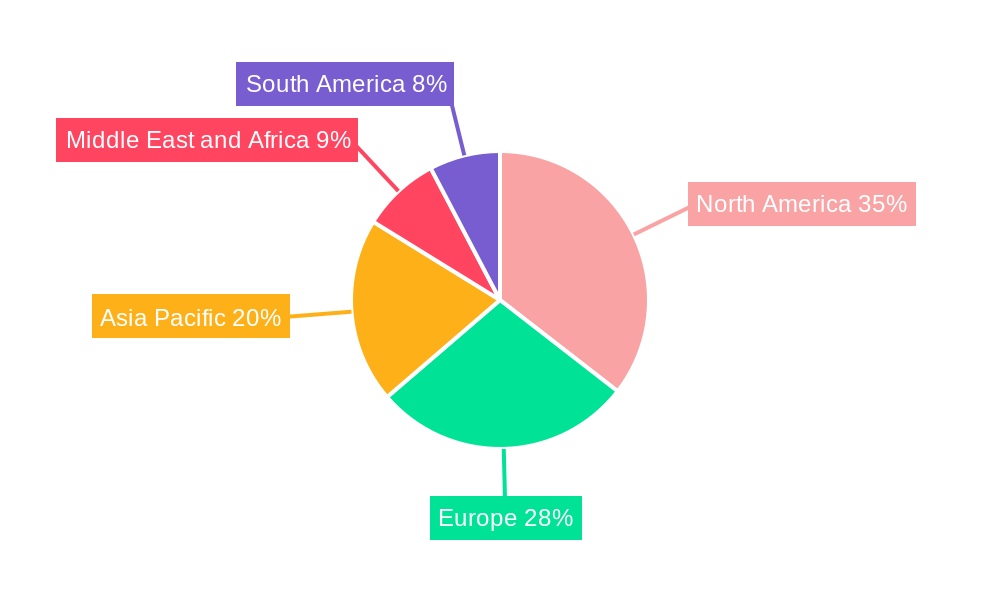
BI in Healthcare Industry Regional Market Share
Geographic Coverage of BI in Healthcare Industry
BI in Healthcare Industry REPORT HIGHLIGHTS
| Aspects | Details |
|---|---|
| Study Period | 2020-2034 |
| Base Year | 2025 |
| Estimated Year | 2026 |
| Forecast Period | 2026-2034 |
| Historical Period | 2020-2025 |
| Growth Rate | CAGR of 14.41% from 2020-2034 |
| Segmentation |
|
Table of Contents
- 1. Introduction
- 1.1. Research Scope
- 1.2. Market Segmentation
- 1.3. Research Objective
- 1.4. Definitions and Assumptions
- 2. Executive Summary
- 2.1. Market Snapshot
- 3. Market Dynamics
- 3.1. Market Drivers
- 3.2. Market Restrains
- 3.3. Market Trends
- 3.4. Market Opportunities
- 4. Market Factor Analysis
- 4.1. Porters Five Forces
- 4.1.1. Bargaining Power of Suppliers
- 4.1.2. Bargaining Power of Buyers
- 4.1.3. Threat of New Entrants
- 4.1.4. Threat of Substitutes
- 4.1.5. Competitive Rivalry
- 4.2. PESTEL analysis
- 4.3. BCG Analysis
- 4.3.1. Stars (High Growth, High Market Share)
- 4.3.2. Cash Cows (Low Growth, High Market Share)
- 4.3.3. Question Mark (High Growth, Low Market Share)
- 4.3.4. Dogs (Low Growth, Low Market Share)
- 4.4. Ansoff Matrix Analysis
- 4.5. Supply Chain Analysis
- 4.6. Regulatory Landscape
- 4.7. Current Market Potential and Opportunity Assessment (TAM–SAM–SOM Framework)
- 4.8. RAX Analyst Note
- 4.1. Porters Five Forces
- 5. Market Analysis, Insights and Forecast 2021-2033
- 5.1. Market Analysis, Insights and Forecast - by Component
- 5.1.1. Software
- 5.1.2. Services
- 5.2. Market Analysis, Insights and Forecast - by Mode of Delivery
- 5.2.1. On-premise Model
- 5.2.2. Hybrid Model
- 5.2.3. Cloud-based Model
- 5.3. Market Analysis, Insights and Forecast - by Application
- 5.3.1. Financial Analysis
- 5.3.2. Clinical Data Analysis
- 5.3.3. Patient Care Analysis
- 5.3.4. Other Applications
- 5.4. Market Analysis, Insights and Forecast - by End User
- 5.4.1. Payers
- 5.4.2. Healthcare Providers
- 5.4.3. Other End Users
- 5.5. Market Analysis, Insights and Forecast - by Region
- 5.5.1. North America
- 5.5.2. Europe
- 5.5.3. Asia Pacific
- 5.5.4. Middle East and Africa
- 5.5.5. South America
- 5.1. Market Analysis, Insights and Forecast - by Component
- 6. Global BI in Healthcare Industry Analysis, Insights and Forecast, 2021-2033
- 6.1. Market Analysis, Insights and Forecast - by Component
- 6.1.1. Software
- 6.1.2. Services
- 6.2. Market Analysis, Insights and Forecast - by Mode of Delivery
- 6.2.1. On-premise Model
- 6.2.2. Hybrid Model
- 6.2.3. Cloud-based Model
- 6.3. Market Analysis, Insights and Forecast - by Application
- 6.3.1. Financial Analysis
- 6.3.2. Clinical Data Analysis
- 6.3.3. Patient Care Analysis
- 6.3.4. Other Applications
- 6.4. Market Analysis, Insights and Forecast - by End User
- 6.4.1. Payers
- 6.4.2. Healthcare Providers
- 6.4.3. Other End Users
- 6.1. Market Analysis, Insights and Forecast - by Component
- 7. North America BI in Healthcare Industry Analysis, Insights and Forecast, 2020-2032
- 7.1. Market Analysis, Insights and Forecast - by Component
- 7.1.1. Software
- 7.1.2. Services
- 7.2. Market Analysis, Insights and Forecast - by Mode of Delivery
- 7.2.1. On-premise Model
- 7.2.2. Hybrid Model
- 7.2.3. Cloud-based Model
- 7.3. Market Analysis, Insights and Forecast - by Application
- 7.3.1. Financial Analysis
- 7.3.2. Clinical Data Analysis
- 7.3.3. Patient Care Analysis
- 7.3.4. Other Applications
- 7.4. Market Analysis, Insights and Forecast - by End User
- 7.4.1. Payers
- 7.4.2. Healthcare Providers
- 7.4.3. Other End Users
- 7.1. Market Analysis, Insights and Forecast - by Component
- 8. Europe BI in Healthcare Industry Analysis, Insights and Forecast, 2020-2032
- 8.1. Market Analysis, Insights and Forecast - by Component
- 8.1.1. Software
- 8.1.2. Services
- 8.2. Market Analysis, Insights and Forecast - by Mode of Delivery
- 8.2.1. On-premise Model
- 8.2.2. Hybrid Model
- 8.2.3. Cloud-based Model
- 8.3. Market Analysis, Insights and Forecast - by Application
- 8.3.1. Financial Analysis
- 8.3.2. Clinical Data Analysis
- 8.3.3. Patient Care Analysis
- 8.3.4. Other Applications
- 8.4. Market Analysis, Insights and Forecast - by End User
- 8.4.1. Payers
- 8.4.2. Healthcare Providers
- 8.4.3. Other End Users
- 8.1. Market Analysis, Insights and Forecast - by Component
- 9. Asia Pacific BI in Healthcare Industry Analysis, Insights and Forecast, 2020-2032
- 9.1. Market Analysis, Insights and Forecast - by Component
- 9.1.1. Software
- 9.1.2. Services
- 9.2. Market Analysis, Insights and Forecast - by Mode of Delivery
- 9.2.1. On-premise Model
- 9.2.2. Hybrid Model
- 9.2.3. Cloud-based Model
- 9.3. Market Analysis, Insights and Forecast - by Application
- 9.3.1. Financial Analysis
- 9.3.2. Clinical Data Analysis
- 9.3.3. Patient Care Analysis
- 9.3.4. Other Applications
- 9.4. Market Analysis, Insights and Forecast - by End User
- 9.4.1. Payers
- 9.4.2. Healthcare Providers
- 9.4.3. Other End Users
- 9.1. Market Analysis, Insights and Forecast - by Component
- 10. Middle East and Africa BI in Healthcare Industry Analysis, Insights and Forecast, 2020-2032
- 10.1. Market Analysis, Insights and Forecast - by Component
- 10.1.1. Software
- 10.1.2. Services
- 10.2. Market Analysis, Insights and Forecast - by Mode of Delivery
- 10.2.1. On-premise Model
- 10.2.2. Hybrid Model
- 10.2.3. Cloud-based Model
- 10.3. Market Analysis, Insights and Forecast - by Application
- 10.3.1. Financial Analysis
- 10.3.2. Clinical Data Analysis
- 10.3.3. Patient Care Analysis
- 10.3.4. Other Applications
- 10.4. Market Analysis, Insights and Forecast - by End User
- 10.4.1. Payers
- 10.4.2. Healthcare Providers
- 10.4.3. Other End Users
- 10.1. Market Analysis, Insights and Forecast - by Component
- 11. South America BI in Healthcare Industry Analysis, Insights and Forecast, 2020-2032
- 11.1. Market Analysis, Insights and Forecast - by Component
- 11.1.1. Software
- 11.1.2. Services
- 11.2. Market Analysis, Insights and Forecast - by Mode of Delivery
- 11.2.1. On-premise Model
- 11.2.2. Hybrid Model
- 11.2.3. Cloud-based Model
- 11.3. Market Analysis, Insights and Forecast - by Application
- 11.3.1. Financial Analysis
- 11.3.2. Clinical Data Analysis
- 11.3.3. Patient Care Analysis
- 11.3.4. Other Applications
- 11.4. Market Analysis, Insights and Forecast - by End User
- 11.4.1. Payers
- 11.4.2. Healthcare Providers
- 11.4.3. Other End Users
- 11.1. Market Analysis, Insights and Forecast - by Component
- 12. Competitive Analysis
- 12.1. Company Profiles
- 12.1.1 SAS Institute Inc
- 12.1.1.1. Company Overview
- 12.1.1.2. Products
- 12.1.1.3. Company Financials
- 12.1.1.4. SWOT Analysis
- 12.1.2 Infor Inc
- 12.1.2.1. Company Overview
- 12.1.2.2. Products
- 12.1.2.3. Company Financials
- 12.1.2.4. SWOT Analysis
- 12.1.3 IBM Corporation
- 12.1.3.1. Company Overview
- 12.1.3.2. Products
- 12.1.3.3. Company Financials
- 12.1.3.4. SWOT Analysis
- 12.1.4 MicroStrategy Incorporated
- 12.1.4.1. Company Overview
- 12.1.4.2. Products
- 12.1.4.3. Company Financials
- 12.1.4.4. SWOT Analysis
- 12.1.5 Microsoft Corporation
- 12.1.5.1. Company Overview
- 12.1.5.2. Products
- 12.1.5.3. Company Financials
- 12.1.5.4. SWOT Analysis
- 12.1.6 CareCloud Inc
- 12.1.6.1. Company Overview
- 12.1.6.2. Products
- 12.1.6.3. Company Financials
- 12.1.6.4. SWOT Analysis
- 12.1.7 EPIC SYSTEMS
- 12.1.7.1. Company Overview
- 12.1.7.2. Products
- 12.1.7.3. Company Financials
- 12.1.7.4. SWOT Analysis
- 12.1.8 QlikTech International AB
- 12.1.8.1. Company Overview
- 12.1.8.2. Products
- 12.1.8.3. Company Financials
- 12.1.8.4. SWOT Analysis
- 12.1.9 Information Builders
- 12.1.9.1. Company Overview
- 12.1.9.2. Products
- 12.1.9.3. Company Financials
- 12.1.9.4. SWOT Analysis
- 12.1.10 Oracle Corporation
- 12.1.10.1. Company Overview
- 12.1.10.2. Products
- 12.1.10.3. Company Financials
- 12.1.10.4. SWOT Analysis
- 12.1.11 Salesforce
- 12.1.11.1. Company Overview
- 12.1.11.2. Products
- 12.1.11.3. Company Financials
- 12.1.11.4. SWOT Analysis
- 12.1.12 Sisense Inc
- 12.1.12.1. Company Overview
- 12.1.12.2. Products
- 12.1.12.3. Company Financials
- 12.1.12.4. SWOT Analysis
- 12.1.13 Domo Inc
- 12.1.13.1. Company Overview
- 12.1.13.2. Products
- 12.1.13.3. Company Financials
- 12.1.13.4. SWOT Analysis
- 12.1.14 SAP SE
- 12.1.14.1. Company Overview
- 12.1.14.2. Products
- 12.1.14.3. Company Financials
- 12.1.14.4. SWOT Analysis
- 12.1.1 SAS Institute Inc
- 12.2. Market Entropy
- 12.2.1 Company's Key Areas Served
- 12.2.2 Recent Developments
- 12.3. Company Market Share Analysis 2025
- 12.3.1 Top 5 Companies Market Share Analysis
- 12.3.2 Top 3 Companies Market Share Analysis
- 12.4. List of Potential Customers
- 13. Research Methodology
List of Figures
- Figure 1: Global BI in Healthcare Industry Revenue Breakdown (Million, %) by Region 2025 & 2033
- Figure 2: Global BI in Healthcare Industry Volume Breakdown (K Unit, %) by Region 2025 & 2033
- Figure 3: North America BI in Healthcare Industry Revenue (Million), by Component 2025 & 2033
- Figure 4: North America BI in Healthcare Industry Volume (K Unit), by Component 2025 & 2033
- Figure 5: North America BI in Healthcare Industry Revenue Share (%), by Component 2025 & 2033
- Figure 6: North America BI in Healthcare Industry Volume Share (%), by Component 2025 & 2033
- Figure 7: North America BI in Healthcare Industry Revenue (Million), by Mode of Delivery 2025 & 2033
- Figure 8: North America BI in Healthcare Industry Volume (K Unit), by Mode of Delivery 2025 & 2033
- Figure 9: North America BI in Healthcare Industry Revenue Share (%), by Mode of Delivery 2025 & 2033
- Figure 10: North America BI in Healthcare Industry Volume Share (%), by Mode of Delivery 2025 & 2033
- Figure 11: North America BI in Healthcare Industry Revenue (Million), by Application 2025 & 2033
- Figure 12: North America BI in Healthcare Industry Volume (K Unit), by Application 2025 & 2033
- Figure 13: North America BI in Healthcare Industry Revenue Share (%), by Application 2025 & 2033
- Figure 14: North America BI in Healthcare Industry Volume Share (%), by Application 2025 & 2033
- Figure 15: North America BI in Healthcare Industry Revenue (Million), by End User 2025 & 2033
- Figure 16: North America BI in Healthcare Industry Volume (K Unit), by End User 2025 & 2033
- Figure 17: North America BI in Healthcare Industry Revenue Share (%), by End User 2025 & 2033
- Figure 18: North America BI in Healthcare Industry Volume Share (%), by End User 2025 & 2033
- Figure 19: North America BI in Healthcare Industry Revenue (Million), by Country 2025 & 2033
- Figure 20: North America BI in Healthcare Industry Volume (K Unit), by Country 2025 & 2033
- Figure 21: North America BI in Healthcare Industry Revenue Share (%), by Country 2025 & 2033
- Figure 22: North America BI in Healthcare Industry Volume Share (%), by Country 2025 & 2033
- Figure 23: Europe BI in Healthcare Industry Revenue (Million), by Component 2025 & 2033
- Figure 24: Europe BI in Healthcare Industry Volume (K Unit), by Component 2025 & 2033
- Figure 25: Europe BI in Healthcare Industry Revenue Share (%), by Component 2025 & 2033
- Figure 26: Europe BI in Healthcare Industry Volume Share (%), by Component 2025 & 2033
- Figure 27: Europe BI in Healthcare Industry Revenue (Million), by Mode of Delivery 2025 & 2033
- Figure 28: Europe BI in Healthcare Industry Volume (K Unit), by Mode of Delivery 2025 & 2033
- Figure 29: Europe BI in Healthcare Industry Revenue Share (%), by Mode of Delivery 2025 & 2033
- Figure 30: Europe BI in Healthcare Industry Volume Share (%), by Mode of Delivery 2025 & 2033
- Figure 31: Europe BI in Healthcare Industry Revenue (Million), by Application 2025 & 2033
- Figure 32: Europe BI in Healthcare Industry Volume (K Unit), by Application 2025 & 2033
- Figure 33: Europe BI in Healthcare Industry Revenue Share (%), by Application 2025 & 2033
- Figure 34: Europe BI in Healthcare Industry Volume Share (%), by Application 2025 & 2033
- Figure 35: Europe BI in Healthcare Industry Revenue (Million), by End User 2025 & 2033
- Figure 36: Europe BI in Healthcare Industry Volume (K Unit), by End User 2025 & 2033
- Figure 37: Europe BI in Healthcare Industry Revenue Share (%), by End User 2025 & 2033
- Figure 38: Europe BI in Healthcare Industry Volume Share (%), by End User 2025 & 2033
- Figure 39: Europe BI in Healthcare Industry Revenue (Million), by Country 2025 & 2033
- Figure 40: Europe BI in Healthcare Industry Volume (K Unit), by Country 2025 & 2033
- Figure 41: Europe BI in Healthcare Industry Revenue Share (%), by Country 2025 & 2033
- Figure 42: Europe BI in Healthcare Industry Volume Share (%), by Country 2025 & 2033
- Figure 43: Asia Pacific BI in Healthcare Industry Revenue (Million), by Component 2025 & 2033
- Figure 44: Asia Pacific BI in Healthcare Industry Volume (K Unit), by Component 2025 & 2033
- Figure 45: Asia Pacific BI in Healthcare Industry Revenue Share (%), by Component 2025 & 2033
- Figure 46: Asia Pacific BI in Healthcare Industry Volume Share (%), by Component 2025 & 2033
- Figure 47: Asia Pacific BI in Healthcare Industry Revenue (Million), by Mode of Delivery 2025 & 2033
- Figure 48: Asia Pacific BI in Healthcare Industry Volume (K Unit), by Mode of Delivery 2025 & 2033
- Figure 49: Asia Pacific BI in Healthcare Industry Revenue Share (%), by Mode of Delivery 2025 & 2033
- Figure 50: Asia Pacific BI in Healthcare Industry Volume Share (%), by Mode of Delivery 2025 & 2033
- Figure 51: Asia Pacific BI in Healthcare Industry Revenue (Million), by Application 2025 & 2033
- Figure 52: Asia Pacific BI in Healthcare Industry Volume (K Unit), by Application 2025 & 2033
- Figure 53: Asia Pacific BI in Healthcare Industry Revenue Share (%), by Application 2025 & 2033
- Figure 54: Asia Pacific BI in Healthcare Industry Volume Share (%), by Application 2025 & 2033
- Figure 55: Asia Pacific BI in Healthcare Industry Revenue (Million), by End User 2025 & 2033
- Figure 56: Asia Pacific BI in Healthcare Industry Volume (K Unit), by End User 2025 & 2033
- Figure 57: Asia Pacific BI in Healthcare Industry Revenue Share (%), by End User 2025 & 2033
- Figure 58: Asia Pacific BI in Healthcare Industry Volume Share (%), by End User 2025 & 2033
- Figure 59: Asia Pacific BI in Healthcare Industry Revenue (Million), by Country 2025 & 2033
- Figure 60: Asia Pacific BI in Healthcare Industry Volume (K Unit), by Country 2025 & 2033
- Figure 61: Asia Pacific BI in Healthcare Industry Revenue Share (%), by Country 2025 & 2033
- Figure 62: Asia Pacific BI in Healthcare Industry Volume Share (%), by Country 2025 & 2033
- Figure 63: Middle East and Africa BI in Healthcare Industry Revenue (Million), by Component 2025 & 2033
- Figure 64: Middle East and Africa BI in Healthcare Industry Volume (K Unit), by Component 2025 & 2033
- Figure 65: Middle East and Africa BI in Healthcare Industry Revenue Share (%), by Component 2025 & 2033
- Figure 66: Middle East and Africa BI in Healthcare Industry Volume Share (%), by Component 2025 & 2033
- Figure 67: Middle East and Africa BI in Healthcare Industry Revenue (Million), by Mode of Delivery 2025 & 2033
- Figure 68: Middle East and Africa BI in Healthcare Industry Volume (K Unit), by Mode of Delivery 2025 & 2033
- Figure 69: Middle East and Africa BI in Healthcare Industry Revenue Share (%), by Mode of Delivery 2025 & 2033
- Figure 70: Middle East and Africa BI in Healthcare Industry Volume Share (%), by Mode of Delivery 2025 & 2033
- Figure 71: Middle East and Africa BI in Healthcare Industry Revenue (Million), by Application 2025 & 2033
- Figure 72: Middle East and Africa BI in Healthcare Industry Volume (K Unit), by Application 2025 & 2033
- Figure 73: Middle East and Africa BI in Healthcare Industry Revenue Share (%), by Application 2025 & 2033
- Figure 74: Middle East and Africa BI in Healthcare Industry Volume Share (%), by Application 2025 & 2033
- Figure 75: Middle East and Africa BI in Healthcare Industry Revenue (Million), by End User 2025 & 2033
- Figure 76: Middle East and Africa BI in Healthcare Industry Volume (K Unit), by End User 2025 & 2033
- Figure 77: Middle East and Africa BI in Healthcare Industry Revenue Share (%), by End User 2025 & 2033
- Figure 78: Middle East and Africa BI in Healthcare Industry Volume Share (%), by End User 2025 & 2033
- Figure 79: Middle East and Africa BI in Healthcare Industry Revenue (Million), by Country 2025 & 2033
- Figure 80: Middle East and Africa BI in Healthcare Industry Volume (K Unit), by Country 2025 & 2033
- Figure 81: Middle East and Africa BI in Healthcare Industry Revenue Share (%), by Country 2025 & 2033
- Figure 82: Middle East and Africa BI in Healthcare Industry Volume Share (%), by Country 2025 & 2033
- Figure 83: South America BI in Healthcare Industry Revenue (Million), by Component 2025 & 2033
- Figure 84: South America BI in Healthcare Industry Volume (K Unit), by Component 2025 & 2033
- Figure 85: South America BI in Healthcare Industry Revenue Share (%), by Component 2025 & 2033
- Figure 86: South America BI in Healthcare Industry Volume Share (%), by Component 2025 & 2033
- Figure 87: South America BI in Healthcare Industry Revenue (Million), by Mode of Delivery 2025 & 2033
- Figure 88: South America BI in Healthcare Industry Volume (K Unit), by Mode of Delivery 2025 & 2033
- Figure 89: South America BI in Healthcare Industry Revenue Share (%), by Mode of Delivery 2025 & 2033
- Figure 90: South America BI in Healthcare Industry Volume Share (%), by Mode of Delivery 2025 & 2033
- Figure 91: South America BI in Healthcare Industry Revenue (Million), by Application 2025 & 2033
- Figure 92: South America BI in Healthcare Industry Volume (K Unit), by Application 2025 & 2033
- Figure 93: South America BI in Healthcare Industry Revenue Share (%), by Application 2025 & 2033
- Figure 94: South America BI in Healthcare Industry Volume Share (%), by Application 2025 & 2033
- Figure 95: South America BI in Healthcare Industry Revenue (Million), by End User 2025 & 2033
- Figure 96: South America BI in Healthcare Industry Volume (K Unit), by End User 2025 & 2033
- Figure 97: South America BI in Healthcare Industry Revenue Share (%), by End User 2025 & 2033
- Figure 98: South America BI in Healthcare Industry Volume Share (%), by End User 2025 & 2033
- Figure 99: South America BI in Healthcare Industry Revenue (Million), by Country 2025 & 2033
- Figure 100: South America BI in Healthcare Industry Volume (K Unit), by Country 2025 & 2033
- Figure 101: South America BI in Healthcare Industry Revenue Share (%), by Country 2025 & 2033
- Figure 102: South America BI in Healthcare Industry Volume Share (%), by Country 2025 & 2033
List of Tables
- Table 1: Global BI in Healthcare Industry Revenue Million Forecast, by Component 2020 & 2033
- Table 2: Global BI in Healthcare Industry Volume K Unit Forecast, by Component 2020 & 2033
- Table 3: Global BI in Healthcare Industry Revenue Million Forecast, by Mode of Delivery 2020 & 2033
- Table 4: Global BI in Healthcare Industry Volume K Unit Forecast, by Mode of Delivery 2020 & 2033
- Table 5: Global BI in Healthcare Industry Revenue Million Forecast, by Application 2020 & 2033
- Table 6: Global BI in Healthcare Industry Volume K Unit Forecast, by Application 2020 & 2033
- Table 7: Global BI in Healthcare Industry Revenue Million Forecast, by End User 2020 & 2033
- Table 8: Global BI in Healthcare Industry Volume K Unit Forecast, by End User 2020 & 2033
- Table 9: Global BI in Healthcare Industry Revenue Million Forecast, by Region 2020 & 2033
- Table 10: Global BI in Healthcare Industry Volume K Unit Forecast, by Region 2020 & 2033
- Table 11: Global BI in Healthcare Industry Revenue Million Forecast, by Component 2020 & 2033
- Table 12: Global BI in Healthcare Industry Volume K Unit Forecast, by Component 2020 & 2033
- Table 13: Global BI in Healthcare Industry Revenue Million Forecast, by Mode of Delivery 2020 & 2033
- Table 14: Global BI in Healthcare Industry Volume K Unit Forecast, by Mode of Delivery 2020 & 2033
- Table 15: Global BI in Healthcare Industry Revenue Million Forecast, by Application 2020 & 2033
- Table 16: Global BI in Healthcare Industry Volume K Unit Forecast, by Application 2020 & 2033
- Table 17: Global BI in Healthcare Industry Revenue Million Forecast, by End User 2020 & 2033
- Table 18: Global BI in Healthcare Industry Volume K Unit Forecast, by End User 2020 & 2033
- Table 19: Global BI in Healthcare Industry Revenue Million Forecast, by Country 2020 & 2033
- Table 20: Global BI in Healthcare Industry Volume K Unit Forecast, by Country 2020 & 2033
- Table 21: United States BI in Healthcare Industry Revenue (Million) Forecast, by Application 2020 & 2033
- Table 22: United States BI in Healthcare Industry Volume (K Unit) Forecast, by Application 2020 & 2033
- Table 23: Canada BI in Healthcare Industry Revenue (Million) Forecast, by Application 2020 & 2033
- Table 24: Canada BI in Healthcare Industry Volume (K Unit) Forecast, by Application 2020 & 2033
- Table 25: Mexico BI in Healthcare Industry Revenue (Million) Forecast, by Application 2020 & 2033
- Table 26: Mexico BI in Healthcare Industry Volume (K Unit) Forecast, by Application 2020 & 2033
- Table 27: Global BI in Healthcare Industry Revenue Million Forecast, by Component 2020 & 2033
- Table 28: Global BI in Healthcare Industry Volume K Unit Forecast, by Component 2020 & 2033
- Table 29: Global BI in Healthcare Industry Revenue Million Forecast, by Mode of Delivery 2020 & 2033
- Table 30: Global BI in Healthcare Industry Volume K Unit Forecast, by Mode of Delivery 2020 & 2033
- Table 31: Global BI in Healthcare Industry Revenue Million Forecast, by Application 2020 & 2033
- Table 32: Global BI in Healthcare Industry Volume K Unit Forecast, by Application 2020 & 2033
- Table 33: Global BI in Healthcare Industry Revenue Million Forecast, by End User 2020 & 2033
- Table 34: Global BI in Healthcare Industry Volume K Unit Forecast, by End User 2020 & 2033
- Table 35: Global BI in Healthcare Industry Revenue Million Forecast, by Country 2020 & 2033
- Table 36: Global BI in Healthcare Industry Volume K Unit Forecast, by Country 2020 & 2033
- Table 37: Germany BI in Healthcare Industry Revenue (Million) Forecast, by Application 2020 & 2033
- Table 38: Germany BI in Healthcare Industry Volume (K Unit) Forecast, by Application 2020 & 2033
- Table 39: United Kingdom BI in Healthcare Industry Revenue (Million) Forecast, by Application 2020 & 2033
- Table 40: United Kingdom BI in Healthcare Industry Volume (K Unit) Forecast, by Application 2020 & 2033
- Table 41: France BI in Healthcare Industry Revenue (Million) Forecast, by Application 2020 & 2033
- Table 42: France BI in Healthcare Industry Volume (K Unit) Forecast, by Application 2020 & 2033
- Table 43: Italy BI in Healthcare Industry Revenue (Million) Forecast, by Application 2020 & 2033
- Table 44: Italy BI in Healthcare Industry Volume (K Unit) Forecast, by Application 2020 & 2033
- Table 45: Spain BI in Healthcare Industry Revenue (Million) Forecast, by Application 2020 & 2033
- Table 46: Spain BI in Healthcare Industry Volume (K Unit) Forecast, by Application 2020 & 2033
- Table 47: Rest of Europe BI in Healthcare Industry Revenue (Million) Forecast, by Application 2020 & 2033
- Table 48: Rest of Europe BI in Healthcare Industry Volume (K Unit) Forecast, by Application 2020 & 2033
- Table 49: Global BI in Healthcare Industry Revenue Million Forecast, by Component 2020 & 2033
- Table 50: Global BI in Healthcare Industry Volume K Unit Forecast, by Component 2020 & 2033
- Table 51: Global BI in Healthcare Industry Revenue Million Forecast, by Mode of Delivery 2020 & 2033
- Table 52: Global BI in Healthcare Industry Volume K Unit Forecast, by Mode of Delivery 2020 & 2033
- Table 53: Global BI in Healthcare Industry Revenue Million Forecast, by Application 2020 & 2033
- Table 54: Global BI in Healthcare Industry Volume K Unit Forecast, by Application 2020 & 2033
- Table 55: Global BI in Healthcare Industry Revenue Million Forecast, by End User 2020 & 2033
- Table 56: Global BI in Healthcare Industry Volume K Unit Forecast, by End User 2020 & 2033
- Table 57: Global BI in Healthcare Industry Revenue Million Forecast, by Country 2020 & 2033
- Table 58: Global BI in Healthcare Industry Volume K Unit Forecast, by Country 2020 & 2033
- Table 59: China BI in Healthcare Industry Revenue (Million) Forecast, by Application 2020 & 2033
- Table 60: China BI in Healthcare Industry Volume (K Unit) Forecast, by Application 2020 & 2033
- Table 61: Japan BI in Healthcare Industry Revenue (Million) Forecast, by Application 2020 & 2033
- Table 62: Japan BI in Healthcare Industry Volume (K Unit) Forecast, by Application 2020 & 2033
- Table 63: India BI in Healthcare Industry Revenue (Million) Forecast, by Application 2020 & 2033
- Table 64: India BI in Healthcare Industry Volume (K Unit) Forecast, by Application 2020 & 2033
- Table 65: Australia BI in Healthcare Industry Revenue (Million) Forecast, by Application 2020 & 2033
- Table 66: Australia BI in Healthcare Industry Volume (K Unit) Forecast, by Application 2020 & 2033
- Table 67: South Korea BI in Healthcare Industry Revenue (Million) Forecast, by Application 2020 & 2033
- Table 68: South Korea BI in Healthcare Industry Volume (K Unit) Forecast, by Application 2020 & 2033
- Table 69: Rest of Asia Pacific BI in Healthcare Industry Revenue (Million) Forecast, by Application 2020 & 2033
- Table 70: Rest of Asia Pacific BI in Healthcare Industry Volume (K Unit) Forecast, by Application 2020 & 2033
- Table 71: Global BI in Healthcare Industry Revenue Million Forecast, by Component 2020 & 2033
- Table 72: Global BI in Healthcare Industry Volume K Unit Forecast, by Component 2020 & 2033
- Table 73: Global BI in Healthcare Industry Revenue Million Forecast, by Mode of Delivery 2020 & 2033
- Table 74: Global BI in Healthcare Industry Volume K Unit Forecast, by Mode of Delivery 2020 & 2033
- Table 75: Global BI in Healthcare Industry Revenue Million Forecast, by Application 2020 & 2033
- Table 76: Global BI in Healthcare Industry Volume K Unit Forecast, by Application 2020 & 2033
- Table 77: Global BI in Healthcare Industry Revenue Million Forecast, by End User 2020 & 2033
- Table 78: Global BI in Healthcare Industry Volume K Unit Forecast, by End User 2020 & 2033
- Table 79: Global BI in Healthcare Industry Revenue Million Forecast, by Country 2020 & 2033
- Table 80: Global BI in Healthcare Industry Volume K Unit Forecast, by Country 2020 & 2033
- Table 81: GCC BI in Healthcare Industry Revenue (Million) Forecast, by Application 2020 & 2033
- Table 82: GCC BI in Healthcare Industry Volume (K Unit) Forecast, by Application 2020 & 2033
- Table 83: South Africa BI in Healthcare Industry Revenue (Million) Forecast, by Application 2020 & 2033
- Table 84: South Africa BI in Healthcare Industry Volume (K Unit) Forecast, by Application 2020 & 2033
- Table 85: Rest of Middle East and Africa BI in Healthcare Industry Revenue (Million) Forecast, by Application 2020 & 2033
- Table 86: Rest of Middle East and Africa BI in Healthcare Industry Volume (K Unit) Forecast, by Application 2020 & 2033
- Table 87: Global BI in Healthcare Industry Revenue Million Forecast, by Component 2020 & 2033
- Table 88: Global BI in Healthcare Industry Volume K Unit Forecast, by Component 2020 & 2033
- Table 89: Global BI in Healthcare Industry Revenue Million Forecast, by Mode of Delivery 2020 & 2033
- Table 90: Global BI in Healthcare Industry Volume K Unit Forecast, by Mode of Delivery 2020 & 2033
- Table 91: Global BI in Healthcare Industry Revenue Million Forecast, by Application 2020 & 2033
- Table 92: Global BI in Healthcare Industry Volume K Unit Forecast, by Application 2020 & 2033
- Table 93: Global BI in Healthcare Industry Revenue Million Forecast, by End User 2020 & 2033
- Table 94: Global BI in Healthcare Industry Volume K Unit Forecast, by End User 2020 & 2033
- Table 95: Global BI in Healthcare Industry Revenue Million Forecast, by Country 2020 & 2033
- Table 96: Global BI in Healthcare Industry Volume K Unit Forecast, by Country 2020 & 2033
- Table 97: Brazil BI in Healthcare Industry Revenue (Million) Forecast, by Application 2020 & 2033
- Table 98: Brazil BI in Healthcare Industry Volume (K Unit) Forecast, by Application 2020 & 2033
- Table 99: Argentina BI in Healthcare Industry Revenue (Million) Forecast, by Application 2020 & 2033
- Table 100: Argentina BI in Healthcare Industry Volume (K Unit) Forecast, by Application 2020 & 2033
- Table 101: Rest of South America BI in Healthcare Industry Revenue (Million) Forecast, by Application 2020 & 2033
- Table 102: Rest of South America BI in Healthcare Industry Volume (K Unit) Forecast, by Application 2020 & 2033
Frequently Asked Questions
1. What is the projected Compound Annual Growth Rate (CAGR) of the BI in Healthcare Industry?
The projected CAGR is approximately 14.41%.
2. Which companies are prominent players in the BI in Healthcare Industry?
Key companies in the market include SAS Institute Inc, Infor Inc, IBM Corporation, MicroStrategy Incorporated, Microsoft Corporation, CareCloud Inc, EPIC SYSTEMS, QlikTech International AB, Information Builders, Oracle Corporation, Salesforce, Sisense Inc, Domo Inc , SAP SE.
3. What are the main segments of the BI in Healthcare Industry?
The market segments include Component, Mode of Delivery, Application, End User.
4. Can you provide details about the market size?
The market size is estimated to be USD 10.17 Million as of 2022.
5. What are some drivers contributing to market growth?
Growing Government Initiatives for Healthcare Digitalization. Like Adoption of EHR; Increasing Number of Patient Registries; The Emergence of Big Data in the Healthcare Industry.
6. What are the notable trends driving market growth?
Cloud-based Model is Expected to Grow Significantly in the Healthcare BI Market Over the Forecast Period.
7. Are there any restraints impacting market growth?
High Cost of Implementation; Lack of Skilled Professionals.
8. Can you provide examples of recent developments in the market?
Jun 2022: Oracle Corporation completed the acquisition of Cerner Corporation, a supplier of health information technology services.
9. What pricing options are available for accessing the report?
Pricing options include single-user, multi-user, and enterprise licenses priced at USD 4750, USD 5250, and USD 8750 respectively.
10. Is the market size provided in terms of value or volume?
The market size is provided in terms of value, measured in Million and volume, measured in K Unit.
11. Are there any specific market keywords associated with the report?
Yes, the market keyword associated with the report is "BI in Healthcare Industry," which aids in identifying and referencing the specific market segment covered.
12. How do I determine which pricing option suits my needs best?
The pricing options vary based on user requirements and access needs. Individual users may opt for single-user licenses, while businesses requiring broader access may choose multi-user or enterprise licenses for cost-effective access to the report.
13. Are there any additional resources or data provided in the BI in Healthcare Industry report?
While the report offers comprehensive insights, it's advisable to review the specific contents or supplementary materials provided to ascertain if additional resources or data are available.
14. How can I stay updated on further developments or reports in the BI in Healthcare Industry?
To stay informed about further developments, trends, and reports in the BI in Healthcare Industry, consider subscribing to industry newsletters, following relevant companies and organizations, or regularly checking reputable industry news sources and publications.
Methodology
Step 1 - Identification of Relevant Samples Size from Population Database


Step 2 - Approaches for Defining Global Market Size (Value, Volume* & Price*)

Note*: In applicable scenarios
Step 3 - Data Sources
Primary Research
- Web Analytics
- Survey Reports
- Research Institute
- Latest Research Reports
- Opinion Leaders
Secondary Research
- Annual Reports
- White Paper
- Latest Press Release
- Industry Association
- Paid Database
- Investor Presentations

Step 4 - Data Triangulation
Involves using different sources of information in order to increase the validity of a study
These sources are likely to be stakeholders in a program - participants, other researchers, program staff, other community members, and so on.
Then we put all data in single framework & apply various statistical tools to find out the dynamic on the market.
During the analysis stage, feedback from the stakeholder groups would be compared to determine areas of agreement as well as areas of divergence