
Key Insights
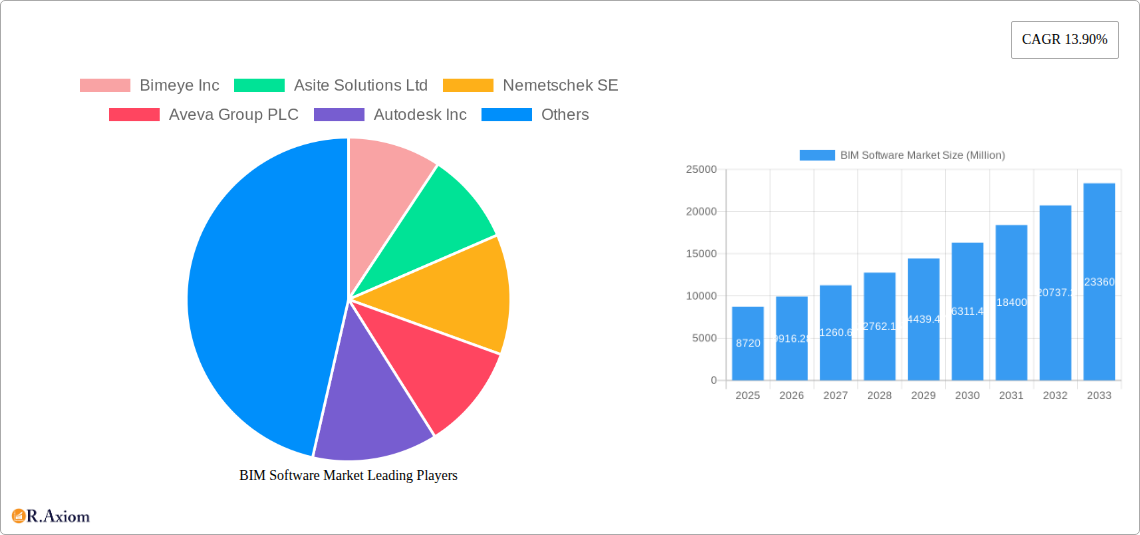
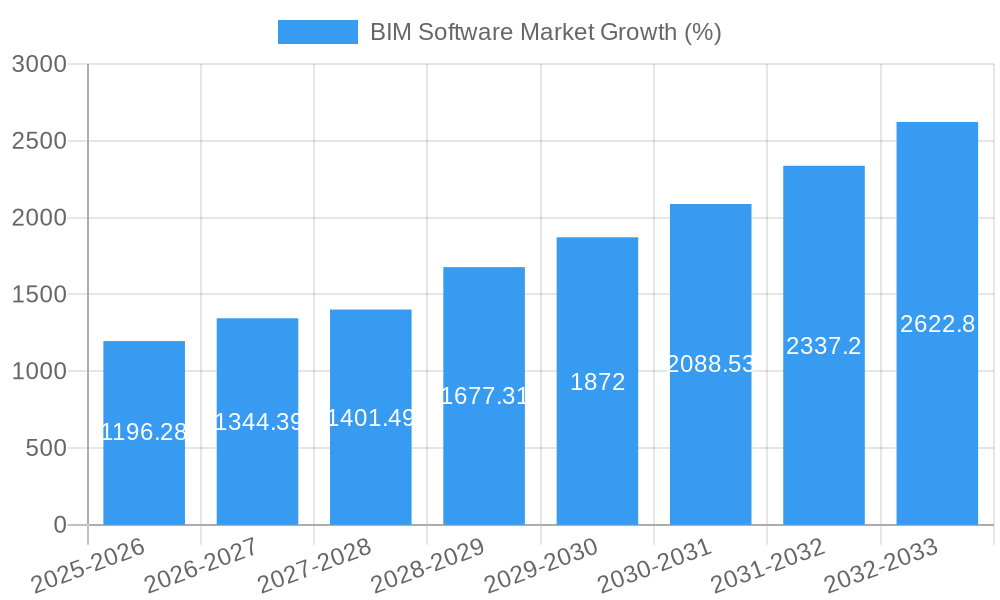
The Building Information Modeling (BIM) software market, valued at $8.72 billion in 2025, is experiencing robust growth, projected to expand at a Compound Annual Growth Rate (CAGR) of 13.90% from 2025 to 2033. This expansion is driven by several key factors. Increasing adoption of digital technologies within the architecture, engineering, and construction (AEC) industry is a major catalyst, with firms seeking to improve efficiency, collaboration, and project outcomes through BIM's integrated design and data management capabilities. Furthermore, government mandates and initiatives promoting BIM adoption in various regions, particularly in North America and Europe, are significantly boosting market growth. The rising complexity of construction projects, coupled with the need for accurate cost estimations and risk mitigation, is further fueling demand for sophisticated BIM software solutions. The market is segmented by end-user (contractors, architects, facilities managers, etc.), solution type (software and services), and application (commercial, residential, industrial). Software solutions currently dominate the market share, but the services segment is also growing rapidly, driven by increasing demand for implementation support, training, and customization.
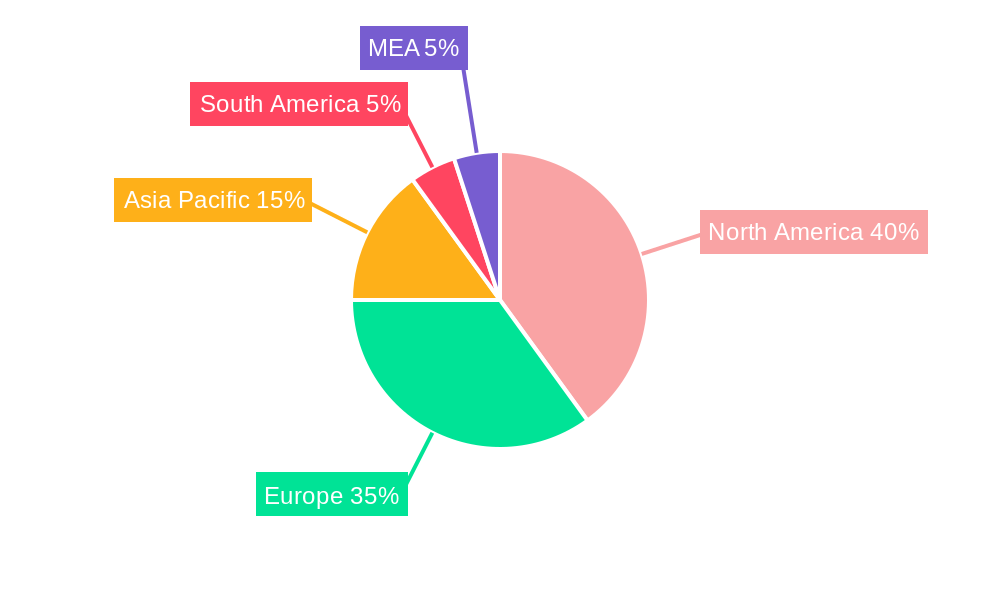
The competitive landscape is characterized by a mix of established players like Autodesk, Bentley Systems, and Nemetschek, and emerging technology providers. These companies are constantly innovating to enhance their offerings, incorporating features like cloud-based collaboration, artificial intelligence (AI) for design optimization, and immersive technologies for virtual and augmented reality (VR/AR) applications within BIM workflows. The geographical distribution of the market reveals strong growth in North America and Europe, driven by high technological adoption and robust construction activity. However, Asia Pacific is expected to emerge as a high-growth region in the coming years, driven by rapid urbanization and infrastructure development. The market faces certain challenges, including the high initial investment cost associated with BIM software and the need for skilled professionals to effectively utilize these tools. However, the long-term benefits in terms of cost savings, improved project quality, and reduced risk are overcoming these hurdles, driving continued market expansion.
This detailed report provides a comprehensive analysis of the BIM (Building Information Modeling) software market, offering valuable insights for industry stakeholders, investors, and businesses seeking to navigate this rapidly evolving landscape. The report covers the period from 2019 to 2033, with a focus on the forecast period from 2025 to 2033 and a base year of 2025. The market is segmented by end-user (contractors, architects, facilities managers, other end-users), solution type (software, service), and application (commercial, residential, industrial, other applications). The report values are expressed in Millions.
BIM Software Market Concentration & Innovation
The BIM software market exhibits a moderately concentrated structure, with a few dominant players controlling a significant market share. However, the market is also characterized by continuous innovation, driven by advancements in cloud computing, artificial intelligence (AI), and Internet of Things (IoT) technologies. This innovation is fostering the development of more sophisticated and integrated BIM solutions.
Market Share: While precise market share figures for individual companies are proprietary, Autodesk, Bentley Systems, and Nemetschek SE hold leading positions. Smaller players are actively competing through niche offerings and specialized functionalities. The combined market share of the top 5 players is estimated at xx%.
M&A Activity: The BIM software market has witnessed significant mergers and acquisitions (M&A) activity in recent years, as larger companies seek to expand their product portfolios and geographic reach. Total M&A deal value during the historical period (2019-2024) is estimated to be approximately $xx Million. These transactions often involve the acquisition of smaller, specialized companies with innovative technologies.
Regulatory Frameworks: Government regulations promoting digitalization and sustainable building practices are driving the adoption of BIM software globally. However, varying regulatory landscapes across different regions present both opportunities and challenges for market players.
Product Substitutes: While dedicated BIM software remains the primary solution for building information modeling, the emergence of cloud-based collaboration platforms and other digital design tools presents some level of substitutability.
End-User Trends: The increasing demand for enhanced collaboration, data interoperability, and sustainable building practices is shaping end-user preferences. The shift towards integrated platforms that streamline workflows across the entire project lifecycle is a notable trend.
BIM Software Market Industry Trends & Insights
The BIM software market is experiencing robust growth, driven by factors such as the increasing adoption of digital technologies in the construction industry, the rising need for improved project efficiency and collaboration, and the growing focus on sustainable building practices. The market is expected to witness a Compound Annual Growth Rate (CAGR) of xx% during the forecast period (2025-2033).
Market penetration of BIM software varies across different regions and sectors. Developed economies have higher penetration rates compared to developing economies, although rapid growth is expected in emerging markets driven by infrastructure development and government initiatives. Technological disruptions, such as the integration of AI and VR/AR technologies into BIM platforms, are enhancing the capabilities of the software, driving wider adoption. The shift towards cloud-based BIM solutions offers scalability, accessibility, and enhanced collaboration capabilities, fueling market growth. Competitive dynamics are characterized by continuous product innovation, strategic partnerships, and M&A activity.
Dominant Markets & Segments in BIM Software Market
The North American region currently holds a leading position in the BIM software market, driven by high adoption rates, advanced technological infrastructure, and strong government support for digitalization in the construction sector. Within this region, the United States is the dominant country.
By End User: Contractors constitute the largest segment within the end-user category, owing to the software's ability to streamline workflows, improve project coordination, and reduce construction errors. Architects represent a significant segment, benefiting from improved design visualization and collaboration features. The demand from facilities managers is steadily increasing, as BIM data provides valuable insights for facility operations and maintenance.
Key Drivers (across segments):
- Growing investment in infrastructure projects.
- Increasing government mandates for BIM adoption.
- Enhanced project collaboration and efficiency.
- Improved visualization and design capabilities.
- Data-driven decision making and cost optimization.
By Solution Type: The software segment dominates the market, with cloud-based solutions witnessing significant growth. The services segment, which includes consulting, training, and implementation services, is also expanding.
By Application: The commercial segment currently leads, propelled by large-scale construction projects and a higher adoption of advanced technologies. However, the residential and industrial segments are also showing strong growth potential.
BIM Software Market Product Developments
Recent product developments focus on enhancing the integration of BIM software with other construction technologies, such as IoT sensors, drones, and VR/AR systems. Cloud-based solutions are becoming increasingly prevalent, offering enhanced collaboration and data management capabilities. AI-powered features, such as automated error detection and design optimization, are also gaining traction. The market is witnessing a push toward open BIM standards to enhance interoperability and data exchange between different software platforms.
Report Scope & Segmentation Analysis
This report provides a comprehensive analysis of the BIM software market, segmented by end-user (contractors, architects, facilities managers, other end-users), solution type (software, service), and application (commercial, residential, industrial, other applications). Each segment's growth projections, market sizes, and competitive dynamics are detailed in the full report. Contractors are projected to experience significant growth owing to their adoption of BIM for improved project outcomes. The software segment is expected to continue its market dominance as technology advances. Commercial applications are expected to exhibit strong growth due to larger-scale projects and higher technological adoption.
Key Drivers of BIM Software Market Growth
Several factors are fueling the growth of the BIM software market. Technological advancements, particularly in cloud computing, AI, and IoT, are leading to more sophisticated and integrated BIM solutions. Economic factors, such as growing investments in infrastructure projects and the increasing adoption of digital technologies, are also driving market growth. Government regulations promoting BIM adoption, often linked to building codes, are further boosting market expansion.
Challenges in the BIM Software Market Sector
Despite the significant growth opportunities, the BIM software market faces certain challenges. High initial investment costs can be a barrier to entry for smaller companies, and the complexities of integrating BIM data across multiple platforms can present operational challenges. The need for skilled professionals to effectively utilize the software may create a talent shortage. Competition among established players and the emergence of new entrants can create price pressures.
Emerging Opportunities in BIM Software Market
The BIM software market presents exciting opportunities. The integration of extended reality (XR) technologies like VR and AR offers potential for immersive design visualization and construction simulations. The increasing adoption of digital twins creates opportunities for better predictive maintenance and asset management. Growing adoption in developing economies, driven by infrastructure development initiatives, presents significant untapped potential.
Leading Players in the BIM Software Market
- Bimeye Inc
- Asite Solutions Ltd
- Nemetschek SE
- Aveva Group PLC
- Autodesk Inc
- Topcon Positioning Systems Inc
- Dassault Systèmes SA
- Trimble Inc
- Bentley Systems Inc
- Hexagon AB
Key Developments in BIM Software Market Industry
September 2022: Autodesk announced a suite of new capabilities across the Autodesk Construction Cloud reality, streamlining workflows and providing instant access to essential model data for all stakeholders.
November 2022: Bentley announced new capabilities of its iTwin Platform, significantly extending infrastructure data interoperability for digital twins across design, construction, and operations. This powers Bentley Infrastructure Cloud, encompassing ProjectWise, SYNCHRO, and AssetWise.
Strategic Outlook for BIM Software Market
The BIM software market is poised for continued growth, driven by technological innovation, expanding applications, and increasing adoption across various sectors. The focus on cloud-based solutions, AI-powered features, and the integration of other construction technologies will shape the future of the market. Opportunities exist in emerging markets, specialized applications, and the development of integrated platforms that cater to the evolving needs of the construction industry.
BIM Software Market Segmentation
-
1. Solution Type
- 1.1. Software
- 1.2. Service
-
2. Application
- 2.1. Commercial
- 2.2. Residential
- 2.3. Industrial
- 2.4. Other Applications
-
3. End User
- 3.1. Contractors
- 3.2. Architects
- 3.3. Facilities Managers
- 3.4. Other End Users
BIM Software Market Segmentation By Geography
-
1. North America
- 1.1. United States
- 1.2. Canada
-
2. Europe
- 2.1. Germany
- 2.2. United Kingdom
- 2.3. France
- 2.4. Rest of Europe
-
3. Asia Pacific
- 3.1. China
- 3.2. Japan
- 3.3. India
- 3.4. South Korea
- 3.5. Rest of Asia Pacific
- 4. Latin America
- 5. Middle East and Africa
BIM Software Market REPORT HIGHLIGHTS
| Aspects | Details |
|---|---|
| Study Period | 2019-2033 |
| Base Year | 2024 |
| Estimated Year | 2025 |
| Forecast Period | 2025-2033 |
| Historical Period | 2019-2024 |
| Growth Rate | CAGR of 13.90% from 2019-2033 |
| Segmentation |
|
Table of Contents
- 1. Introduction
- 1.1. Research Scope
- 1.2. Market Segmentation
- 1.3. Research Methodology
- 1.4. Definitions and Assumptions
- 2. Executive Summary
- 2.1. Introduction
- 3. Market Dynamics
- 3.1. Introduction
- 3.2. Market Drivers
- 3.2.1. Governmental Mandates Promoting the Usage of BIM in Key International Markets; Increased Project Performance and Productivity
- 3.3. Market Restrains
- 3.3.1. Cost and Implementation Issues
- 3.4. Market Trends
- 3.4.1. Governmental Mandates Promoting the Usage of BIM in Key International Markets to Witness High Growth
- 4. Market Factor Analysis
- 4.1. Porters Five Forces
- 4.2. Supply/Value Chain
- 4.3. PESTEL analysis
- 4.4. Market Entropy
- 4.5. Patent/Trademark Analysis
- 5. Global BIM Software Market Analysis, Insights and Forecast, 2019-2031
- 5.1. Market Analysis, Insights and Forecast - by Solution Type
- 5.1.1. Software
- 5.1.2. Service
- 5.2. Market Analysis, Insights and Forecast - by Application
- 5.2.1. Commercial
- 5.2.2. Residential
- 5.2.3. Industrial
- 5.2.4. Other Applications
- 5.3. Market Analysis, Insights and Forecast - by End User
- 5.3.1. Contractors
- 5.3.2. Architects
- 5.3.3. Facilities Managers
- 5.3.4. Other End Users
- 5.4. Market Analysis, Insights and Forecast - by Region
- 5.4.1. North America
- 5.4.2. Europe
- 5.4.3. Asia Pacific
- 5.4.4. Latin America
- 5.4.5. Middle East and Africa
- 5.1. Market Analysis, Insights and Forecast - by Solution Type
- 6. North America BIM Software Market Analysis, Insights and Forecast, 2019-2031
- 6.1. Market Analysis, Insights and Forecast - by Solution Type
- 6.1.1. Software
- 6.1.2. Service
- 6.2. Market Analysis, Insights and Forecast - by Application
- 6.2.1. Commercial
- 6.2.2. Residential
- 6.2.3. Industrial
- 6.2.4. Other Applications
- 6.3. Market Analysis, Insights and Forecast - by End User
- 6.3.1. Contractors
- 6.3.2. Architects
- 6.3.3. Facilities Managers
- 6.3.4. Other End Users
- 6.1. Market Analysis, Insights and Forecast - by Solution Type
- 7. Europe BIM Software Market Analysis, Insights and Forecast, 2019-2031
- 7.1. Market Analysis, Insights and Forecast - by Solution Type
- 7.1.1. Software
- 7.1.2. Service
- 7.2. Market Analysis, Insights and Forecast - by Application
- 7.2.1. Commercial
- 7.2.2. Residential
- 7.2.3. Industrial
- 7.2.4. Other Applications
- 7.3. Market Analysis, Insights and Forecast - by End User
- 7.3.1. Contractors
- 7.3.2. Architects
- 7.3.3. Facilities Managers
- 7.3.4. Other End Users
- 7.1. Market Analysis, Insights and Forecast - by Solution Type
- 8. Asia Pacific BIM Software Market Analysis, Insights and Forecast, 2019-2031
- 8.1. Market Analysis, Insights and Forecast - by Solution Type
- 8.1.1. Software
- 8.1.2. Service
- 8.2. Market Analysis, Insights and Forecast - by Application
- 8.2.1. Commercial
- 8.2.2. Residential
- 8.2.3. Industrial
- 8.2.4. Other Applications
- 8.3. Market Analysis, Insights and Forecast - by End User
- 8.3.1. Contractors
- 8.3.2. Architects
- 8.3.3. Facilities Managers
- 8.3.4. Other End Users
- 8.1. Market Analysis, Insights and Forecast - by Solution Type
- 9. Latin America BIM Software Market Analysis, Insights and Forecast, 2019-2031
- 9.1. Market Analysis, Insights and Forecast - by Solution Type
- 9.1.1. Software
- 9.1.2. Service
- 9.2. Market Analysis, Insights and Forecast - by Application
- 9.2.1. Commercial
- 9.2.2. Residential
- 9.2.3. Industrial
- 9.2.4. Other Applications
- 9.3. Market Analysis, Insights and Forecast - by End User
- 9.3.1. Contractors
- 9.3.2. Architects
- 9.3.3. Facilities Managers
- 9.3.4. Other End Users
- 9.1. Market Analysis, Insights and Forecast - by Solution Type
- 10. Middle East and Africa BIM Software Market Analysis, Insights and Forecast, 2019-2031
- 10.1. Market Analysis, Insights and Forecast - by Solution Type
- 10.1.1. Software
- 10.1.2. Service
- 10.2. Market Analysis, Insights and Forecast - by Application
- 10.2.1. Commercial
- 10.2.2. Residential
- 10.2.3. Industrial
- 10.2.4. Other Applications
- 10.3. Market Analysis, Insights and Forecast - by End User
- 10.3.1. Contractors
- 10.3.2. Architects
- 10.3.3. Facilities Managers
- 10.3.4. Other End Users
- 10.1. Market Analysis, Insights and Forecast - by Solution Type
- 11. North America BIM Software Market Analysis, Insights and Forecast, 2019-2031
- 11.1. Market Analysis, Insights and Forecast - By Country/Sub-region
- 11.1.1 United States
- 11.1.2 Canada
- 11.1.3 Mexico
- 12. Europe BIM Software Market Analysis, Insights and Forecast, 2019-2031
- 12.1. Market Analysis, Insights and Forecast - By Country/Sub-region
- 12.1.1 Germany
- 12.1.2 United Kingdom
- 12.1.3 France
- 12.1.4 Spain
- 12.1.5 Italy
- 12.1.6 Spain
- 12.1.7 Belgium
- 12.1.8 Netherland
- 12.1.9 Nordics
- 12.1.10 Rest of Europe
- 13. Asia Pacific BIM Software Market Analysis, Insights and Forecast, 2019-2031
- 13.1. Market Analysis, Insights and Forecast - By Country/Sub-region
- 13.1.1 China
- 13.1.2 Japan
- 13.1.3 India
- 13.1.4 South Korea
- 13.1.5 Southeast Asia
- 13.1.6 Australia
- 13.1.7 Indonesia
- 13.1.8 Phillipes
- 13.1.9 Singapore
- 13.1.10 Thailandc
- 13.1.11 Rest of Asia Pacific
- 14. South America BIM Software Market Analysis, Insights and Forecast, 2019-2031
- 14.1. Market Analysis, Insights and Forecast - By Country/Sub-region
- 14.1.1 Brazil
- 14.1.2 Argentina
- 14.1.3 Peru
- 14.1.4 Chile
- 14.1.5 Colombia
- 14.1.6 Ecuador
- 14.1.7 Venezuela
- 14.1.8 Rest of South America
- 15. North America BIM Software Market Analysis, Insights and Forecast, 2019-2031
- 15.1. Market Analysis, Insights and Forecast - By Country/Sub-region
- 15.1.1 United States
- 15.1.2 Canada
- 15.1.3 Mexico
- 16. MEA BIM Software Market Analysis, Insights and Forecast, 2019-2031
- 16.1. Market Analysis, Insights and Forecast - By Country/Sub-region
- 16.1.1 United Arab Emirates
- 16.1.2 Saudi Arabia
- 16.1.3 South Africa
- 16.1.4 Rest of Middle East and Africa
- 17. Competitive Analysis
- 17.1. Global Market Share Analysis 2024
- 17.2. Company Profiles
- 17.2.1 Bimeye Inc
- 17.2.1.1. Overview
- 17.2.1.2. Products
- 17.2.1.3. SWOT Analysis
- 17.2.1.4. Recent Developments
- 17.2.1.5. Financials (Based on Availability)
- 17.2.2 Asite Solutions Ltd
- 17.2.2.1. Overview
- 17.2.2.2. Products
- 17.2.2.3. SWOT Analysis
- 17.2.2.4. Recent Developments
- 17.2.2.5. Financials (Based on Availability)
- 17.2.3 Nemetschek SE
- 17.2.3.1. Overview
- 17.2.3.2. Products
- 17.2.3.3. SWOT Analysis
- 17.2.3.4. Recent Developments
- 17.2.3.5. Financials (Based on Availability)
- 17.2.4 Aveva Group PLC
- 17.2.4.1. Overview
- 17.2.4.2. Products
- 17.2.4.3. SWOT Analysis
- 17.2.4.4. Recent Developments
- 17.2.4.5. Financials (Based on Availability)
- 17.2.5 Autodesk Inc
- 17.2.5.1. Overview
- 17.2.5.2. Products
- 17.2.5.3. SWOT Analysis
- 17.2.5.4. Recent Developments
- 17.2.5.5. Financials (Based on Availability)
- 17.2.6 Topcon Positioning Systems Inc
- 17.2.6.1. Overview
- 17.2.6.2. Products
- 17.2.6.3. SWOT Analysis
- 17.2.6.4. Recent Developments
- 17.2.6.5. Financials (Based on Availability)
- 17.2.7 Dassault Systems SA
- 17.2.7.1. Overview
- 17.2.7.2. Products
- 17.2.7.3. SWOT Analysis
- 17.2.7.4. Recent Developments
- 17.2.7.5. Financials (Based on Availability)
- 17.2.8 Trimble Inc
- 17.2.8.1. Overview
- 17.2.8.2. Products
- 17.2.8.3. SWOT Analysis
- 17.2.8.4. Recent Developments
- 17.2.8.5. Financials (Based on Availability)
- 17.2.9 Bentley Systems Inc
- 17.2.9.1. Overview
- 17.2.9.2. Products
- 17.2.9.3. SWOT Analysis
- 17.2.9.4. Recent Developments
- 17.2.9.5. Financials (Based on Availability)
- 17.2.10 Hexagon AB
- 17.2.10.1. Overview
- 17.2.10.2. Products
- 17.2.10.3. SWOT Analysis
- 17.2.10.4. Recent Developments
- 17.2.10.5. Financials (Based on Availability)
- 17.2.1 Bimeye Inc
List of Figures
- Figure 1: Global BIM Software Market Revenue Breakdown (Million, %) by Region 2024 & 2032
- Figure 2: Global BIM Software Market Volume Breakdown (K Unit, %) by Region 2024 & 2032
- Figure 3: North America BIM Software Market Revenue (Million), by Country 2024 & 2032
- Figure 4: North America BIM Software Market Volume (K Unit), by Country 2024 & 2032
- Figure 5: North America BIM Software Market Revenue Share (%), by Country 2024 & 2032
- Figure 6: North America BIM Software Market Volume Share (%), by Country 2024 & 2032
- Figure 7: Europe BIM Software Market Revenue (Million), by Country 2024 & 2032
- Figure 8: Europe BIM Software Market Volume (K Unit), by Country 2024 & 2032
- Figure 9: Europe BIM Software Market Revenue Share (%), by Country 2024 & 2032
- Figure 10: Europe BIM Software Market Volume Share (%), by Country 2024 & 2032
- Figure 11: Asia Pacific BIM Software Market Revenue (Million), by Country 2024 & 2032
- Figure 12: Asia Pacific BIM Software Market Volume (K Unit), by Country 2024 & 2032
- Figure 13: Asia Pacific BIM Software Market Revenue Share (%), by Country 2024 & 2032
- Figure 14: Asia Pacific BIM Software Market Volume Share (%), by Country 2024 & 2032
- Figure 15: South America BIM Software Market Revenue (Million), by Country 2024 & 2032
- Figure 16: South America BIM Software Market Volume (K Unit), by Country 2024 & 2032
- Figure 17: South America BIM Software Market Revenue Share (%), by Country 2024 & 2032
- Figure 18: South America BIM Software Market Volume Share (%), by Country 2024 & 2032
- Figure 19: North America BIM Software Market Revenue (Million), by Country 2024 & 2032
- Figure 20: North America BIM Software Market Volume (K Unit), by Country 2024 & 2032
- Figure 21: North America BIM Software Market Revenue Share (%), by Country 2024 & 2032
- Figure 22: North America BIM Software Market Volume Share (%), by Country 2024 & 2032
- Figure 23: MEA BIM Software Market Revenue (Million), by Country 2024 & 2032
- Figure 24: MEA BIM Software Market Volume (K Unit), by Country 2024 & 2032
- Figure 25: MEA BIM Software Market Revenue Share (%), by Country 2024 & 2032
- Figure 26: MEA BIM Software Market Volume Share (%), by Country 2024 & 2032
- Figure 27: North America BIM Software Market Revenue (Million), by Solution Type 2024 & 2032
- Figure 28: North America BIM Software Market Volume (K Unit), by Solution Type 2024 & 2032
- Figure 29: North America BIM Software Market Revenue Share (%), by Solution Type 2024 & 2032
- Figure 30: North America BIM Software Market Volume Share (%), by Solution Type 2024 & 2032
- Figure 31: North America BIM Software Market Revenue (Million), by Application 2024 & 2032
- Figure 32: North America BIM Software Market Volume (K Unit), by Application 2024 & 2032
- Figure 33: North America BIM Software Market Revenue Share (%), by Application 2024 & 2032
- Figure 34: North America BIM Software Market Volume Share (%), by Application 2024 & 2032
- Figure 35: North America BIM Software Market Revenue (Million), by End User 2024 & 2032
- Figure 36: North America BIM Software Market Volume (K Unit), by End User 2024 & 2032
- Figure 37: North America BIM Software Market Revenue Share (%), by End User 2024 & 2032
- Figure 38: North America BIM Software Market Volume Share (%), by End User 2024 & 2032
- Figure 39: North America BIM Software Market Revenue (Million), by Country 2024 & 2032
- Figure 40: North America BIM Software Market Volume (K Unit), by Country 2024 & 2032
- Figure 41: North America BIM Software Market Revenue Share (%), by Country 2024 & 2032
- Figure 42: North America BIM Software Market Volume Share (%), by Country 2024 & 2032
- Figure 43: Europe BIM Software Market Revenue (Million), by Solution Type 2024 & 2032
- Figure 44: Europe BIM Software Market Volume (K Unit), by Solution Type 2024 & 2032
- Figure 45: Europe BIM Software Market Revenue Share (%), by Solution Type 2024 & 2032
- Figure 46: Europe BIM Software Market Volume Share (%), by Solution Type 2024 & 2032
- Figure 47: Europe BIM Software Market Revenue (Million), by Application 2024 & 2032
- Figure 48: Europe BIM Software Market Volume (K Unit), by Application 2024 & 2032
- Figure 49: Europe BIM Software Market Revenue Share (%), by Application 2024 & 2032
- Figure 50: Europe BIM Software Market Volume Share (%), by Application 2024 & 2032
- Figure 51: Europe BIM Software Market Revenue (Million), by End User 2024 & 2032
- Figure 52: Europe BIM Software Market Volume (K Unit), by End User 2024 & 2032
- Figure 53: Europe BIM Software Market Revenue Share (%), by End User 2024 & 2032
- Figure 54: Europe BIM Software Market Volume Share (%), by End User 2024 & 2032
- Figure 55: Europe BIM Software Market Revenue (Million), by Country 2024 & 2032
- Figure 56: Europe BIM Software Market Volume (K Unit), by Country 2024 & 2032
- Figure 57: Europe BIM Software Market Revenue Share (%), by Country 2024 & 2032
- Figure 58: Europe BIM Software Market Volume Share (%), by Country 2024 & 2032
- Figure 59: Asia Pacific BIM Software Market Revenue (Million), by Solution Type 2024 & 2032
- Figure 60: Asia Pacific BIM Software Market Volume (K Unit), by Solution Type 2024 & 2032
- Figure 61: Asia Pacific BIM Software Market Revenue Share (%), by Solution Type 2024 & 2032
- Figure 62: Asia Pacific BIM Software Market Volume Share (%), by Solution Type 2024 & 2032
- Figure 63: Asia Pacific BIM Software Market Revenue (Million), by Application 2024 & 2032
- Figure 64: Asia Pacific BIM Software Market Volume (K Unit), by Application 2024 & 2032
- Figure 65: Asia Pacific BIM Software Market Revenue Share (%), by Application 2024 & 2032
- Figure 66: Asia Pacific BIM Software Market Volume Share (%), by Application 2024 & 2032
- Figure 67: Asia Pacific BIM Software Market Revenue (Million), by End User 2024 & 2032
- Figure 68: Asia Pacific BIM Software Market Volume (K Unit), by End User 2024 & 2032
- Figure 69: Asia Pacific BIM Software Market Revenue Share (%), by End User 2024 & 2032
- Figure 70: Asia Pacific BIM Software Market Volume Share (%), by End User 2024 & 2032
- Figure 71: Asia Pacific BIM Software Market Revenue (Million), by Country 2024 & 2032
- Figure 72: Asia Pacific BIM Software Market Volume (K Unit), by Country 2024 & 2032
- Figure 73: Asia Pacific BIM Software Market Revenue Share (%), by Country 2024 & 2032
- Figure 74: Asia Pacific BIM Software Market Volume Share (%), by Country 2024 & 2032
- Figure 75: Latin America BIM Software Market Revenue (Million), by Solution Type 2024 & 2032
- Figure 76: Latin America BIM Software Market Volume (K Unit), by Solution Type 2024 & 2032
- Figure 77: Latin America BIM Software Market Revenue Share (%), by Solution Type 2024 & 2032
- Figure 78: Latin America BIM Software Market Volume Share (%), by Solution Type 2024 & 2032
- Figure 79: Latin America BIM Software Market Revenue (Million), by Application 2024 & 2032
- Figure 80: Latin America BIM Software Market Volume (K Unit), by Application 2024 & 2032
- Figure 81: Latin America BIM Software Market Revenue Share (%), by Application 2024 & 2032
- Figure 82: Latin America BIM Software Market Volume Share (%), by Application 2024 & 2032
- Figure 83: Latin America BIM Software Market Revenue (Million), by End User 2024 & 2032
- Figure 84: Latin America BIM Software Market Volume (K Unit), by End User 2024 & 2032
- Figure 85: Latin America BIM Software Market Revenue Share (%), by End User 2024 & 2032
- Figure 86: Latin America BIM Software Market Volume Share (%), by End User 2024 & 2032
- Figure 87: Latin America BIM Software Market Revenue (Million), by Country 2024 & 2032
- Figure 88: Latin America BIM Software Market Volume (K Unit), by Country 2024 & 2032
- Figure 89: Latin America BIM Software Market Revenue Share (%), by Country 2024 & 2032
- Figure 90: Latin America BIM Software Market Volume Share (%), by Country 2024 & 2032
- Figure 91: Middle East and Africa BIM Software Market Revenue (Million), by Solution Type 2024 & 2032
- Figure 92: Middle East and Africa BIM Software Market Volume (K Unit), by Solution Type 2024 & 2032
- Figure 93: Middle East and Africa BIM Software Market Revenue Share (%), by Solution Type 2024 & 2032
- Figure 94: Middle East and Africa BIM Software Market Volume Share (%), by Solution Type 2024 & 2032
- Figure 95: Middle East and Africa BIM Software Market Revenue (Million), by Application 2024 & 2032
- Figure 96: Middle East and Africa BIM Software Market Volume (K Unit), by Application 2024 & 2032
- Figure 97: Middle East and Africa BIM Software Market Revenue Share (%), by Application 2024 & 2032
- Figure 98: Middle East and Africa BIM Software Market Volume Share (%), by Application 2024 & 2032
- Figure 99: Middle East and Africa BIM Software Market Revenue (Million), by End User 2024 & 2032
- Figure 100: Middle East and Africa BIM Software Market Volume (K Unit), by End User 2024 & 2032
- Figure 101: Middle East and Africa BIM Software Market Revenue Share (%), by End User 2024 & 2032
- Figure 102: Middle East and Africa BIM Software Market Volume Share (%), by End User 2024 & 2032
- Figure 103: Middle East and Africa BIM Software Market Revenue (Million), by Country 2024 & 2032
- Figure 104: Middle East and Africa BIM Software Market Volume (K Unit), by Country 2024 & 2032
- Figure 105: Middle East and Africa BIM Software Market Revenue Share (%), by Country 2024 & 2032
- Figure 106: Middle East and Africa BIM Software Market Volume Share (%), by Country 2024 & 2032
List of Tables
- Table 1: Global BIM Software Market Revenue Million Forecast, by Region 2019 & 2032
- Table 2: Global BIM Software Market Volume K Unit Forecast, by Region 2019 & 2032
- Table 3: Global BIM Software Market Revenue Million Forecast, by Solution Type 2019 & 2032
- Table 4: Global BIM Software Market Volume K Unit Forecast, by Solution Type 2019 & 2032
- Table 5: Global BIM Software Market Revenue Million Forecast, by Application 2019 & 2032
- Table 6: Global BIM Software Market Volume K Unit Forecast, by Application 2019 & 2032
- Table 7: Global BIM Software Market Revenue Million Forecast, by End User 2019 & 2032
- Table 8: Global BIM Software Market Volume K Unit Forecast, by End User 2019 & 2032
- Table 9: Global BIM Software Market Revenue Million Forecast, by Region 2019 & 2032
- Table 10: Global BIM Software Market Volume K Unit Forecast, by Region 2019 & 2032
- Table 11: Global BIM Software Market Revenue Million Forecast, by Country 2019 & 2032
- Table 12: Global BIM Software Market Volume K Unit Forecast, by Country 2019 & 2032
- Table 13: United States BIM Software Market Revenue (Million) Forecast, by Application 2019 & 2032
- Table 14: United States BIM Software Market Volume (K Unit) Forecast, by Application 2019 & 2032
- Table 15: Canada BIM Software Market Revenue (Million) Forecast, by Application 2019 & 2032
- Table 16: Canada BIM Software Market Volume (K Unit) Forecast, by Application 2019 & 2032
- Table 17: Mexico BIM Software Market Revenue (Million) Forecast, by Application 2019 & 2032
- Table 18: Mexico BIM Software Market Volume (K Unit) Forecast, by Application 2019 & 2032
- Table 19: Global BIM Software Market Revenue Million Forecast, by Country 2019 & 2032
- Table 20: Global BIM Software Market Volume K Unit Forecast, by Country 2019 & 2032
- Table 21: Germany BIM Software Market Revenue (Million) Forecast, by Application 2019 & 2032
- Table 22: Germany BIM Software Market Volume (K Unit) Forecast, by Application 2019 & 2032
- Table 23: United Kingdom BIM Software Market Revenue (Million) Forecast, by Application 2019 & 2032
- Table 24: United Kingdom BIM Software Market Volume (K Unit) Forecast, by Application 2019 & 2032
- Table 25: France BIM Software Market Revenue (Million) Forecast, by Application 2019 & 2032
- Table 26: France BIM Software Market Volume (K Unit) Forecast, by Application 2019 & 2032
- Table 27: Spain BIM Software Market Revenue (Million) Forecast, by Application 2019 & 2032
- Table 28: Spain BIM Software Market Volume (K Unit) Forecast, by Application 2019 & 2032
- Table 29: Italy BIM Software Market Revenue (Million) Forecast, by Application 2019 & 2032
- Table 30: Italy BIM Software Market Volume (K Unit) Forecast, by Application 2019 & 2032
- Table 31: Spain BIM Software Market Revenue (Million) Forecast, by Application 2019 & 2032
- Table 32: Spain BIM Software Market Volume (K Unit) Forecast, by Application 2019 & 2032
- Table 33: Belgium BIM Software Market Revenue (Million) Forecast, by Application 2019 & 2032
- Table 34: Belgium BIM Software Market Volume (K Unit) Forecast, by Application 2019 & 2032
- Table 35: Netherland BIM Software Market Revenue (Million) Forecast, by Application 2019 & 2032
- Table 36: Netherland BIM Software Market Volume (K Unit) Forecast, by Application 2019 & 2032
- Table 37: Nordics BIM Software Market Revenue (Million) Forecast, by Application 2019 & 2032
- Table 38: Nordics BIM Software Market Volume (K Unit) Forecast, by Application 2019 & 2032
- Table 39: Rest of Europe BIM Software Market Revenue (Million) Forecast, by Application 2019 & 2032
- Table 40: Rest of Europe BIM Software Market Volume (K Unit) Forecast, by Application 2019 & 2032
- Table 41: Global BIM Software Market Revenue Million Forecast, by Country 2019 & 2032
- Table 42: Global BIM Software Market Volume K Unit Forecast, by Country 2019 & 2032
- Table 43: China BIM Software Market Revenue (Million) Forecast, by Application 2019 & 2032
- Table 44: China BIM Software Market Volume (K Unit) Forecast, by Application 2019 & 2032
- Table 45: Japan BIM Software Market Revenue (Million) Forecast, by Application 2019 & 2032
- Table 46: Japan BIM Software Market Volume (K Unit) Forecast, by Application 2019 & 2032
- Table 47: India BIM Software Market Revenue (Million) Forecast, by Application 2019 & 2032
- Table 48: India BIM Software Market Volume (K Unit) Forecast, by Application 2019 & 2032
- Table 49: South Korea BIM Software Market Revenue (Million) Forecast, by Application 2019 & 2032
- Table 50: South Korea BIM Software Market Volume (K Unit) Forecast, by Application 2019 & 2032
- Table 51: Southeast Asia BIM Software Market Revenue (Million) Forecast, by Application 2019 & 2032
- Table 52: Southeast Asia BIM Software Market Volume (K Unit) Forecast, by Application 2019 & 2032
- Table 53: Australia BIM Software Market Revenue (Million) Forecast, by Application 2019 & 2032
- Table 54: Australia BIM Software Market Volume (K Unit) Forecast, by Application 2019 & 2032
- Table 55: Indonesia BIM Software Market Revenue (Million) Forecast, by Application 2019 & 2032
- Table 56: Indonesia BIM Software Market Volume (K Unit) Forecast, by Application 2019 & 2032
- Table 57: Phillipes BIM Software Market Revenue (Million) Forecast, by Application 2019 & 2032
- Table 58: Phillipes BIM Software Market Volume (K Unit) Forecast, by Application 2019 & 2032
- Table 59: Singapore BIM Software Market Revenue (Million) Forecast, by Application 2019 & 2032
- Table 60: Singapore BIM Software Market Volume (K Unit) Forecast, by Application 2019 & 2032
- Table 61: Thailandc BIM Software Market Revenue (Million) Forecast, by Application 2019 & 2032
- Table 62: Thailandc BIM Software Market Volume (K Unit) Forecast, by Application 2019 & 2032
- Table 63: Rest of Asia Pacific BIM Software Market Revenue (Million) Forecast, by Application 2019 & 2032
- Table 64: Rest of Asia Pacific BIM Software Market Volume (K Unit) Forecast, by Application 2019 & 2032
- Table 65: Global BIM Software Market Revenue Million Forecast, by Country 2019 & 2032
- Table 66: Global BIM Software Market Volume K Unit Forecast, by Country 2019 & 2032
- Table 67: Brazil BIM Software Market Revenue (Million) Forecast, by Application 2019 & 2032
- Table 68: Brazil BIM Software Market Volume (K Unit) Forecast, by Application 2019 & 2032
- Table 69: Argentina BIM Software Market Revenue (Million) Forecast, by Application 2019 & 2032
- Table 70: Argentina BIM Software Market Volume (K Unit) Forecast, by Application 2019 & 2032
- Table 71: Peru BIM Software Market Revenue (Million) Forecast, by Application 2019 & 2032
- Table 72: Peru BIM Software Market Volume (K Unit) Forecast, by Application 2019 & 2032
- Table 73: Chile BIM Software Market Revenue (Million) Forecast, by Application 2019 & 2032
- Table 74: Chile BIM Software Market Volume (K Unit) Forecast, by Application 2019 & 2032
- Table 75: Colombia BIM Software Market Revenue (Million) Forecast, by Application 2019 & 2032
- Table 76: Colombia BIM Software Market Volume (K Unit) Forecast, by Application 2019 & 2032
- Table 77: Ecuador BIM Software Market Revenue (Million) Forecast, by Application 2019 & 2032
- Table 78: Ecuador BIM Software Market Volume (K Unit) Forecast, by Application 2019 & 2032
- Table 79: Venezuela BIM Software Market Revenue (Million) Forecast, by Application 2019 & 2032
- Table 80: Venezuela BIM Software Market Volume (K Unit) Forecast, by Application 2019 & 2032
- Table 81: Rest of South America BIM Software Market Revenue (Million) Forecast, by Application 2019 & 2032
- Table 82: Rest of South America BIM Software Market Volume (K Unit) Forecast, by Application 2019 & 2032
- Table 83: Global BIM Software Market Revenue Million Forecast, by Country 2019 & 2032
- Table 84: Global BIM Software Market Volume K Unit Forecast, by Country 2019 & 2032
- Table 85: United States BIM Software Market Revenue (Million) Forecast, by Application 2019 & 2032
- Table 86: United States BIM Software Market Volume (K Unit) Forecast, by Application 2019 & 2032
- Table 87: Canada BIM Software Market Revenue (Million) Forecast, by Application 2019 & 2032
- Table 88: Canada BIM Software Market Volume (K Unit) Forecast, by Application 2019 & 2032
- Table 89: Mexico BIM Software Market Revenue (Million) Forecast, by Application 2019 & 2032
- Table 90: Mexico BIM Software Market Volume (K Unit) Forecast, by Application 2019 & 2032
- Table 91: Global BIM Software Market Revenue Million Forecast, by Country 2019 & 2032
- Table 92: Global BIM Software Market Volume K Unit Forecast, by Country 2019 & 2032
- Table 93: United Arab Emirates BIM Software Market Revenue (Million) Forecast, by Application 2019 & 2032
- Table 94: United Arab Emirates BIM Software Market Volume (K Unit) Forecast, by Application 2019 & 2032
- Table 95: Saudi Arabia BIM Software Market Revenue (Million) Forecast, by Application 2019 & 2032
- Table 96: Saudi Arabia BIM Software Market Volume (K Unit) Forecast, by Application 2019 & 2032
- Table 97: South Africa BIM Software Market Revenue (Million) Forecast, by Application 2019 & 2032
- Table 98: South Africa BIM Software Market Volume (K Unit) Forecast, by Application 2019 & 2032
- Table 99: Rest of Middle East and Africa BIM Software Market Revenue (Million) Forecast, by Application 2019 & 2032
- Table 100: Rest of Middle East and Africa BIM Software Market Volume (K Unit) Forecast, by Application 2019 & 2032
- Table 101: Global BIM Software Market Revenue Million Forecast, by Solution Type 2019 & 2032
- Table 102: Global BIM Software Market Volume K Unit Forecast, by Solution Type 2019 & 2032
- Table 103: Global BIM Software Market Revenue Million Forecast, by Application 2019 & 2032
- Table 104: Global BIM Software Market Volume K Unit Forecast, by Application 2019 & 2032
- Table 105: Global BIM Software Market Revenue Million Forecast, by End User 2019 & 2032
- Table 106: Global BIM Software Market Volume K Unit Forecast, by End User 2019 & 2032
- Table 107: Global BIM Software Market Revenue Million Forecast, by Country 2019 & 2032
- Table 108: Global BIM Software Market Volume K Unit Forecast, by Country 2019 & 2032
- Table 109: United States BIM Software Market Revenue (Million) Forecast, by Application 2019 & 2032
- Table 110: United States BIM Software Market Volume (K Unit) Forecast, by Application 2019 & 2032
- Table 111: Canada BIM Software Market Revenue (Million) Forecast, by Application 2019 & 2032
- Table 112: Canada BIM Software Market Volume (K Unit) Forecast, by Application 2019 & 2032
- Table 113: Global BIM Software Market Revenue Million Forecast, by Solution Type 2019 & 2032
- Table 114: Global BIM Software Market Volume K Unit Forecast, by Solution Type 2019 & 2032
- Table 115: Global BIM Software Market Revenue Million Forecast, by Application 2019 & 2032
- Table 116: Global BIM Software Market Volume K Unit Forecast, by Application 2019 & 2032
- Table 117: Global BIM Software Market Revenue Million Forecast, by End User 2019 & 2032
- Table 118: Global BIM Software Market Volume K Unit Forecast, by End User 2019 & 2032
- Table 119: Global BIM Software Market Revenue Million Forecast, by Country 2019 & 2032
- Table 120: Global BIM Software Market Volume K Unit Forecast, by Country 2019 & 2032
- Table 121: Germany BIM Software Market Revenue (Million) Forecast, by Application 2019 & 2032
- Table 122: Germany BIM Software Market Volume (K Unit) Forecast, by Application 2019 & 2032
- Table 123: United Kingdom BIM Software Market Revenue (Million) Forecast, by Application 2019 & 2032
- Table 124: United Kingdom BIM Software Market Volume (K Unit) Forecast, by Application 2019 & 2032
- Table 125: France BIM Software Market Revenue (Million) Forecast, by Application 2019 & 2032
- Table 126: France BIM Software Market Volume (K Unit) Forecast, by Application 2019 & 2032
- Table 127: Rest of Europe BIM Software Market Revenue (Million) Forecast, by Application 2019 & 2032
- Table 128: Rest of Europe BIM Software Market Volume (K Unit) Forecast, by Application 2019 & 2032
- Table 129: Global BIM Software Market Revenue Million Forecast, by Solution Type 2019 & 2032
- Table 130: Global BIM Software Market Volume K Unit Forecast, by Solution Type 2019 & 2032
- Table 131: Global BIM Software Market Revenue Million Forecast, by Application 2019 & 2032
- Table 132: Global BIM Software Market Volume K Unit Forecast, by Application 2019 & 2032
- Table 133: Global BIM Software Market Revenue Million Forecast, by End User 2019 & 2032
- Table 134: Global BIM Software Market Volume K Unit Forecast, by End User 2019 & 2032
- Table 135: Global BIM Software Market Revenue Million Forecast, by Country 2019 & 2032
- Table 136: Global BIM Software Market Volume K Unit Forecast, by Country 2019 & 2032
- Table 137: China BIM Software Market Revenue (Million) Forecast, by Application 2019 & 2032
- Table 138: China BIM Software Market Volume (K Unit) Forecast, by Application 2019 & 2032
- Table 139: Japan BIM Software Market Revenue (Million) Forecast, by Application 2019 & 2032
- Table 140: Japan BIM Software Market Volume (K Unit) Forecast, by Application 2019 & 2032
- Table 141: India BIM Software Market Revenue (Million) Forecast, by Application 2019 & 2032
- Table 142: India BIM Software Market Volume (K Unit) Forecast, by Application 2019 & 2032
- Table 143: South Korea BIM Software Market Revenue (Million) Forecast, by Application 2019 & 2032
- Table 144: South Korea BIM Software Market Volume (K Unit) Forecast, by Application 2019 & 2032
- Table 145: Rest of Asia Pacific BIM Software Market Revenue (Million) Forecast, by Application 2019 & 2032
- Table 146: Rest of Asia Pacific BIM Software Market Volume (K Unit) Forecast, by Application 2019 & 2032
- Table 147: Global BIM Software Market Revenue Million Forecast, by Solution Type 2019 & 2032
- Table 148: Global BIM Software Market Volume K Unit Forecast, by Solution Type 2019 & 2032
- Table 149: Global BIM Software Market Revenue Million Forecast, by Application 2019 & 2032
- Table 150: Global BIM Software Market Volume K Unit Forecast, by Application 2019 & 2032
- Table 151: Global BIM Software Market Revenue Million Forecast, by End User 2019 & 2032
- Table 152: Global BIM Software Market Volume K Unit Forecast, by End User 2019 & 2032
- Table 153: Global BIM Software Market Revenue Million Forecast, by Country 2019 & 2032
- Table 154: Global BIM Software Market Volume K Unit Forecast, by Country 2019 & 2032
- Table 155: Global BIM Software Market Revenue Million Forecast, by Solution Type 2019 & 2032
- Table 156: Global BIM Software Market Volume K Unit Forecast, by Solution Type 2019 & 2032
- Table 157: Global BIM Software Market Revenue Million Forecast, by Application 2019 & 2032
- Table 158: Global BIM Software Market Volume K Unit Forecast, by Application 2019 & 2032
- Table 159: Global BIM Software Market Revenue Million Forecast, by End User 2019 & 2032
- Table 160: Global BIM Software Market Volume K Unit Forecast, by End User 2019 & 2032
- Table 161: Global BIM Software Market Revenue Million Forecast, by Country 2019 & 2032
- Table 162: Global BIM Software Market Volume K Unit Forecast, by Country 2019 & 2032
Frequently Asked Questions
1. What is the projected Compound Annual Growth Rate (CAGR) of the BIM Software Market?
The projected CAGR is approximately 13.90%.
2. Which companies are prominent players in the BIM Software Market?
Key companies in the market include Bimeye Inc, Asite Solutions Ltd, Nemetschek SE, Aveva Group PLC, Autodesk Inc, Topcon Positioning Systems Inc, Dassault Systems SA, Trimble Inc, Bentley Systems Inc, Hexagon AB.
3. What are the main segments of the BIM Software Market?
The market segments include Solution Type, Application, End User.
4. Can you provide details about the market size?
The market size is estimated to be USD 8.72 Million as of 2022.
5. What are some drivers contributing to market growth?
Governmental Mandates Promoting the Usage of BIM in Key International Markets; Increased Project Performance and Productivity.
6. What are the notable trends driving market growth?
Governmental Mandates Promoting the Usage of BIM in Key International Markets to Witness High Growth.
7. Are there any restraints impacting market growth?
Cost and Implementation Issues.
8. Can you provide examples of recent developments in the market?
November 2022 - Bentley announced new capabilities of its iTwin Platform, significantly extending the scope and interoperability of infrastructure data that engineering firms and owner-operators can use to create and leverage digital twins in design, construction, and operations workflows where the new iTwin Platform capabilities will power Bentley Infrastructure Cloud, a set of solutions that span the end-to-end infrastructure lifecycle and value chain, encompassing ProjectWise, SYNCHRO, and AssetWise.
9. What pricing options are available for accessing the report?
Pricing options include single-user, multi-user, and enterprise licenses priced at USD 4750, USD 5250, and USD 8750 respectively.
10. Is the market size provided in terms of value or volume?
The market size is provided in terms of value, measured in Million and volume, measured in K Unit.
11. Are there any specific market keywords associated with the report?
Yes, the market keyword associated with the report is "BIM Software Market," which aids in identifying and referencing the specific market segment covered.
12. How do I determine which pricing option suits my needs best?
The pricing options vary based on user requirements and access needs. Individual users may opt for single-user licenses, while businesses requiring broader access may choose multi-user or enterprise licenses for cost-effective access to the report.
13. Are there any additional resources or data provided in the BIM Software Market report?
While the report offers comprehensive insights, it's advisable to review the specific contents or supplementary materials provided to ascertain if additional resources or data are available.
14. How can I stay updated on further developments or reports in the BIM Software Market?
To stay informed about further developments, trends, and reports in the BIM Software Market, consider subscribing to industry newsletters, following relevant companies and organizations, or regularly checking reputable industry news sources and publications.
Methodology
Step 1 - Identification of Relevant Samples Size from Population Database


Step 2 - Approaches for Defining Global Market Size (Value, Volume* & Price*)

Note*: In applicable scenarios
Step 3 - Data Sources
Primary Research
- Web Analytics
- Survey Reports
- Research Institute
- Latest Research Reports
- Opinion Leaders
Secondary Research
- Annual Reports
- White Paper
- Latest Press Release
- Industry Association
- Paid Database
- Investor Presentations

Step 4 - Data Triangulation
Involves using different sources of information in order to increase the validity of a study
These sources are likely to be stakeholders in a program - participants, other researchers, program staff, other community members, and so on.
Then we put all data in single framework & apply various statistical tools to find out the dynamic on the market.
During the analysis stage, feedback from the stakeholder groups would be compared to determine areas of agreement as well as areas of divergence


