Key Insights
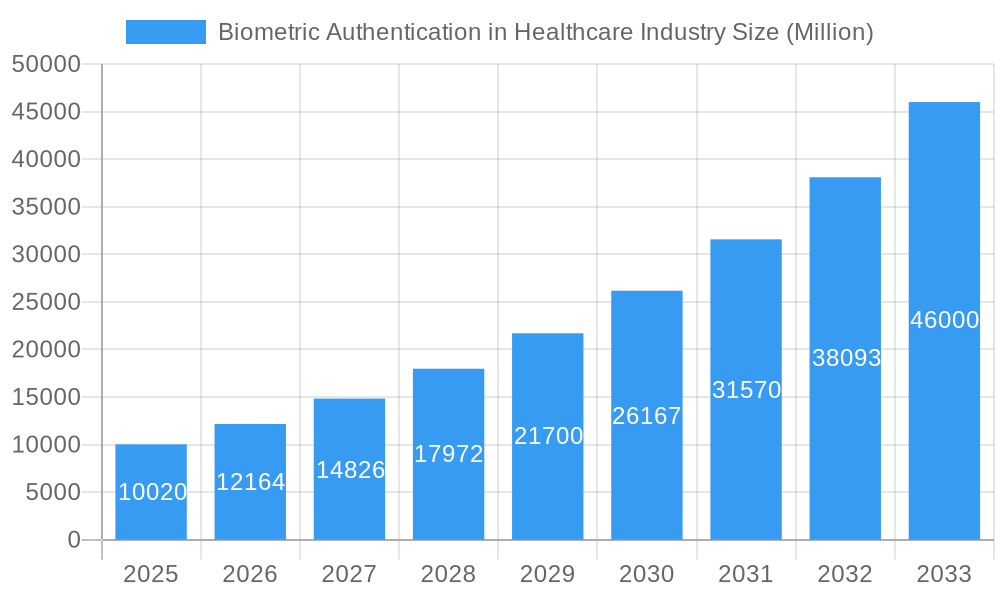
The global biometric authentication market in healthcare is experiencing robust growth, projected to reach \$10.02 billion in 2025 and exhibiting a Compound Annual Growth Rate (CAGR) of 21.29% from 2025 to 2033. This expansion is fueled by several key factors. The increasing need for enhanced patient safety and data security drives the adoption of biometric technologies for secure access control to sensitive medical records and patient information. Rising instances of medical identity theft and the imperative for robust patient identification and tracking systems further bolster market growth. Furthermore, the expanding telehealth and remote patient monitoring sectors are creating significant demand for secure authentication methods, contributing substantially to market expansion. The integration of biometric authentication into Electronic Health Records (EHR) systems is streamlining workflows and improving operational efficiency, making it a compelling solution for healthcare providers. Technological advancements, such as improved accuracy and speed of biometric systems, alongside decreasing costs, are also contributing to wider adoption.
Biometric Authentication in Healthcare Industry Market Size (In Billion)
Market segmentation reveals that multi-factor authentication is the dominant technology segment, owing to its enhanced security features. In terms of application, medical record and data center security, along with patient identification and tracking, are the leading segments. Hospitals and clinics constitute the largest end-user segment, reflecting the concentrated demand within established healthcare settings. Geographically, North America currently holds a significant market share due to advanced healthcare infrastructure and early adoption of biometric technologies. However, Asia Pacific is poised for rapid growth driven by increasing healthcare spending and technological advancements in emerging economies like India and China. The market's continued growth trajectory is expected to be influenced by factors like stringent regulatory compliance requirements around data privacy (like HIPAA), evolving cybersecurity threats, and the ongoing digital transformation within the healthcare industry.
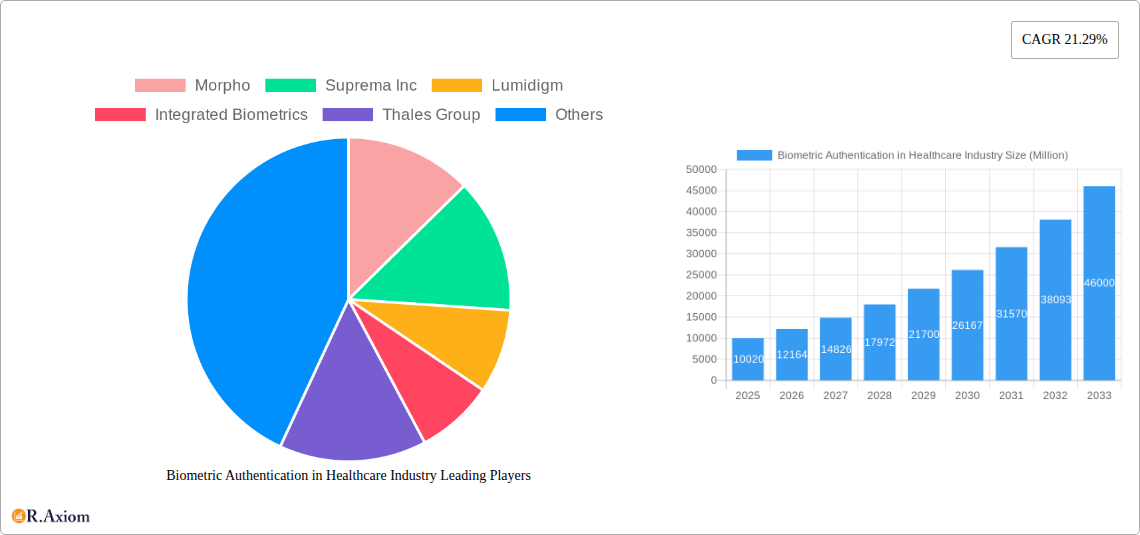
Biometric Authentication in Healthcare Industry Company Market Share
Biometric Authentication in Healthcare Industry: A Comprehensive Market Report (2019-2033)
This in-depth report provides a comprehensive analysis of the Biometric Authentication in Healthcare Industry market, offering invaluable insights for stakeholders, investors, and industry professionals. Covering the period from 2019 to 2033, with a focus on 2025, this report projects a market valued at $XX Million by 2033, exhibiting a Compound Annual Growth Rate (CAGR) of XX% during the forecast period (2025-2033). The report leverages extensive market research, incorporating data from the historical period (2019-2024) and the base year (2025) to provide reliable future predictions.
Biometric Authentication in Healthcare Industry Market Concentration & Innovation
The Biometric Authentication in Healthcare Industry is characterized by a moderately concentrated market structure, with several key players holding significant market share. Companies like Morpho, Suprema Inc, Lumidigm, Integrated Biometrics, Thales Group, and Fujitsu Limited collectively account for an estimated XX% of the global market in 2025. However, the market also exhibits significant innovation, driven by advancements in biometric technologies, increasing demand for secure healthcare solutions, and stringent regulatory frameworks mandating improved data security. The market share distribution is dynamic, with smaller players like Facetec Inc, Crossmatch Technologies Inc, Bio-Key International Inc, Imprivata Inc, NEC Corporation, and Zkteco Inc competing aggressively through product differentiation and strategic partnerships.
Mergers and acquisitions (M&A) activity within the industry is expected to increase, potentially driving further consolidation. In the past five years, M&A deal values have totaled approximately $XX Million, with larger players acquiring smaller companies to expand their product portfolios and market reach. This trend is expected to continue, particularly as the demand for advanced biometric solutions in healthcare grows. Factors such as the growing adoption of cloud-based healthcare solutions, increasing cybersecurity threats, and the rising prevalence of telehealth are bolstering the demand for robust and reliable biometric authentication systems. The regulatory landscape is also a significant factor, with increasing government regulations driving investment in secure authentication solutions. Product substitutes, such as traditional password-based systems, are increasingly becoming less attractive due to their vulnerability to breaches. End-user trends show a clear preference for seamless, secure, and user-friendly biometric authentication solutions that improve efficiency and enhance patient safety.
Biometric Authentication in Healthcare Industry Industry Trends & Insights
The Biometric Authentication in Healthcare Industry is experiencing robust growth, driven by several key factors. The increasing prevalence of electronic health records (EHRs) and the need for secure access to sensitive patient data is a major catalyst. The market is also witnessing technological disruptions, with the emergence of advanced biometric technologies such as facial recognition, iris scanning, and fingerprint authentication, offering higher levels of accuracy and security than traditional methods. Consumer preferences are shifting towards contactless and user-friendly biometric authentication systems, further accelerating market adoption. The competitive landscape is dynamic, with both established players and new entrants vying for market share through continuous innovation and strategic partnerships.
The global market is expected to reach $XX Million by 2033, exhibiting a CAGR of XX%. This substantial growth is attributed to factors such as rising healthcare expenditure, increasing adoption of telehealth, and the growing demand for secure remote patient monitoring. Market penetration of biometric authentication systems in the healthcare sector is projected to increase from XX% in 2025 to XX% by 2033. This significant increase is driven by factors including improved technology, falling costs, and increasing awareness of the importance of data security in the healthcare industry. The industry is facing both opportunities and challenges. Opportunities include the rising popularity of wearable biometric devices, the development of innovative authentication solutions, and an expanding market for remote healthcare services. Challenges include stringent regulations and security concerns, the high cost of implementation, and the potential for privacy violations.
Dominant Markets & Segments in Biometric Authentication in Healthcare Industry
Leading Region/Country: North America currently dominates the Biometric Authentication in Healthcare Industry market, driven by high adoption rates of advanced technologies, stringent data privacy regulations, and significant investments in healthcare IT infrastructure. This region is expected to maintain its leadership position throughout the forecast period.
Dominant Segments:
By Technology: Multi-factor authentication is the fastest-growing segment, fueled by the demand for enhanced security and reliability. Single-factor authentication maintains a significant market share but faces challenges due to the increasing need for layered security. Other technologies, such as behavioral biometrics, are also gaining traction.
By Application: Medical record and data center security is the largest application segment, driven by the critical need to protect sensitive patient data and healthcare infrastructure. Patient identification and tracking and care provider authentication are also key application areas with significant growth potential. Home/remote patient monitoring is emerging as a high-growth segment, fueled by the increasing adoption of telehealth services.
By End User: Hospitals/Clinics represent the largest end-user segment, followed by research and clinical laboratories. Other end users, such as pharmaceutical companies and insurance providers, are also increasing their adoption of biometric authentication systems.
Key Drivers: Strong economic growth in developed and developing nations, supportive government policies promoting digital health initiatives, and advancements in biometric technology are key drivers for market expansion. The development of robust and reliable healthcare infrastructure is also crucial for the broader adoption of biometric authentication systems.
Biometric Authentication in Healthcare Industry Product Developments
The Biometric Authentication in Healthcare Industry showcases rapid product innovation. Recent developments include improved accuracy and speed of biometric recognition, enhanced security features such as liveness detection, and the integration of biometric authentication with existing healthcare IT systems. Wearable biometric devices are gaining popularity, enabling continuous monitoring of patient health and providing convenient authentication options. These advancements are tailored to meet the diverse needs of healthcare providers, from streamlining access control to improving patient identification and remote monitoring. The integration of artificial intelligence (AI) and machine learning (ML) is further enhancing the accuracy, efficiency, and security of biometric authentication systems, driving increased market adoption.
Report Scope & Segmentation Analysis
This report provides a comprehensive segmentation analysis of the Biometric Authentication in Healthcare Industry market, broken down by technology (single-factor, multi-factor, and other technologies), application (medical record and data center security, patient identification and tracking, care provider authentication, home/remote patient monitoring, and other applications), and end-user (hospital/clinics, research and clinical laboratory, and other end users). Each segment's growth projection, market size, and competitive dynamics are thoroughly analyzed, providing a detailed understanding of the market landscape. Growth projections vary across segments, reflecting differences in technological maturity, regulatory environments, and market demand. Competitive dynamics are shaped by factors like technological innovation, strategic partnerships, and regulatory compliance.
Key Drivers of Biometric Authentication in Healthcare Industry Growth
Several factors are driving the growth of the Biometric Authentication in Healthcare Industry. These include the increasing need for secure access to sensitive patient data, the rising adoption of electronic health records (EHRs), and the growing demand for improved patient safety and security. Government regulations mandating enhanced data security and the increasing prevalence of telehealth are also significant drivers. The development of more accurate, reliable, and user-friendly biometric authentication technologies further contributes to market growth.
Challenges in the Biometric Authentication in Healthcare Industry Sector
The Biometric Authentication in Healthcare Industry faces several challenges. Regulatory hurdles, particularly around data privacy and security, can hinder market adoption. Supply chain disruptions can impact the availability and cost of biometric authentication systems. Intense competition among established players and emerging companies creates pressure on pricing and profitability. Furthermore, concerns about data breaches and the potential for misuse of biometric data pose significant risks. These challenges represent substantial headwinds, but innovation and stringent regulatory compliance are expected to mitigate these risks and support continued market expansion.
Emerging Opportunities in Biometric Authentication in Healthcare Industry
The Biometric Authentication in Healthcare Industry presents numerous opportunities. The growth of telehealth and remote patient monitoring creates demand for secure authentication systems. Emerging biometric technologies, such as behavioral biometrics and multi-modal authentication, offer enhanced security and usability. The increasing integration of biometric authentication into wearable devices expands the potential applications and user base. Expansion into new geographical markets, particularly in developing countries, provides significant growth potential.
Leading Players in the Biometric Authentication in Healthcare Industry Market
- Morpho
- Suprema Inc
- Lumidigm
- Integrated Biometrics
- Thales Group
- Fujitsu Limited
- Facetec Inc
- Crossmatch Technologies Inc
- Bio-Key International Inc
- Imprivata Inc
- NEC Corporation
- Zkteco Inc
Key Developments in Biometric Authentication in Healthcare Industry Industry
- March 2022: BioIntelliSense launched its medical-grade BioButton Rechargeable wearable device, enabling continuous multi-parameter monitoring of vital signs for up to 30 days. This development significantly impacted the home/remote patient monitoring segment.
- January 2022: Mitsubishi Electric Corporation unveiled HealthCam, a facial recognition health monitoring system capable of tracking various health indicators. This innovation enhanced the capabilities of patient monitoring and remote healthcare applications.
Strategic Outlook for Biometric Authentication in Healthcare Industry Market
The Biometric Authentication in Healthcare Industry is poised for substantial growth, driven by technological advancements, rising demand for secure healthcare solutions, and increasing regulatory compliance requirements. The market's future potential is significant, with continued expansion across various segments and geographical regions. Companies that prioritize innovation, strategic partnerships, and robust security measures are well-positioned to capitalize on this growth opportunity. The focus on interoperability and integration with existing healthcare IT systems will further drive market expansion.
Biometric Authentication in Healthcare Industry Segmentation
-
1. Technology
- 1.1. Single-factor Authentication
- 1.2. Multi-factor Authentication
- 1.3. Other Technologies
-
2. Application
- 2.1. Medical Record and Data Center Security
- 2.2. Patient Identification and Tracking
- 2.3. Care Provider Authentication
- 2.4. Home/Remote Patient Monitoring
- 2.5. Other Applications
-
3. End User
- 3.1. Hospital/Clinics
- 3.2. Research and Clinical Laboratory
- 3.3. Other End Users
Biometric Authentication in Healthcare Industry Segmentation By Geography
-
1. North America
- 1.1. United States
- 1.2. Canada
- 1.3. Mexico
-
2. Europe
- 2.1. Germany
- 2.2. United Kingdom
- 2.3. France
- 2.4. Italy
- 2.5. Spain
- 2.6. Rest of Europe
-
3. Asia Pacific
- 3.1. China
- 3.2. Japan
- 3.3. India
- 3.4. Australia
- 3.5. South Korea
- 3.6. Rest of Asia Pacific
-
4. Middle East and Africa
- 4.1. GCC
- 4.2. South Africa
- 4.3. Rest of Middle East and Africa
-
5. South America
- 5.1. Brazil
- 5.2. Argentina
- 5.3. Rest of South America
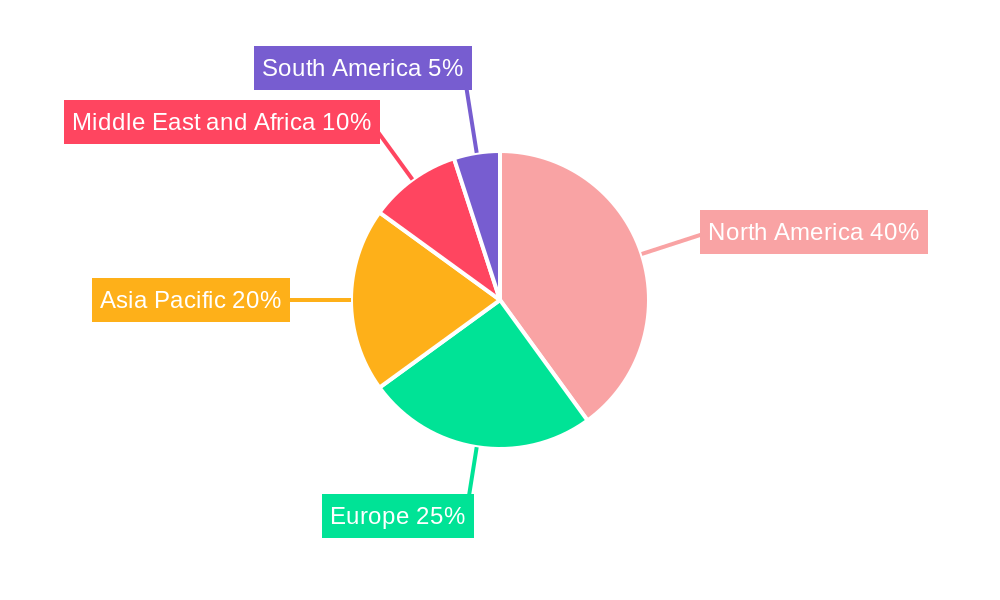
Biometric Authentication in Healthcare Industry Regional Market Share
Geographic Coverage of Biometric Authentication in Healthcare Industry
Biometric Authentication in Healthcare Industry REPORT HIGHLIGHTS
| Aspects | Details |
|---|---|
| Study Period | 2020-2034 |
| Base Year | 2025 |
| Estimated Year | 2026 |
| Forecast Period | 2026-2034 |
| Historical Period | 2020-2025 |
| Growth Rate | CAGR of 21.29% from 2020-2034 |
| Segmentation |
|
Table of Contents
- 1. Introduction
- 1.1. Research Scope
- 1.2. Market Segmentation
- 1.3. Research Objective
- 1.4. Definitions and Assumptions
- 2. Executive Summary
- 2.1. Market Snapshot
- 3. Market Dynamics
- 3.1. Market Drivers
- 3.2. Market Restrains
- 3.3. Market Trends
- 3.4. Market Opportunities
- 4. Market Factor Analysis
- 4.1. Porters Five Forces
- 4.1.1. Bargaining Power of Suppliers
- 4.1.2. Bargaining Power of Buyers
- 4.1.3. Threat of New Entrants
- 4.1.4. Threat of Substitutes
- 4.1.5. Competitive Rivalry
- 4.2. PESTEL analysis
- 4.3. BCG Analysis
- 4.3.1. Stars (High Growth, High Market Share)
- 4.3.2. Cash Cows (Low Growth, High Market Share)
- 4.3.3. Question Mark (High Growth, Low Market Share)
- 4.3.4. Dogs (Low Growth, Low Market Share)
- 4.4. Ansoff Matrix Analysis
- 4.5. Supply Chain Analysis
- 4.6. Regulatory Landscape
- 4.7. Current Market Potential and Opportunity Assessment (TAM–SAM–SOM Framework)
- 4.8. RAX Analyst Note
- 4.1. Porters Five Forces
- 5. Market Analysis, Insights and Forecast 2021-2033
- 5.1. Market Analysis, Insights and Forecast - by Technology
- 5.1.1. Single-factor Authentication
- 5.1.2. Multi-factor Authentication
- 5.1.3. Other Technologies
- 5.2. Market Analysis, Insights and Forecast - by Application
- 5.2.1. Medical Record and Data Center Security
- 5.2.2. Patient Identification and Tracking
- 5.2.3. Care Provider Authentication
- 5.2.4. Home/Remote Patient Monitoring
- 5.2.5. Other Applications
- 5.3. Market Analysis, Insights and Forecast - by End User
- 5.3.1. Hospital/Clinics
- 5.3.2. Research and Clinical Laboratory
- 5.3.3. Other End Users
- 5.4. Market Analysis, Insights and Forecast - by Region
- 5.4.1. North America
- 5.4.2. Europe
- 5.4.3. Asia Pacific
- 5.4.4. Middle East and Africa
- 5.4.5. South America
- 5.1. Market Analysis, Insights and Forecast - by Technology
- 6. Global Biometric Authentication in Healthcare Industry Analysis, Insights and Forecast, 2021-2033
- 6.1. Market Analysis, Insights and Forecast - by Technology
- 6.1.1. Single-factor Authentication
- 6.1.2. Multi-factor Authentication
- 6.1.3. Other Technologies
- 6.2. Market Analysis, Insights and Forecast - by Application
- 6.2.1. Medical Record and Data Center Security
- 6.2.2. Patient Identification and Tracking
- 6.2.3. Care Provider Authentication
- 6.2.4. Home/Remote Patient Monitoring
- 6.2.5. Other Applications
- 6.3. Market Analysis, Insights and Forecast - by End User
- 6.3.1. Hospital/Clinics
- 6.3.2. Research and Clinical Laboratory
- 6.3.3. Other End Users
- 6.1. Market Analysis, Insights and Forecast - by Technology
- 7. North America Biometric Authentication in Healthcare Industry Analysis, Insights and Forecast, 2020-2032
- 7.1. Market Analysis, Insights and Forecast - by Technology
- 7.1.1. Single-factor Authentication
- 7.1.2. Multi-factor Authentication
- 7.1.3. Other Technologies
- 7.2. Market Analysis, Insights and Forecast - by Application
- 7.2.1. Medical Record and Data Center Security
- 7.2.2. Patient Identification and Tracking
- 7.2.3. Care Provider Authentication
- 7.2.4. Home/Remote Patient Monitoring
- 7.2.5. Other Applications
- 7.3. Market Analysis, Insights and Forecast - by End User
- 7.3.1. Hospital/Clinics
- 7.3.2. Research and Clinical Laboratory
- 7.3.3. Other End Users
- 7.1. Market Analysis, Insights and Forecast - by Technology
- 8. Europe Biometric Authentication in Healthcare Industry Analysis, Insights and Forecast, 2020-2032
- 8.1. Market Analysis, Insights and Forecast - by Technology
- 8.1.1. Single-factor Authentication
- 8.1.2. Multi-factor Authentication
- 8.1.3. Other Technologies
- 8.2. Market Analysis, Insights and Forecast - by Application
- 8.2.1. Medical Record and Data Center Security
- 8.2.2. Patient Identification and Tracking
- 8.2.3. Care Provider Authentication
- 8.2.4. Home/Remote Patient Monitoring
- 8.2.5. Other Applications
- 8.3. Market Analysis, Insights and Forecast - by End User
- 8.3.1. Hospital/Clinics
- 8.3.2. Research and Clinical Laboratory
- 8.3.3. Other End Users
- 8.1. Market Analysis, Insights and Forecast - by Technology
- 9. Asia Pacific Biometric Authentication in Healthcare Industry Analysis, Insights and Forecast, 2020-2032
- 9.1. Market Analysis, Insights and Forecast - by Technology
- 9.1.1. Single-factor Authentication
- 9.1.2. Multi-factor Authentication
- 9.1.3. Other Technologies
- 9.2. Market Analysis, Insights and Forecast - by Application
- 9.2.1. Medical Record and Data Center Security
- 9.2.2. Patient Identification and Tracking
- 9.2.3. Care Provider Authentication
- 9.2.4. Home/Remote Patient Monitoring
- 9.2.5. Other Applications
- 9.3. Market Analysis, Insights and Forecast - by End User
- 9.3.1. Hospital/Clinics
- 9.3.2. Research and Clinical Laboratory
- 9.3.3. Other End Users
- 9.1. Market Analysis, Insights and Forecast - by Technology
- 10. Middle East and Africa Biometric Authentication in Healthcare Industry Analysis, Insights and Forecast, 2020-2032
- 10.1. Market Analysis, Insights and Forecast - by Technology
- 10.1.1. Single-factor Authentication
- 10.1.2. Multi-factor Authentication
- 10.1.3. Other Technologies
- 10.2. Market Analysis, Insights and Forecast - by Application
- 10.2.1. Medical Record and Data Center Security
- 10.2.2. Patient Identification and Tracking
- 10.2.3. Care Provider Authentication
- 10.2.4. Home/Remote Patient Monitoring
- 10.2.5. Other Applications
- 10.3. Market Analysis, Insights and Forecast - by End User
- 10.3.1. Hospital/Clinics
- 10.3.2. Research and Clinical Laboratory
- 10.3.3. Other End Users
- 10.1. Market Analysis, Insights and Forecast - by Technology
- 11. South America Biometric Authentication in Healthcare Industry Analysis, Insights and Forecast, 2020-2032
- 11.1. Market Analysis, Insights and Forecast - by Technology
- 11.1.1. Single-factor Authentication
- 11.1.2. Multi-factor Authentication
- 11.1.3. Other Technologies
- 11.2. Market Analysis, Insights and Forecast - by Application
- 11.2.1. Medical Record and Data Center Security
- 11.2.2. Patient Identification and Tracking
- 11.2.3. Care Provider Authentication
- 11.2.4. Home/Remote Patient Monitoring
- 11.2.5. Other Applications
- 11.3. Market Analysis, Insights and Forecast - by End User
- 11.3.1. Hospital/Clinics
- 11.3.2. Research and Clinical Laboratory
- 11.3.3. Other End Users
- 11.1. Market Analysis, Insights and Forecast - by Technology
- 12. Competitive Analysis
- 12.1. Company Profiles
- 12.1.1 Morpho
- 12.1.1.1. Company Overview
- 12.1.1.2. Products
- 12.1.1.3. Company Financials
- 12.1.1.4. SWOT Analysis
- 12.1.2 Suprema Inc
- 12.1.2.1. Company Overview
- 12.1.2.2. Products
- 12.1.2.3. Company Financials
- 12.1.2.4. SWOT Analysis
- 12.1.3 Lumidigm
- 12.1.3.1. Company Overview
- 12.1.3.2. Products
- 12.1.3.3. Company Financials
- 12.1.3.4. SWOT Analysis
- 12.1.4 Integrated Biometrics
- 12.1.4.1. Company Overview
- 12.1.4.2. Products
- 12.1.4.3. Company Financials
- 12.1.4.4. SWOT Analysis
- 12.1.5 Thales Group
- 12.1.5.1. Company Overview
- 12.1.5.2. Products
- 12.1.5.3. Company Financials
- 12.1.5.4. SWOT Analysis
- 12.1.6 Fujitsu Limited
- 12.1.6.1. Company Overview
- 12.1.6.2. Products
- 12.1.6.3. Company Financials
- 12.1.6.4. SWOT Analysis
- 12.1.7 Facetec Inc
- 12.1.7.1. Company Overview
- 12.1.7.2. Products
- 12.1.7.3. Company Financials
- 12.1.7.4. SWOT Analysis
- 12.1.8 Crossmatch Technologies Inc
- 12.1.8.1. Company Overview
- 12.1.8.2. Products
- 12.1.8.3. Company Financials
- 12.1.8.4. SWOT Analysis
- 12.1.9 Bio-Key International Inc
- 12.1.9.1. Company Overview
- 12.1.9.2. Products
- 12.1.9.3. Company Financials
- 12.1.9.4. SWOT Analysis
- 12.1.10 Imprivata Inc
- 12.1.10.1. Company Overview
- 12.1.10.2. Products
- 12.1.10.3. Company Financials
- 12.1.10.4. SWOT Analysis
- 12.1.11 NEC Corporation
- 12.1.11.1. Company Overview
- 12.1.11.2. Products
- 12.1.11.3. Company Financials
- 12.1.11.4. SWOT Analysis
- 12.1.12 Zkteco Inc
- 12.1.12.1. Company Overview
- 12.1.12.2. Products
- 12.1.12.3. Company Financials
- 12.1.12.4. SWOT Analysis
- 12.1.1 Morpho
- 12.2. Market Entropy
- 12.2.1 Company's Key Areas Served
- 12.2.2 Recent Developments
- 12.3. Company Market Share Analysis 2025
- 12.3.1 Top 5 Companies Market Share Analysis
- 12.3.2 Top 3 Companies Market Share Analysis
- 12.4. List of Potential Customers
- 13. Research Methodology
List of Figures
- Figure 1: Global Biometric Authentication in Healthcare Industry Revenue Breakdown (Million, %) by Region 2025 & 2033
- Figure 2: Global Biometric Authentication in Healthcare Industry Volume Breakdown (K Unit, %) by Region 2025 & 2033
- Figure 3: North America Biometric Authentication in Healthcare Industry Revenue (Million), by Technology 2025 & 2033
- Figure 4: North America Biometric Authentication in Healthcare Industry Volume (K Unit), by Technology 2025 & 2033
- Figure 5: North America Biometric Authentication in Healthcare Industry Revenue Share (%), by Technology 2025 & 2033
- Figure 6: North America Biometric Authentication in Healthcare Industry Volume Share (%), by Technology 2025 & 2033
- Figure 7: North America Biometric Authentication in Healthcare Industry Revenue (Million), by Application 2025 & 2033
- Figure 8: North America Biometric Authentication in Healthcare Industry Volume (K Unit), by Application 2025 & 2033
- Figure 9: North America Biometric Authentication in Healthcare Industry Revenue Share (%), by Application 2025 & 2033
- Figure 10: North America Biometric Authentication in Healthcare Industry Volume Share (%), by Application 2025 & 2033
- Figure 11: North America Biometric Authentication in Healthcare Industry Revenue (Million), by End User 2025 & 2033
- Figure 12: North America Biometric Authentication in Healthcare Industry Volume (K Unit), by End User 2025 & 2033
- Figure 13: North America Biometric Authentication in Healthcare Industry Revenue Share (%), by End User 2025 & 2033
- Figure 14: North America Biometric Authentication in Healthcare Industry Volume Share (%), by End User 2025 & 2033
- Figure 15: North America Biometric Authentication in Healthcare Industry Revenue (Million), by Country 2025 & 2033
- Figure 16: North America Biometric Authentication in Healthcare Industry Volume (K Unit), by Country 2025 & 2033
- Figure 17: North America Biometric Authentication in Healthcare Industry Revenue Share (%), by Country 2025 & 2033
- Figure 18: North America Biometric Authentication in Healthcare Industry Volume Share (%), by Country 2025 & 2033
- Figure 19: Europe Biometric Authentication in Healthcare Industry Revenue (Million), by Technology 2025 & 2033
- Figure 20: Europe Biometric Authentication in Healthcare Industry Volume (K Unit), by Technology 2025 & 2033
- Figure 21: Europe Biometric Authentication in Healthcare Industry Revenue Share (%), by Technology 2025 & 2033
- Figure 22: Europe Biometric Authentication in Healthcare Industry Volume Share (%), by Technology 2025 & 2033
- Figure 23: Europe Biometric Authentication in Healthcare Industry Revenue (Million), by Application 2025 & 2033
- Figure 24: Europe Biometric Authentication in Healthcare Industry Volume (K Unit), by Application 2025 & 2033
- Figure 25: Europe Biometric Authentication in Healthcare Industry Revenue Share (%), by Application 2025 & 2033
- Figure 26: Europe Biometric Authentication in Healthcare Industry Volume Share (%), by Application 2025 & 2033
- Figure 27: Europe Biometric Authentication in Healthcare Industry Revenue (Million), by End User 2025 & 2033
- Figure 28: Europe Biometric Authentication in Healthcare Industry Volume (K Unit), by End User 2025 & 2033
- Figure 29: Europe Biometric Authentication in Healthcare Industry Revenue Share (%), by End User 2025 & 2033
- Figure 30: Europe Biometric Authentication in Healthcare Industry Volume Share (%), by End User 2025 & 2033
- Figure 31: Europe Biometric Authentication in Healthcare Industry Revenue (Million), by Country 2025 & 2033
- Figure 32: Europe Biometric Authentication in Healthcare Industry Volume (K Unit), by Country 2025 & 2033
- Figure 33: Europe Biometric Authentication in Healthcare Industry Revenue Share (%), by Country 2025 & 2033
- Figure 34: Europe Biometric Authentication in Healthcare Industry Volume Share (%), by Country 2025 & 2033
- Figure 35: Asia Pacific Biometric Authentication in Healthcare Industry Revenue (Million), by Technology 2025 & 2033
- Figure 36: Asia Pacific Biometric Authentication in Healthcare Industry Volume (K Unit), by Technology 2025 & 2033
- Figure 37: Asia Pacific Biometric Authentication in Healthcare Industry Revenue Share (%), by Technology 2025 & 2033
- Figure 38: Asia Pacific Biometric Authentication in Healthcare Industry Volume Share (%), by Technology 2025 & 2033
- Figure 39: Asia Pacific Biometric Authentication in Healthcare Industry Revenue (Million), by Application 2025 & 2033
- Figure 40: Asia Pacific Biometric Authentication in Healthcare Industry Volume (K Unit), by Application 2025 & 2033
- Figure 41: Asia Pacific Biometric Authentication in Healthcare Industry Revenue Share (%), by Application 2025 & 2033
- Figure 42: Asia Pacific Biometric Authentication in Healthcare Industry Volume Share (%), by Application 2025 & 2033
- Figure 43: Asia Pacific Biometric Authentication in Healthcare Industry Revenue (Million), by End User 2025 & 2033
- Figure 44: Asia Pacific Biometric Authentication in Healthcare Industry Volume (K Unit), by End User 2025 & 2033
- Figure 45: Asia Pacific Biometric Authentication in Healthcare Industry Revenue Share (%), by End User 2025 & 2033
- Figure 46: Asia Pacific Biometric Authentication in Healthcare Industry Volume Share (%), by End User 2025 & 2033
- Figure 47: Asia Pacific Biometric Authentication in Healthcare Industry Revenue (Million), by Country 2025 & 2033
- Figure 48: Asia Pacific Biometric Authentication in Healthcare Industry Volume (K Unit), by Country 2025 & 2033
- Figure 49: Asia Pacific Biometric Authentication in Healthcare Industry Revenue Share (%), by Country 2025 & 2033
- Figure 50: Asia Pacific Biometric Authentication in Healthcare Industry Volume Share (%), by Country 2025 & 2033
- Figure 51: Middle East and Africa Biometric Authentication in Healthcare Industry Revenue (Million), by Technology 2025 & 2033
- Figure 52: Middle East and Africa Biometric Authentication in Healthcare Industry Volume (K Unit), by Technology 2025 & 2033
- Figure 53: Middle East and Africa Biometric Authentication in Healthcare Industry Revenue Share (%), by Technology 2025 & 2033
- Figure 54: Middle East and Africa Biometric Authentication in Healthcare Industry Volume Share (%), by Technology 2025 & 2033
- Figure 55: Middle East and Africa Biometric Authentication in Healthcare Industry Revenue (Million), by Application 2025 & 2033
- Figure 56: Middle East and Africa Biometric Authentication in Healthcare Industry Volume (K Unit), by Application 2025 & 2033
- Figure 57: Middle East and Africa Biometric Authentication in Healthcare Industry Revenue Share (%), by Application 2025 & 2033
- Figure 58: Middle East and Africa Biometric Authentication in Healthcare Industry Volume Share (%), by Application 2025 & 2033
- Figure 59: Middle East and Africa Biometric Authentication in Healthcare Industry Revenue (Million), by End User 2025 & 2033
- Figure 60: Middle East and Africa Biometric Authentication in Healthcare Industry Volume (K Unit), by End User 2025 & 2033
- Figure 61: Middle East and Africa Biometric Authentication in Healthcare Industry Revenue Share (%), by End User 2025 & 2033
- Figure 62: Middle East and Africa Biometric Authentication in Healthcare Industry Volume Share (%), by End User 2025 & 2033
- Figure 63: Middle East and Africa Biometric Authentication in Healthcare Industry Revenue (Million), by Country 2025 & 2033
- Figure 64: Middle East and Africa Biometric Authentication in Healthcare Industry Volume (K Unit), by Country 2025 & 2033
- Figure 65: Middle East and Africa Biometric Authentication in Healthcare Industry Revenue Share (%), by Country 2025 & 2033
- Figure 66: Middle East and Africa Biometric Authentication in Healthcare Industry Volume Share (%), by Country 2025 & 2033
- Figure 67: South America Biometric Authentication in Healthcare Industry Revenue (Million), by Technology 2025 & 2033
- Figure 68: South America Biometric Authentication in Healthcare Industry Volume (K Unit), by Technology 2025 & 2033
- Figure 69: South America Biometric Authentication in Healthcare Industry Revenue Share (%), by Technology 2025 & 2033
- Figure 70: South America Biometric Authentication in Healthcare Industry Volume Share (%), by Technology 2025 & 2033
- Figure 71: South America Biometric Authentication in Healthcare Industry Revenue (Million), by Application 2025 & 2033
- Figure 72: South America Biometric Authentication in Healthcare Industry Volume (K Unit), by Application 2025 & 2033
- Figure 73: South America Biometric Authentication in Healthcare Industry Revenue Share (%), by Application 2025 & 2033
- Figure 74: South America Biometric Authentication in Healthcare Industry Volume Share (%), by Application 2025 & 2033
- Figure 75: South America Biometric Authentication in Healthcare Industry Revenue (Million), by End User 2025 & 2033
- Figure 76: South America Biometric Authentication in Healthcare Industry Volume (K Unit), by End User 2025 & 2033
- Figure 77: South America Biometric Authentication in Healthcare Industry Revenue Share (%), by End User 2025 & 2033
- Figure 78: South America Biometric Authentication in Healthcare Industry Volume Share (%), by End User 2025 & 2033
- Figure 79: South America Biometric Authentication in Healthcare Industry Revenue (Million), by Country 2025 & 2033
- Figure 80: South America Biometric Authentication in Healthcare Industry Volume (K Unit), by Country 2025 & 2033
- Figure 81: South America Biometric Authentication in Healthcare Industry Revenue Share (%), by Country 2025 & 2033
- Figure 82: South America Biometric Authentication in Healthcare Industry Volume Share (%), by Country 2025 & 2033
List of Tables
- Table 1: Global Biometric Authentication in Healthcare Industry Revenue Million Forecast, by Technology 2020 & 2033
- Table 2: Global Biometric Authentication in Healthcare Industry Volume K Unit Forecast, by Technology 2020 & 2033
- Table 3: Global Biometric Authentication in Healthcare Industry Revenue Million Forecast, by Application 2020 & 2033
- Table 4: Global Biometric Authentication in Healthcare Industry Volume K Unit Forecast, by Application 2020 & 2033
- Table 5: Global Biometric Authentication in Healthcare Industry Revenue Million Forecast, by End User 2020 & 2033
- Table 6: Global Biometric Authentication in Healthcare Industry Volume K Unit Forecast, by End User 2020 & 2033
- Table 7: Global Biometric Authentication in Healthcare Industry Revenue Million Forecast, by Region 2020 & 2033
- Table 8: Global Biometric Authentication in Healthcare Industry Volume K Unit Forecast, by Region 2020 & 2033
- Table 9: Global Biometric Authentication in Healthcare Industry Revenue Million Forecast, by Technology 2020 & 2033
- Table 10: Global Biometric Authentication in Healthcare Industry Volume K Unit Forecast, by Technology 2020 & 2033
- Table 11: Global Biometric Authentication in Healthcare Industry Revenue Million Forecast, by Application 2020 & 2033
- Table 12: Global Biometric Authentication in Healthcare Industry Volume K Unit Forecast, by Application 2020 & 2033
- Table 13: Global Biometric Authentication in Healthcare Industry Revenue Million Forecast, by End User 2020 & 2033
- Table 14: Global Biometric Authentication in Healthcare Industry Volume K Unit Forecast, by End User 2020 & 2033
- Table 15: Global Biometric Authentication in Healthcare Industry Revenue Million Forecast, by Country 2020 & 2033
- Table 16: Global Biometric Authentication in Healthcare Industry Volume K Unit Forecast, by Country 2020 & 2033
- Table 17: United States Biometric Authentication in Healthcare Industry Revenue (Million) Forecast, by Application 2020 & 2033
- Table 18: United States Biometric Authentication in Healthcare Industry Volume (K Unit) Forecast, by Application 2020 & 2033
- Table 19: Canada Biometric Authentication in Healthcare Industry Revenue (Million) Forecast, by Application 2020 & 2033
- Table 20: Canada Biometric Authentication in Healthcare Industry Volume (K Unit) Forecast, by Application 2020 & 2033
- Table 21: Mexico Biometric Authentication in Healthcare Industry Revenue (Million) Forecast, by Application 2020 & 2033
- Table 22: Mexico Biometric Authentication in Healthcare Industry Volume (K Unit) Forecast, by Application 2020 & 2033
- Table 23: Global Biometric Authentication in Healthcare Industry Revenue Million Forecast, by Technology 2020 & 2033
- Table 24: Global Biometric Authentication in Healthcare Industry Volume K Unit Forecast, by Technology 2020 & 2033
- Table 25: Global Biometric Authentication in Healthcare Industry Revenue Million Forecast, by Application 2020 & 2033
- Table 26: Global Biometric Authentication in Healthcare Industry Volume K Unit Forecast, by Application 2020 & 2033
- Table 27: Global Biometric Authentication in Healthcare Industry Revenue Million Forecast, by End User 2020 & 2033
- Table 28: Global Biometric Authentication in Healthcare Industry Volume K Unit Forecast, by End User 2020 & 2033
- Table 29: Global Biometric Authentication in Healthcare Industry Revenue Million Forecast, by Country 2020 & 2033
- Table 30: Global Biometric Authentication in Healthcare Industry Volume K Unit Forecast, by Country 2020 & 2033
- Table 31: Germany Biometric Authentication in Healthcare Industry Revenue (Million) Forecast, by Application 2020 & 2033
- Table 32: Germany Biometric Authentication in Healthcare Industry Volume (K Unit) Forecast, by Application 2020 & 2033
- Table 33: United Kingdom Biometric Authentication in Healthcare Industry Revenue (Million) Forecast, by Application 2020 & 2033
- Table 34: United Kingdom Biometric Authentication in Healthcare Industry Volume (K Unit) Forecast, by Application 2020 & 2033
- Table 35: France Biometric Authentication in Healthcare Industry Revenue (Million) Forecast, by Application 2020 & 2033
- Table 36: France Biometric Authentication in Healthcare Industry Volume (K Unit) Forecast, by Application 2020 & 2033
- Table 37: Italy Biometric Authentication in Healthcare Industry Revenue (Million) Forecast, by Application 2020 & 2033
- Table 38: Italy Biometric Authentication in Healthcare Industry Volume (K Unit) Forecast, by Application 2020 & 2033
- Table 39: Spain Biometric Authentication in Healthcare Industry Revenue (Million) Forecast, by Application 2020 & 2033
- Table 40: Spain Biometric Authentication in Healthcare Industry Volume (K Unit) Forecast, by Application 2020 & 2033
- Table 41: Rest of Europe Biometric Authentication in Healthcare Industry Revenue (Million) Forecast, by Application 2020 & 2033
- Table 42: Rest of Europe Biometric Authentication in Healthcare Industry Volume (K Unit) Forecast, by Application 2020 & 2033
- Table 43: Global Biometric Authentication in Healthcare Industry Revenue Million Forecast, by Technology 2020 & 2033
- Table 44: Global Biometric Authentication in Healthcare Industry Volume K Unit Forecast, by Technology 2020 & 2033
- Table 45: Global Biometric Authentication in Healthcare Industry Revenue Million Forecast, by Application 2020 & 2033
- Table 46: Global Biometric Authentication in Healthcare Industry Volume K Unit Forecast, by Application 2020 & 2033
- Table 47: Global Biometric Authentication in Healthcare Industry Revenue Million Forecast, by End User 2020 & 2033
- Table 48: Global Biometric Authentication in Healthcare Industry Volume K Unit Forecast, by End User 2020 & 2033
- Table 49: Global Biometric Authentication in Healthcare Industry Revenue Million Forecast, by Country 2020 & 2033
- Table 50: Global Biometric Authentication in Healthcare Industry Volume K Unit Forecast, by Country 2020 & 2033
- Table 51: China Biometric Authentication in Healthcare Industry Revenue (Million) Forecast, by Application 2020 & 2033
- Table 52: China Biometric Authentication in Healthcare Industry Volume (K Unit) Forecast, by Application 2020 & 2033
- Table 53: Japan Biometric Authentication in Healthcare Industry Revenue (Million) Forecast, by Application 2020 & 2033
- Table 54: Japan Biometric Authentication in Healthcare Industry Volume (K Unit) Forecast, by Application 2020 & 2033
- Table 55: India Biometric Authentication in Healthcare Industry Revenue (Million) Forecast, by Application 2020 & 2033
- Table 56: India Biometric Authentication in Healthcare Industry Volume (K Unit) Forecast, by Application 2020 & 2033
- Table 57: Australia Biometric Authentication in Healthcare Industry Revenue (Million) Forecast, by Application 2020 & 2033
- Table 58: Australia Biometric Authentication in Healthcare Industry Volume (K Unit) Forecast, by Application 2020 & 2033
- Table 59: South Korea Biometric Authentication in Healthcare Industry Revenue (Million) Forecast, by Application 2020 & 2033
- Table 60: South Korea Biometric Authentication in Healthcare Industry Volume (K Unit) Forecast, by Application 2020 & 2033
- Table 61: Rest of Asia Pacific Biometric Authentication in Healthcare Industry Revenue (Million) Forecast, by Application 2020 & 2033
- Table 62: Rest of Asia Pacific Biometric Authentication in Healthcare Industry Volume (K Unit) Forecast, by Application 2020 & 2033
- Table 63: Global Biometric Authentication in Healthcare Industry Revenue Million Forecast, by Technology 2020 & 2033
- Table 64: Global Biometric Authentication in Healthcare Industry Volume K Unit Forecast, by Technology 2020 & 2033
- Table 65: Global Biometric Authentication in Healthcare Industry Revenue Million Forecast, by Application 2020 & 2033
- Table 66: Global Biometric Authentication in Healthcare Industry Volume K Unit Forecast, by Application 2020 & 2033
- Table 67: Global Biometric Authentication in Healthcare Industry Revenue Million Forecast, by End User 2020 & 2033
- Table 68: Global Biometric Authentication in Healthcare Industry Volume K Unit Forecast, by End User 2020 & 2033
- Table 69: Global Biometric Authentication in Healthcare Industry Revenue Million Forecast, by Country 2020 & 2033
- Table 70: Global Biometric Authentication in Healthcare Industry Volume K Unit Forecast, by Country 2020 & 2033
- Table 71: GCC Biometric Authentication in Healthcare Industry Revenue (Million) Forecast, by Application 2020 & 2033
- Table 72: GCC Biometric Authentication in Healthcare Industry Volume (K Unit) Forecast, by Application 2020 & 2033
- Table 73: South Africa Biometric Authentication in Healthcare Industry Revenue (Million) Forecast, by Application 2020 & 2033
- Table 74: South Africa Biometric Authentication in Healthcare Industry Volume (K Unit) Forecast, by Application 2020 & 2033
- Table 75: Rest of Middle East and Africa Biometric Authentication in Healthcare Industry Revenue (Million) Forecast, by Application 2020 & 2033
- Table 76: Rest of Middle East and Africa Biometric Authentication in Healthcare Industry Volume (K Unit) Forecast, by Application 2020 & 2033
- Table 77: Global Biometric Authentication in Healthcare Industry Revenue Million Forecast, by Technology 2020 & 2033
- Table 78: Global Biometric Authentication in Healthcare Industry Volume K Unit Forecast, by Technology 2020 & 2033
- Table 79: Global Biometric Authentication in Healthcare Industry Revenue Million Forecast, by Application 2020 & 2033
- Table 80: Global Biometric Authentication in Healthcare Industry Volume K Unit Forecast, by Application 2020 & 2033
- Table 81: Global Biometric Authentication in Healthcare Industry Revenue Million Forecast, by End User 2020 & 2033
- Table 82: Global Biometric Authentication in Healthcare Industry Volume K Unit Forecast, by End User 2020 & 2033
- Table 83: Global Biometric Authentication in Healthcare Industry Revenue Million Forecast, by Country 2020 & 2033
- Table 84: Global Biometric Authentication in Healthcare Industry Volume K Unit Forecast, by Country 2020 & 2033
- Table 85: Brazil Biometric Authentication in Healthcare Industry Revenue (Million) Forecast, by Application 2020 & 2033
- Table 86: Brazil Biometric Authentication in Healthcare Industry Volume (K Unit) Forecast, by Application 2020 & 2033
- Table 87: Argentina Biometric Authentication in Healthcare Industry Revenue (Million) Forecast, by Application 2020 & 2033
- Table 88: Argentina Biometric Authentication in Healthcare Industry Volume (K Unit) Forecast, by Application 2020 & 2033
- Table 89: Rest of South America Biometric Authentication in Healthcare Industry Revenue (Million) Forecast, by Application 2020 & 2033
- Table 90: Rest of South America Biometric Authentication in Healthcare Industry Volume (K Unit) Forecast, by Application 2020 & 2033
Frequently Asked Questions
1. What is the projected Compound Annual Growth Rate (CAGR) of the Biometric Authentication in Healthcare Industry?
The projected CAGR is approximately 21.29%.
2. Which companies are prominent players in the Biometric Authentication in Healthcare Industry?
Key companies in the market include Morpho, Suprema Inc, Lumidigm, Integrated Biometrics, Thales Group, Fujitsu Limited, Facetec Inc , Crossmatch Technologies Inc, Bio-Key International Inc, Imprivata Inc, NEC Corporation, Zkteco Inc.
3. What are the main segments of the Biometric Authentication in Healthcare Industry?
The market segments include Technology, Application, End User.
4. Can you provide details about the market size?
The market size is estimated to be USD 10.02 Million as of 2022.
5. What are some drivers contributing to market growth?
Implementation of Government Initiatives Supporting the Adoption of Biometrics in Healthcare; Rising Incidence of Healthcare Data Breaches and Medical Identity Theft.
6. What are the notable trends driving market growth?
Multifactor-factor Authentication is Expected to Cover a Large Share of the Market Over the Forecast Period.
7. Are there any restraints impacting market growth?
High Cost of Biometric Devices; Issues Related to the Use of Biometric Technologies.
8. Can you provide examples of recent developments in the market?
In March 2022, BioIntelliSense, has launched its medical-grade BioButton Rechargeable wearable device. The new BioButton Rechargeable device allows for continuous multi-parameter monitoring of a broad range of 20+ vital signs and physiologic biometrics for up to 30 days on a single charge, based on configuration.
9. What pricing options are available for accessing the report?
Pricing options include single-user, multi-user, and enterprise licenses priced at USD 4750, USD 5250, and USD 8750 respectively.
10. Is the market size provided in terms of value or volume?
The market size is provided in terms of value, measured in Million and volume, measured in K Unit.
11. Are there any specific market keywords associated with the report?
Yes, the market keyword associated with the report is "Biometric Authentication in Healthcare Industry," which aids in identifying and referencing the specific market segment covered.
12. How do I determine which pricing option suits my needs best?
The pricing options vary based on user requirements and access needs. Individual users may opt for single-user licenses, while businesses requiring broader access may choose multi-user or enterprise licenses for cost-effective access to the report.
13. Are there any additional resources or data provided in the Biometric Authentication in Healthcare Industry report?
While the report offers comprehensive insights, it's advisable to review the specific contents or supplementary materials provided to ascertain if additional resources or data are available.
14. How can I stay updated on further developments or reports in the Biometric Authentication in Healthcare Industry?
To stay informed about further developments, trends, and reports in the Biometric Authentication in Healthcare Industry, consider subscribing to industry newsletters, following relevant companies and organizations, or regularly checking reputable industry news sources and publications.
Methodology
Step 1 - Identification of Relevant Samples Size from Population Database


Step 2 - Approaches for Defining Global Market Size (Value, Volume* & Price*)

Note*: In applicable scenarios
Step 3 - Data Sources
Primary Research
- Web Analytics
- Survey Reports
- Research Institute
- Latest Research Reports
- Opinion Leaders
Secondary Research
- Annual Reports
- White Paper
- Latest Press Release
- Industry Association
- Paid Database
- Investor Presentations

Step 4 - Data Triangulation
Involves using different sources of information in order to increase the validity of a study
These sources are likely to be stakeholders in a program - participants, other researchers, program staff, other community members, and so on.
Then we put all data in single framework & apply various statistical tools to find out the dynamic on the market.
During the analysis stage, feedback from the stakeholder groups would be compared to determine areas of agreement as well as areas of divergence

