
Key Insights
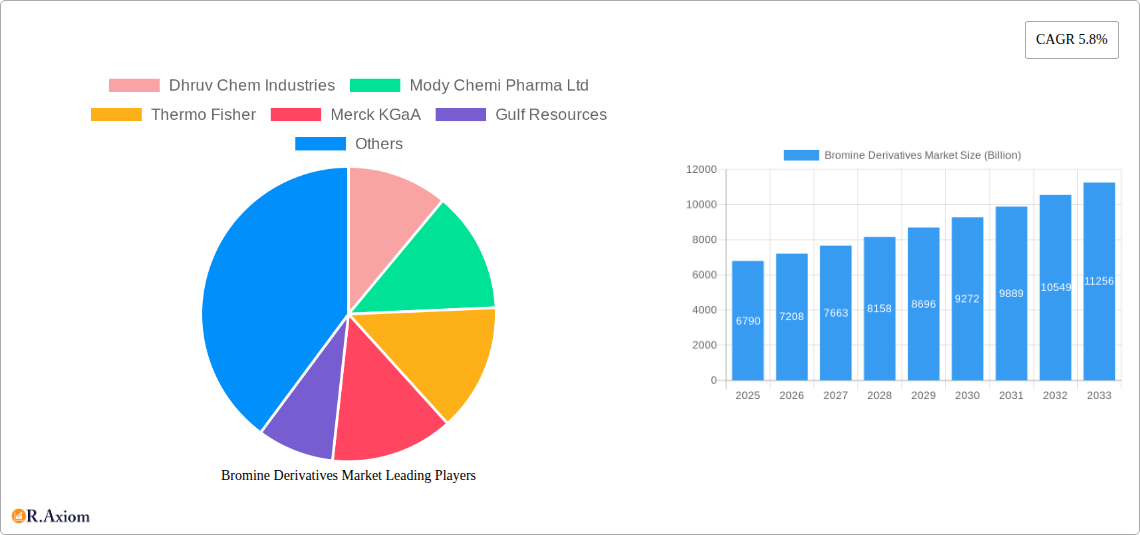
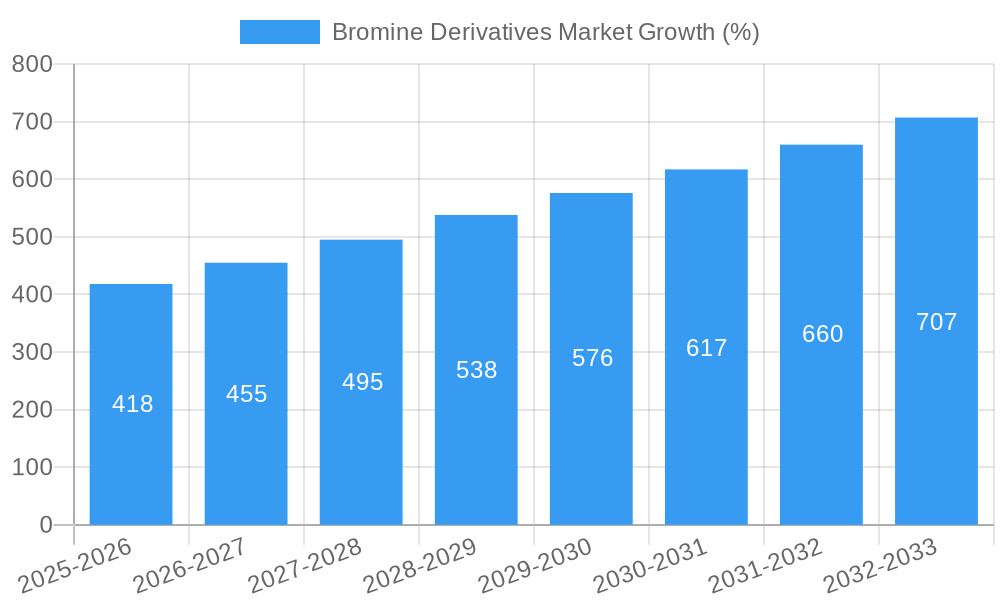
The Bromine Derivatives market, valued at $6.79 billion in 2025, is projected to experience robust growth, exhibiting a Compound Annual Growth Rate (CAGR) of 5.8% from 2025 to 2033. This expansion is fueled by increasing demand across diverse sectors. The pharmaceutical industry relies heavily on bromine derivatives for the synthesis of various drugs and intermediates, driving significant market share. Furthermore, the chemical synthesis sector utilizes these compounds extensively as catalysts and reactants in various chemical processes. The burgeoning flame retardant industry also contributes significantly to market growth, as bromine-based compounds offer effective fire-retardant properties for various materials, including plastics and textiles. Growth is also observed in the water treatment sector due to the effectiveness of brominated compounds as disinfectants and sanitizers. While regulatory concerns regarding the environmental impact of certain bromine compounds may present some restraints, ongoing research and development efforts focused on sustainable alternatives and improved manufacturing processes are mitigating these challenges. The market is segmented by derivatives (including bromo benzene, bromo chloro propane, n-propyl bromide, inorganic bromides, alkyl bromides, and others) and applications (pharmaceuticals, chemical synthesis, solvents, flame retardants, water treatment, and others). Key players in the market include Dhruv Chem Industries, Mody Chemi Pharma Ltd, Thermo Fisher, Merck KGaA, and others, constantly innovating to maintain their competitive edge.
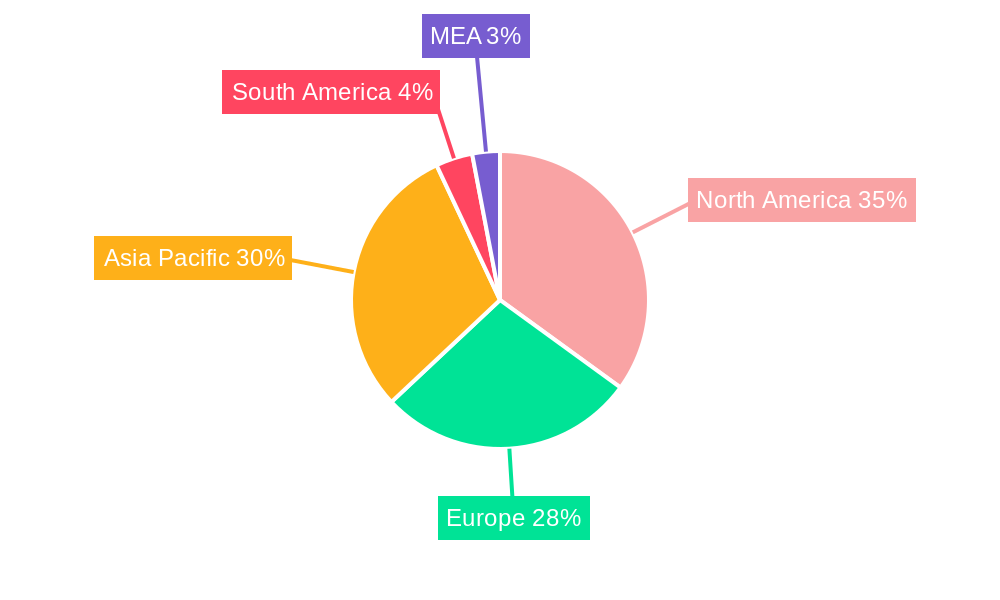
The geographical distribution of the market reveals strong presence across North America, Europe, and Asia Pacific, with China, the United States, and India emerging as significant contributors. The Asia Pacific region is expected to witness significant growth driven by industrialization and increasing demand in emerging economies. Europe's established chemical industry and stringent regulatory frameworks create a balanced market scenario. North America, with its strong pharmaceutical and chemical sectors, maintains a substantial share. Future growth will depend heavily on factors such as technological advancements, stricter environmental regulations, evolving consumer preferences for sustainable solutions, and global economic conditions. The market's continued growth trajectory indicates significant opportunities for market participants, particularly those focusing on innovation and sustainable solutions.
Bromine Derivatives Market: A Comprehensive Report (2019-2033)
This comprehensive report provides an in-depth analysis of the global Bromine Derivatives market, offering valuable insights for stakeholders across the value chain. Covering the period from 2019 to 2033, with a focus on 2025 as the base and estimated year, this report meticulously examines market dynamics, competitive landscapes, and future growth prospects. The market is projected to reach xx Billion by 2033, exhibiting a CAGR of xx% during the forecast period (2025-2033).
Bromine Derivatives Market Market Concentration & Innovation
The Bromine Derivatives market exhibits a moderately concentrated structure, with several large players holding significant market share. Key players like Albemarle Corporation and LANXESS command a substantial portion, estimated at xx% collectively in 2025. However, smaller regional players and specialized manufacturers also contribute significantly to the market's diversity. Innovation is driven primarily by the need for more efficient and environmentally friendly production processes and the development of novel applications for bromine derivatives.
Market Concentration Metrics (2025):
- Top 5 players' combined market share: xx%
- Average market share of top 10 players: xx%
Innovation Drivers:
- Development of sustainable bromine extraction and production methods.
- Research into novel applications in high-growth sectors like pharmaceuticals and electronics.
- Focus on enhancing product performance and reducing environmental impact.
Regulatory Framework: Stringent environmental regulations, particularly regarding the use of certain bromine compounds, significantly impact the market. The EPA's revised guidelines on methyl bromide usage exemplify this. The market is also influenced by evolving safety standards and regulations related to handling and transportation of bromine derivatives.
Product Substitutes: While few direct substitutes exist for specific bromine derivatives, the market faces competition from alternative chemicals with similar functionalities. These substitutes might include chlorine-based compounds or other organic chemicals. Ongoing research and development efforts are focused on creating more efficient and environmentally benign substitutes to meet stringent environmental regulations.
End-User Trends: The growing demand from pharmaceutical and water treatment sectors is a major driver of market growth. The demand for flame retardants in various industries also significantly contributes to the overall market size. This demand is influenced by factors like increasing consumer awareness of safety and stricter building codes.
M&A Activities: The Bromine Derivatives market has witnessed a moderate level of merger and acquisition activity in recent years. While large-scale transactions are relatively infrequent, smaller acquisitions focusing on enhancing product portfolios and geographic expansion are observed. The total value of M&A deals in the past 5 years is estimated at approximately xx Billion.
Bromine Derivatives Market Industry Trends & Insights
The Bromine Derivatives market is experiencing robust growth, fueled by several key factors. The increasing demand from various end-use sectors, particularly pharmaceuticals and water treatment, is a primary growth driver. The rising adoption of flame retardants across industries further bolsters market expansion. Technological advancements in production processes, focused on enhanced efficiency and sustainability, contribute to reduced production costs and broader market accessibility. Furthermore, the ongoing research and development of new applications for bromine derivatives, especially in emerging sectors like electronics and energy storage, are expected to unlock significant growth opportunities. The market penetration rate of bromine derivatives in key applications like flame retardants is high (around xx%), reflecting their established role in various industries. However, continuous innovation and exploration into new applications are vital for sustaining long-term growth. The overall market displays strong growth potential, with a projected CAGR of xx% over the forecast period (2025-2033). Competitive dynamics are shaped by the interplay of large multinational corporations and smaller, specialized manufacturers. Price competition and innovation are key aspects of the competitive landscape. Consumer preferences for environmentally friendly products are impacting market trends, leading to increased demand for sustainable production methods and greener bromine-based solutions. Technological disruptions, such as the development of advanced synthesis techniques, are influencing market growth by allowing production of new derivatives with enhanced performance and reduced environmental footprint.
Dominant Markets & Segments in Bromine Derivatives Market
The Bromine Derivatives market is geographically diverse, with significant contributions from various regions. However, the North American and Asian markets dominate the global scene, contributing approximately xx% of the total market share in 2025. Within segments, the Alkyl Bromides segment holds a substantial market share, driven by its widespread applications in diverse fields, closely followed by Inorganic Bromides.
Dominant Regions:
- North America: Strong demand from pharmaceutical and water treatment sectors, coupled with a robust chemical industry, drives high market share. Key drivers include favorable regulatory environments and a well-established infrastructure.
- Asia: Rapid industrialization and increasing chemical production capacity fuel the growth of this region. Significant demand comes from developing economies with rapidly expanding construction and electronics sectors. Key drivers include favorable economic policies and low production costs.
Dominant Segments (Derivatives):
- Alkyl Bromides: Widespread use as solvents, intermediates in chemical synthesis, and in flame retardants.
- Inorganic Bromides: Significant applications in water treatment, oil & gas production, and other industrial processes.
- Bromo Benzene: Used as an intermediate in various chemical syntheses, and as a solvent in specific applications. Demand is moderate compared to Alkyl Bromides and Inorganic Bromides.
Dominant Segments (Applications):
- Pharmaceutical: Bromine derivatives are crucial components in various pharmaceutical formulations and manufacturing processes. High demand and value addition make this segment a major revenue generator.
- Chemical Synthesis: Bromine derivatives serve as valuable intermediates in the synthesis of a wide range of chemicals. Their versatility and reactivity fuel significant demand across multiple chemical industries.
- Flame Retardants: The growing need for fire safety in buildings, electronics, and transportation leads to substantial demand.
Bromine Derivatives Market Product Developments
Recent years have witnessed significant advancements in Bromine Derivatives technologies, leading to new product introductions and enhanced application possibilities. Companies are focusing on developing greener and more efficient synthesis methods, leading to more sustainable and cost-effective production. This includes optimizing reaction conditions, exploring alternative catalysts, and reducing waste generation. New derivatives with improved performance characteristics are also being introduced, catering to the specific requirements of various applications. For instance, improved flame retardants with better thermal stability and reduced toxicity are in demand. These product developments enhance competitive advantages by providing superior performance and complying with environmental regulations.
Report Scope & Segmentation Analysis
This report provides a comprehensive segmentation analysis of the Bromine Derivatives market based on derivative type (Bromo Benzene, Bromo Chloro Propane (BCP), n-Propyl Bromide (NBR), Inorganic Bromides, Alkyl Bromides, Other Derivatives) and application (Pharmaceutical, Chemical Synthesis, Solvent, Flame Retardants, Water Treatment, Other Applications). Each segment's growth projections, market size, and competitive dynamics are detailed within the report.
Derivatives: Each derivative type has its own unique applications and market dynamics, impacting its growth trajectory and competitive landscape. For instance, Alkyl Bromides are expected to dominate due to versatility.
Applications: The pharmaceutical, chemical synthesis, and flame retardant segments are expected to experience the most significant growth during the forecast period, driven by rising demand and technological advancements.
Key Drivers of Bromine Derivatives Market Growth
Several key factors fuel the growth of the Bromine Derivatives market. The increasing demand from the pharmaceutical industry, driven by the development of new drugs and formulations, significantly contributes to market expansion. Similarly, the construction sector's growing need for flame retardants, especially in high-rise buildings and public spaces, fuels demand. Technological advancements in production techniques, resulting in improved efficiency and reduced costs, also stimulate market growth. Furthermore, supportive government policies promoting sustainable chemical production encourage market expansion.
Challenges in the Bromine Derivatives Market Sector
The Bromine Derivatives market faces challenges like stringent environmental regulations concerning hazardous substances, potentially impacting production and cost. Fluctuations in raw material prices create pricing volatility and impact profitability. Intense competition from established players and the emergence of new entrants necessitate continuous innovation to maintain market share. Supply chain disruptions can negatively affect production and delivery timelines, leading to decreased revenue and potential loss of market share. The estimated impact of these challenges on market growth is xx% during the forecast period.
Emerging Opportunities in Bromine Derivatives Market
Emerging opportunities exist in specialized applications of bromine derivatives, such as in advanced materials and electronics. The development of sustainable and environmentally friendly production processes creates potential for significant market expansion. Growing awareness of environmental protection and increasing demand for eco-friendly chemicals open new avenues for growth. Exploring new markets in developing countries, where demand is high and regulation is evolving, offers further potential.
Leading Players in the Bromine Derivatives Market Market
- Dhruv Chem Industries
- Mody Chemi Pharma Ltd
- Thermo Fisher
- Merck KGaA
- Gulf Resources
- Krishna Solvachem Ltd
- Jordon Bromine Company
- Tokyo Chemical Industry Co Ltd
- LANXESS
- Shanghai Wescco Chemical Co Ltd
- Tata Chemicals Ltd
- BRB Chemicals
- PACIFIC ORGANICS PVT LTD
- Albemarle Corporation
- Shandong Hengalin Chemical Co Ltd
Key Developments in Bromine Derivatives Market Industry
- August 2021: The Environmental Protection Agency (EPA) released revised guidelines on the usage of methyl bromide as a quarantine and pre-shipment fumigant for logs stored in a ship's hold, effective from 1st January 2023. This has led to increased focus on finding suitable alternatives within the Bromine derivatives market.
Strategic Outlook for Bromine Derivatives Market Market
The Bromine Derivatives market presents a promising outlook, driven by robust demand across diverse sectors and continuous innovation. The focus on sustainable production and the development of new applications in high-growth areas will shape future market dynamics. Companies investing in research and development, coupled with strategic partnerships and acquisitions, are well-positioned to capitalize on future growth opportunities. The market's expansion is expected to be propelled by emerging economies' industrialization and increased focus on environmental sustainability.
Bromine Derivatives Market Segmentation
-
1. Derivatives
- 1.1. Bromo Benzene
- 1.2. Bromo Chloro Propane (BCP)
- 1.3. n-Propyl Bromide (NBR)
- 1.4. Inorganic Bromides
- 1.5. Alkyl Bromides
- 1.6. Other Derivatives
-
2. Application
- 2.1. Pharmaceutical
- 2.2. Chemical Synthesis
- 2.3. Solvent
- 2.4. Flame Retardants
- 2.5. Water Treatment
- 2.6. Other Applications
Bromine Derivatives Market Segmentation By Geography
-
1. Asia Pacific
- 1.1. China
- 1.2. India
- 1.3. Japan
- 1.4. South Korea
- 1.5. Rest of Asia Pacific
-
2. North America
- 2.1. United States
- 2.2. Canada
- 2.3. Mexico
-
3. Europe
- 3.1. Germany
- 3.2. United Kingdom
- 3.3. Italy
- 3.4. France
- 3.5. Spain
- 3.6. Rest of Europe
-
4. South America
- 4.1. Brazil
- 4.2. Argentina
- 4.3. Rest of South America
-
5. Middle East and Africa
- 5.1. Saudi Arabia
- 5.2. South Africa
- 5.3. Rest of Middle East and Africa
Bromine Derivatives Market REPORT HIGHLIGHTS
| Aspects | Details |
|---|---|
| Study Period | 2019-2033 |
| Base Year | 2024 |
| Estimated Year | 2025 |
| Forecast Period | 2025-2033 |
| Historical Period | 2019-2024 |
| Growth Rate | CAGR of 5.8% from 2019-2033 |
| Segmentation |
|
Table of Contents
- 1. Introduction
- 1.1. Research Scope
- 1.2. Market Segmentation
- 1.3. Research Methodology
- 1.4. Definitions and Assumptions
- 2. Executive Summary
- 2.1. Introduction
- 3. Market Dynamics
- 3.1. Introduction
- 3.2. Market Drivers
- 3.2.1 Increased Usage of Biocide in Water Treatment Industry; Bromine Derivatives as Intermediates in Chemical
- 3.2.2 Pharmaceutical and Agro Industries
- 3.3. Market Restrains
- 3.3.1. Reduced Oil and Gas Demand Owing to Geopolitical Tensions
- 3.4. Market Trends
- 3.4.1. Increasing Usage from the Water Treatment Segment
- 4. Market Factor Analysis
- 4.1. Porters Five Forces
- 4.2. Supply/Value Chain
- 4.3. PESTEL analysis
- 4.4. Market Entropy
- 4.5. Patent/Trademark Analysis
- 5. Global Bromine Derivatives Market Analysis, Insights and Forecast, 2019-2031
- 5.1. Market Analysis, Insights and Forecast - by Derivatives
- 5.1.1. Bromo Benzene
- 5.1.2. Bromo Chloro Propane (BCP)
- 5.1.3. n-Propyl Bromide (NBR)
- 5.1.4. Inorganic Bromides
- 5.1.5. Alkyl Bromides
- 5.1.6. Other Derivatives
- 5.2. Market Analysis, Insights and Forecast - by Application
- 5.2.1. Pharmaceutical
- 5.2.2. Chemical Synthesis
- 5.2.3. Solvent
- 5.2.4. Flame Retardants
- 5.2.5. Water Treatment
- 5.2.6. Other Applications
- 5.3. Market Analysis, Insights and Forecast - by Region
- 5.3.1. Asia Pacific
- 5.3.2. North America
- 5.3.3. Europe
- 5.3.4. South America
- 5.3.5. Middle East and Africa
- 5.1. Market Analysis, Insights and Forecast - by Derivatives
- 6. Asia Pacific Bromine Derivatives Market Analysis, Insights and Forecast, 2019-2031
- 6.1. Market Analysis, Insights and Forecast - by Derivatives
- 6.1.1. Bromo Benzene
- 6.1.2. Bromo Chloro Propane (BCP)
- 6.1.3. n-Propyl Bromide (NBR)
- 6.1.4. Inorganic Bromides
- 6.1.5. Alkyl Bromides
- 6.1.6. Other Derivatives
- 6.2. Market Analysis, Insights and Forecast - by Application
- 6.2.1. Pharmaceutical
- 6.2.2. Chemical Synthesis
- 6.2.3. Solvent
- 6.2.4. Flame Retardants
- 6.2.5. Water Treatment
- 6.2.6. Other Applications
- 6.1. Market Analysis, Insights and Forecast - by Derivatives
- 7. North America Bromine Derivatives Market Analysis, Insights and Forecast, 2019-2031
- 7.1. Market Analysis, Insights and Forecast - by Derivatives
- 7.1.1. Bromo Benzene
- 7.1.2. Bromo Chloro Propane (BCP)
- 7.1.3. n-Propyl Bromide (NBR)
- 7.1.4. Inorganic Bromides
- 7.1.5. Alkyl Bromides
- 7.1.6. Other Derivatives
- 7.2. Market Analysis, Insights and Forecast - by Application
- 7.2.1. Pharmaceutical
- 7.2.2. Chemical Synthesis
- 7.2.3. Solvent
- 7.2.4. Flame Retardants
- 7.2.5. Water Treatment
- 7.2.6. Other Applications
- 7.1. Market Analysis, Insights and Forecast - by Derivatives
- 8. Europe Bromine Derivatives Market Analysis, Insights and Forecast, 2019-2031
- 8.1. Market Analysis, Insights and Forecast - by Derivatives
- 8.1.1. Bromo Benzene
- 8.1.2. Bromo Chloro Propane (BCP)
- 8.1.3. n-Propyl Bromide (NBR)
- 8.1.4. Inorganic Bromides
- 8.1.5. Alkyl Bromides
- 8.1.6. Other Derivatives
- 8.2. Market Analysis, Insights and Forecast - by Application
- 8.2.1. Pharmaceutical
- 8.2.2. Chemical Synthesis
- 8.2.3. Solvent
- 8.2.4. Flame Retardants
- 8.2.5. Water Treatment
- 8.2.6. Other Applications
- 8.1. Market Analysis, Insights and Forecast - by Derivatives
- 9. South America Bromine Derivatives Market Analysis, Insights and Forecast, 2019-2031
- 9.1. Market Analysis, Insights and Forecast - by Derivatives
- 9.1.1. Bromo Benzene
- 9.1.2. Bromo Chloro Propane (BCP)
- 9.1.3. n-Propyl Bromide (NBR)
- 9.1.4. Inorganic Bromides
- 9.1.5. Alkyl Bromides
- 9.1.6. Other Derivatives
- 9.2. Market Analysis, Insights and Forecast - by Application
- 9.2.1. Pharmaceutical
- 9.2.2. Chemical Synthesis
- 9.2.3. Solvent
- 9.2.4. Flame Retardants
- 9.2.5. Water Treatment
- 9.2.6. Other Applications
- 9.1. Market Analysis, Insights and Forecast - by Derivatives
- 10. Middle East and Africa Bromine Derivatives Market Analysis, Insights and Forecast, 2019-2031
- 10.1. Market Analysis, Insights and Forecast - by Derivatives
- 10.1.1. Bromo Benzene
- 10.1.2. Bromo Chloro Propane (BCP)
- 10.1.3. n-Propyl Bromide (NBR)
- 10.1.4. Inorganic Bromides
- 10.1.5. Alkyl Bromides
- 10.1.6. Other Derivatives
- 10.2. Market Analysis, Insights and Forecast - by Application
- 10.2.1. Pharmaceutical
- 10.2.2. Chemical Synthesis
- 10.2.3. Solvent
- 10.2.4. Flame Retardants
- 10.2.5. Water Treatment
- 10.2.6. Other Applications
- 10.1. Market Analysis, Insights and Forecast - by Derivatives
- 11. North America Bromine Derivatives Market Analysis, Insights and Forecast, 2019-2031
- 11.1. Market Analysis, Insights and Forecast - By Country/Sub-region
- 11.1.1 United States
- 11.1.2 Canada
- 11.1.3 Mexico
- 12. Europe Bromine Derivatives Market Analysis, Insights and Forecast, 2019-2031
- 12.1. Market Analysis, Insights and Forecast - By Country/Sub-region
- 12.1.1 Germany
- 12.1.2 France
- 12.1.3 Italy
- 12.1.4 United Kingdom
- 12.1.5 Netherlands
- 12.1.6 Rest of Europe
- 13. Asia Pacific Bromine Derivatives Market Analysis, Insights and Forecast, 2019-2031
- 13.1. Market Analysis, Insights and Forecast - By Country/Sub-region
- 13.1.1 China
- 13.1.2 Japan
- 13.1.3 India
- 13.1.4 South Korea
- 13.1.5 Taiwan
- 13.1.6 Australia
- 13.1.7 Rest of Asia-Pacific
- 14. South America Bromine Derivatives Market Analysis, Insights and Forecast, 2019-2031
- 14.1. Market Analysis, Insights and Forecast - By Country/Sub-region
- 14.1.1 Brazil
- 14.1.2 Argentina
- 14.1.3 Rest of South America
- 15. MEA Bromine Derivatives Market Analysis, Insights and Forecast, 2019-2031
- 15.1. Market Analysis, Insights and Forecast - By Country/Sub-region
- 15.1.1 Middle East
- 15.1.2 Africa
- 16. Competitive Analysis
- 16.1. Global Market Share Analysis 2024
- 16.2. Company Profiles
- 16.2.1 Dhruv Chem Industries
- 16.2.1.1. Overview
- 16.2.1.2. Products
- 16.2.1.3. SWOT Analysis
- 16.2.1.4. Recent Developments
- 16.2.1.5. Financials (Based on Availability)
- 16.2.2 Mody Chemi Pharma Ltd
- 16.2.2.1. Overview
- 16.2.2.2. Products
- 16.2.2.3. SWOT Analysis
- 16.2.2.4. Recent Developments
- 16.2.2.5. Financials (Based on Availability)
- 16.2.3 Thermo Fisher
- 16.2.3.1. Overview
- 16.2.3.2. Products
- 16.2.3.3. SWOT Analysis
- 16.2.3.4. Recent Developments
- 16.2.3.5. Financials (Based on Availability)
- 16.2.4 Merck KGaA
- 16.2.4.1. Overview
- 16.2.4.2. Products
- 16.2.4.3. SWOT Analysis
- 16.2.4.4. Recent Developments
- 16.2.4.5. Financials (Based on Availability)
- 16.2.5 Gulf Resources
- 16.2.5.1. Overview
- 16.2.5.2. Products
- 16.2.5.3. SWOT Analysis
- 16.2.5.4. Recent Developments
- 16.2.5.5. Financials (Based on Availability)
- 16.2.6 Krishna Solvachem Ltd
- 16.2.6.1. Overview
- 16.2.6.2. Products
- 16.2.6.3. SWOT Analysis
- 16.2.6.4. Recent Developments
- 16.2.6.5. Financials (Based on Availability)
- 16.2.7 Jordon Bromine Company
- 16.2.7.1. Overview
- 16.2.7.2. Products
- 16.2.7.3. SWOT Analysis
- 16.2.7.4. Recent Developments
- 16.2.7.5. Financials (Based on Availability)
- 16.2.8 Tokyo Chemical Industry Co Ltd
- 16.2.8.1. Overview
- 16.2.8.2. Products
- 16.2.8.3. SWOT Analysis
- 16.2.8.4. Recent Developments
- 16.2.8.5. Financials (Based on Availability)
- 16.2.9 LANXESS
- 16.2.9.1. Overview
- 16.2.9.2. Products
- 16.2.9.3. SWOT Analysis
- 16.2.9.4. Recent Developments
- 16.2.9.5. Financials (Based on Availability)
- 16.2.10 Shanghai Wescco Chemical Co Ltd
- 16.2.10.1. Overview
- 16.2.10.2. Products
- 16.2.10.3. SWOT Analysis
- 16.2.10.4. Recent Developments
- 16.2.10.5. Financials (Based on Availability)
- 16.2.11 Tata Chemicals Ltd
- 16.2.11.1. Overview
- 16.2.11.2. Products
- 16.2.11.3. SWOT Analysis
- 16.2.11.4. Recent Developments
- 16.2.11.5. Financials (Based on Availability)
- 16.2.12 BRB Chemicals
- 16.2.12.1. Overview
- 16.2.12.2. Products
- 16.2.12.3. SWOT Analysis
- 16.2.12.4. Recent Developments
- 16.2.12.5. Financials (Based on Availability)
- 16.2.13 PACIFIC ORGANICS PVT LTD
- 16.2.13.1. Overview
- 16.2.13.2. Products
- 16.2.13.3. SWOT Analysis
- 16.2.13.4. Recent Developments
- 16.2.13.5. Financials (Based on Availability)
- 16.2.14 Albemarle Corporation
- 16.2.14.1. Overview
- 16.2.14.2. Products
- 16.2.14.3. SWOT Analysis
- 16.2.14.4. Recent Developments
- 16.2.14.5. Financials (Based on Availability)
- 16.2.15 Shandong Hengalin Chemical Co Ltd
- 16.2.15.1. Overview
- 16.2.15.2. Products
- 16.2.15.3. SWOT Analysis
- 16.2.15.4. Recent Developments
- 16.2.15.5. Financials (Based on Availability)
- 16.2.1 Dhruv Chem Industries
List of Figures
- Figure 1: Global Bromine Derivatives Market Revenue Breakdown (Billion, %) by Region 2024 & 2032
- Figure 2: Global Bromine Derivatives Market Volume Breakdown (K Tons, %) by Region 2024 & 2032
- Figure 3: North America Bromine Derivatives Market Revenue (Billion), by Country 2024 & 2032
- Figure 4: North America Bromine Derivatives Market Volume (K Tons), by Country 2024 & 2032
- Figure 5: North America Bromine Derivatives Market Revenue Share (%), by Country 2024 & 2032
- Figure 6: North America Bromine Derivatives Market Volume Share (%), by Country 2024 & 2032
- Figure 7: Europe Bromine Derivatives Market Revenue (Billion), by Country 2024 & 2032
- Figure 8: Europe Bromine Derivatives Market Volume (K Tons), by Country 2024 & 2032
- Figure 9: Europe Bromine Derivatives Market Revenue Share (%), by Country 2024 & 2032
- Figure 10: Europe Bromine Derivatives Market Volume Share (%), by Country 2024 & 2032
- Figure 11: Asia Pacific Bromine Derivatives Market Revenue (Billion), by Country 2024 & 2032
- Figure 12: Asia Pacific Bromine Derivatives Market Volume (K Tons), by Country 2024 & 2032
- Figure 13: Asia Pacific Bromine Derivatives Market Revenue Share (%), by Country 2024 & 2032
- Figure 14: Asia Pacific Bromine Derivatives Market Volume Share (%), by Country 2024 & 2032
- Figure 15: South America Bromine Derivatives Market Revenue (Billion), by Country 2024 & 2032
- Figure 16: South America Bromine Derivatives Market Volume (K Tons), by Country 2024 & 2032
- Figure 17: South America Bromine Derivatives Market Revenue Share (%), by Country 2024 & 2032
- Figure 18: South America Bromine Derivatives Market Volume Share (%), by Country 2024 & 2032
- Figure 19: MEA Bromine Derivatives Market Revenue (Billion), by Country 2024 & 2032
- Figure 20: MEA Bromine Derivatives Market Volume (K Tons), by Country 2024 & 2032
- Figure 21: MEA Bromine Derivatives Market Revenue Share (%), by Country 2024 & 2032
- Figure 22: MEA Bromine Derivatives Market Volume Share (%), by Country 2024 & 2032
- Figure 23: Asia Pacific Bromine Derivatives Market Revenue (Billion), by Derivatives 2024 & 2032
- Figure 24: Asia Pacific Bromine Derivatives Market Volume (K Tons), by Derivatives 2024 & 2032
- Figure 25: Asia Pacific Bromine Derivatives Market Revenue Share (%), by Derivatives 2024 & 2032
- Figure 26: Asia Pacific Bromine Derivatives Market Volume Share (%), by Derivatives 2024 & 2032
- Figure 27: Asia Pacific Bromine Derivatives Market Revenue (Billion), by Application 2024 & 2032
- Figure 28: Asia Pacific Bromine Derivatives Market Volume (K Tons), by Application 2024 & 2032
- Figure 29: Asia Pacific Bromine Derivatives Market Revenue Share (%), by Application 2024 & 2032
- Figure 30: Asia Pacific Bromine Derivatives Market Volume Share (%), by Application 2024 & 2032
- Figure 31: Asia Pacific Bromine Derivatives Market Revenue (Billion), by Country 2024 & 2032
- Figure 32: Asia Pacific Bromine Derivatives Market Volume (K Tons), by Country 2024 & 2032
- Figure 33: Asia Pacific Bromine Derivatives Market Revenue Share (%), by Country 2024 & 2032
- Figure 34: Asia Pacific Bromine Derivatives Market Volume Share (%), by Country 2024 & 2032
- Figure 35: North America Bromine Derivatives Market Revenue (Billion), by Derivatives 2024 & 2032
- Figure 36: North America Bromine Derivatives Market Volume (K Tons), by Derivatives 2024 & 2032
- Figure 37: North America Bromine Derivatives Market Revenue Share (%), by Derivatives 2024 & 2032
- Figure 38: North America Bromine Derivatives Market Volume Share (%), by Derivatives 2024 & 2032
- Figure 39: North America Bromine Derivatives Market Revenue (Billion), by Application 2024 & 2032
- Figure 40: North America Bromine Derivatives Market Volume (K Tons), by Application 2024 & 2032
- Figure 41: North America Bromine Derivatives Market Revenue Share (%), by Application 2024 & 2032
- Figure 42: North America Bromine Derivatives Market Volume Share (%), by Application 2024 & 2032
- Figure 43: North America Bromine Derivatives Market Revenue (Billion), by Country 2024 & 2032
- Figure 44: North America Bromine Derivatives Market Volume (K Tons), by Country 2024 & 2032
- Figure 45: North America Bromine Derivatives Market Revenue Share (%), by Country 2024 & 2032
- Figure 46: North America Bromine Derivatives Market Volume Share (%), by Country 2024 & 2032
- Figure 47: Europe Bromine Derivatives Market Revenue (Billion), by Derivatives 2024 & 2032
- Figure 48: Europe Bromine Derivatives Market Volume (K Tons), by Derivatives 2024 & 2032
- Figure 49: Europe Bromine Derivatives Market Revenue Share (%), by Derivatives 2024 & 2032
- Figure 50: Europe Bromine Derivatives Market Volume Share (%), by Derivatives 2024 & 2032
- Figure 51: Europe Bromine Derivatives Market Revenue (Billion), by Application 2024 & 2032
- Figure 52: Europe Bromine Derivatives Market Volume (K Tons), by Application 2024 & 2032
- Figure 53: Europe Bromine Derivatives Market Revenue Share (%), by Application 2024 & 2032
- Figure 54: Europe Bromine Derivatives Market Volume Share (%), by Application 2024 & 2032
- Figure 55: Europe Bromine Derivatives Market Revenue (Billion), by Country 2024 & 2032
- Figure 56: Europe Bromine Derivatives Market Volume (K Tons), by Country 2024 & 2032
- Figure 57: Europe Bromine Derivatives Market Revenue Share (%), by Country 2024 & 2032
- Figure 58: Europe Bromine Derivatives Market Volume Share (%), by Country 2024 & 2032
- Figure 59: South America Bromine Derivatives Market Revenue (Billion), by Derivatives 2024 & 2032
- Figure 60: South America Bromine Derivatives Market Volume (K Tons), by Derivatives 2024 & 2032
- Figure 61: South America Bromine Derivatives Market Revenue Share (%), by Derivatives 2024 & 2032
- Figure 62: South America Bromine Derivatives Market Volume Share (%), by Derivatives 2024 & 2032
- Figure 63: South America Bromine Derivatives Market Revenue (Billion), by Application 2024 & 2032
- Figure 64: South America Bromine Derivatives Market Volume (K Tons), by Application 2024 & 2032
- Figure 65: South America Bromine Derivatives Market Revenue Share (%), by Application 2024 & 2032
- Figure 66: South America Bromine Derivatives Market Volume Share (%), by Application 2024 & 2032
- Figure 67: South America Bromine Derivatives Market Revenue (Billion), by Country 2024 & 2032
- Figure 68: South America Bromine Derivatives Market Volume (K Tons), by Country 2024 & 2032
- Figure 69: South America Bromine Derivatives Market Revenue Share (%), by Country 2024 & 2032
- Figure 70: South America Bromine Derivatives Market Volume Share (%), by Country 2024 & 2032
- Figure 71: Middle East and Africa Bromine Derivatives Market Revenue (Billion), by Derivatives 2024 & 2032
- Figure 72: Middle East and Africa Bromine Derivatives Market Volume (K Tons), by Derivatives 2024 & 2032
- Figure 73: Middle East and Africa Bromine Derivatives Market Revenue Share (%), by Derivatives 2024 & 2032
- Figure 74: Middle East and Africa Bromine Derivatives Market Volume Share (%), by Derivatives 2024 & 2032
- Figure 75: Middle East and Africa Bromine Derivatives Market Revenue (Billion), by Application 2024 & 2032
- Figure 76: Middle East and Africa Bromine Derivatives Market Volume (K Tons), by Application 2024 & 2032
- Figure 77: Middle East and Africa Bromine Derivatives Market Revenue Share (%), by Application 2024 & 2032
- Figure 78: Middle East and Africa Bromine Derivatives Market Volume Share (%), by Application 2024 & 2032
- Figure 79: Middle East and Africa Bromine Derivatives Market Revenue (Billion), by Country 2024 & 2032
- Figure 80: Middle East and Africa Bromine Derivatives Market Volume (K Tons), by Country 2024 & 2032
- Figure 81: Middle East and Africa Bromine Derivatives Market Revenue Share (%), by Country 2024 & 2032
- Figure 82: Middle East and Africa Bromine Derivatives Market Volume Share (%), by Country 2024 & 2032
List of Tables
- Table 1: Global Bromine Derivatives Market Revenue Billion Forecast, by Region 2019 & 2032
- Table 2: Global Bromine Derivatives Market Volume K Tons Forecast, by Region 2019 & 2032
- Table 3: Global Bromine Derivatives Market Revenue Billion Forecast, by Derivatives 2019 & 2032
- Table 4: Global Bromine Derivatives Market Volume K Tons Forecast, by Derivatives 2019 & 2032
- Table 5: Global Bromine Derivatives Market Revenue Billion Forecast, by Application 2019 & 2032
- Table 6: Global Bromine Derivatives Market Volume K Tons Forecast, by Application 2019 & 2032
- Table 7: Global Bromine Derivatives Market Revenue Billion Forecast, by Region 2019 & 2032
- Table 8: Global Bromine Derivatives Market Volume K Tons Forecast, by Region 2019 & 2032
- Table 9: Global Bromine Derivatives Market Revenue Billion Forecast, by Country 2019 & 2032
- Table 10: Global Bromine Derivatives Market Volume K Tons Forecast, by Country 2019 & 2032
- Table 11: United States Bromine Derivatives Market Revenue (Billion) Forecast, by Application 2019 & 2032
- Table 12: United States Bromine Derivatives Market Volume (K Tons) Forecast, by Application 2019 & 2032
- Table 13: Canada Bromine Derivatives Market Revenue (Billion) Forecast, by Application 2019 & 2032
- Table 14: Canada Bromine Derivatives Market Volume (K Tons) Forecast, by Application 2019 & 2032
- Table 15: Mexico Bromine Derivatives Market Revenue (Billion) Forecast, by Application 2019 & 2032
- Table 16: Mexico Bromine Derivatives Market Volume (K Tons) Forecast, by Application 2019 & 2032
- Table 17: Global Bromine Derivatives Market Revenue Billion Forecast, by Country 2019 & 2032
- Table 18: Global Bromine Derivatives Market Volume K Tons Forecast, by Country 2019 & 2032
- Table 19: Germany Bromine Derivatives Market Revenue (Billion) Forecast, by Application 2019 & 2032
- Table 20: Germany Bromine Derivatives Market Volume (K Tons) Forecast, by Application 2019 & 2032
- Table 21: France Bromine Derivatives Market Revenue (Billion) Forecast, by Application 2019 & 2032
- Table 22: France Bromine Derivatives Market Volume (K Tons) Forecast, by Application 2019 & 2032
- Table 23: Italy Bromine Derivatives Market Revenue (Billion) Forecast, by Application 2019 & 2032
- Table 24: Italy Bromine Derivatives Market Volume (K Tons) Forecast, by Application 2019 & 2032
- Table 25: United Kingdom Bromine Derivatives Market Revenue (Billion) Forecast, by Application 2019 & 2032
- Table 26: United Kingdom Bromine Derivatives Market Volume (K Tons) Forecast, by Application 2019 & 2032
- Table 27: Netherlands Bromine Derivatives Market Revenue (Billion) Forecast, by Application 2019 & 2032
- Table 28: Netherlands Bromine Derivatives Market Volume (K Tons) Forecast, by Application 2019 & 2032
- Table 29: Rest of Europe Bromine Derivatives Market Revenue (Billion) Forecast, by Application 2019 & 2032
- Table 30: Rest of Europe Bromine Derivatives Market Volume (K Tons) Forecast, by Application 2019 & 2032
- Table 31: Global Bromine Derivatives Market Revenue Billion Forecast, by Country 2019 & 2032
- Table 32: Global Bromine Derivatives Market Volume K Tons Forecast, by Country 2019 & 2032
- Table 33: China Bromine Derivatives Market Revenue (Billion) Forecast, by Application 2019 & 2032
- Table 34: China Bromine Derivatives Market Volume (K Tons) Forecast, by Application 2019 & 2032
- Table 35: Japan Bromine Derivatives Market Revenue (Billion) Forecast, by Application 2019 & 2032
- Table 36: Japan Bromine Derivatives Market Volume (K Tons) Forecast, by Application 2019 & 2032
- Table 37: India Bromine Derivatives Market Revenue (Billion) Forecast, by Application 2019 & 2032
- Table 38: India Bromine Derivatives Market Volume (K Tons) Forecast, by Application 2019 & 2032
- Table 39: South Korea Bromine Derivatives Market Revenue (Billion) Forecast, by Application 2019 & 2032
- Table 40: South Korea Bromine Derivatives Market Volume (K Tons) Forecast, by Application 2019 & 2032
- Table 41: Taiwan Bromine Derivatives Market Revenue (Billion) Forecast, by Application 2019 & 2032
- Table 42: Taiwan Bromine Derivatives Market Volume (K Tons) Forecast, by Application 2019 & 2032
- Table 43: Australia Bromine Derivatives Market Revenue (Billion) Forecast, by Application 2019 & 2032
- Table 44: Australia Bromine Derivatives Market Volume (K Tons) Forecast, by Application 2019 & 2032
- Table 45: Rest of Asia-Pacific Bromine Derivatives Market Revenue (Billion) Forecast, by Application 2019 & 2032
- Table 46: Rest of Asia-Pacific Bromine Derivatives Market Volume (K Tons) Forecast, by Application 2019 & 2032
- Table 47: Global Bromine Derivatives Market Revenue Billion Forecast, by Country 2019 & 2032
- Table 48: Global Bromine Derivatives Market Volume K Tons Forecast, by Country 2019 & 2032
- Table 49: Brazil Bromine Derivatives Market Revenue (Billion) Forecast, by Application 2019 & 2032
- Table 50: Brazil Bromine Derivatives Market Volume (K Tons) Forecast, by Application 2019 & 2032
- Table 51: Argentina Bromine Derivatives Market Revenue (Billion) Forecast, by Application 2019 & 2032
- Table 52: Argentina Bromine Derivatives Market Volume (K Tons) Forecast, by Application 2019 & 2032
- Table 53: Rest of South America Bromine Derivatives Market Revenue (Billion) Forecast, by Application 2019 & 2032
- Table 54: Rest of South America Bromine Derivatives Market Volume (K Tons) Forecast, by Application 2019 & 2032
- Table 55: Global Bromine Derivatives Market Revenue Billion Forecast, by Country 2019 & 2032
- Table 56: Global Bromine Derivatives Market Volume K Tons Forecast, by Country 2019 & 2032
- Table 57: Middle East Bromine Derivatives Market Revenue (Billion) Forecast, by Application 2019 & 2032
- Table 58: Middle East Bromine Derivatives Market Volume (K Tons) Forecast, by Application 2019 & 2032
- Table 59: Africa Bromine Derivatives Market Revenue (Billion) Forecast, by Application 2019 & 2032
- Table 60: Africa Bromine Derivatives Market Volume (K Tons) Forecast, by Application 2019 & 2032
- Table 61: Global Bromine Derivatives Market Revenue Billion Forecast, by Derivatives 2019 & 2032
- Table 62: Global Bromine Derivatives Market Volume K Tons Forecast, by Derivatives 2019 & 2032
- Table 63: Global Bromine Derivatives Market Revenue Billion Forecast, by Application 2019 & 2032
- Table 64: Global Bromine Derivatives Market Volume K Tons Forecast, by Application 2019 & 2032
- Table 65: Global Bromine Derivatives Market Revenue Billion Forecast, by Country 2019 & 2032
- Table 66: Global Bromine Derivatives Market Volume K Tons Forecast, by Country 2019 & 2032
- Table 67: China Bromine Derivatives Market Revenue (Billion) Forecast, by Application 2019 & 2032
- Table 68: China Bromine Derivatives Market Volume (K Tons) Forecast, by Application 2019 & 2032
- Table 69: India Bromine Derivatives Market Revenue (Billion) Forecast, by Application 2019 & 2032
- Table 70: India Bromine Derivatives Market Volume (K Tons) Forecast, by Application 2019 & 2032
- Table 71: Japan Bromine Derivatives Market Revenue (Billion) Forecast, by Application 2019 & 2032
- Table 72: Japan Bromine Derivatives Market Volume (K Tons) Forecast, by Application 2019 & 2032
- Table 73: South Korea Bromine Derivatives Market Revenue (Billion) Forecast, by Application 2019 & 2032
- Table 74: South Korea Bromine Derivatives Market Volume (K Tons) Forecast, by Application 2019 & 2032
- Table 75: Rest of Asia Pacific Bromine Derivatives Market Revenue (Billion) Forecast, by Application 2019 & 2032
- Table 76: Rest of Asia Pacific Bromine Derivatives Market Volume (K Tons) Forecast, by Application 2019 & 2032
- Table 77: Global Bromine Derivatives Market Revenue Billion Forecast, by Derivatives 2019 & 2032
- Table 78: Global Bromine Derivatives Market Volume K Tons Forecast, by Derivatives 2019 & 2032
- Table 79: Global Bromine Derivatives Market Revenue Billion Forecast, by Application 2019 & 2032
- Table 80: Global Bromine Derivatives Market Volume K Tons Forecast, by Application 2019 & 2032
- Table 81: Global Bromine Derivatives Market Revenue Billion Forecast, by Country 2019 & 2032
- Table 82: Global Bromine Derivatives Market Volume K Tons Forecast, by Country 2019 & 2032
- Table 83: United States Bromine Derivatives Market Revenue (Billion) Forecast, by Application 2019 & 2032
- Table 84: United States Bromine Derivatives Market Volume (K Tons) Forecast, by Application 2019 & 2032
- Table 85: Canada Bromine Derivatives Market Revenue (Billion) Forecast, by Application 2019 & 2032
- Table 86: Canada Bromine Derivatives Market Volume (K Tons) Forecast, by Application 2019 & 2032
- Table 87: Mexico Bromine Derivatives Market Revenue (Billion) Forecast, by Application 2019 & 2032
- Table 88: Mexico Bromine Derivatives Market Volume (K Tons) Forecast, by Application 2019 & 2032
- Table 89: Global Bromine Derivatives Market Revenue Billion Forecast, by Derivatives 2019 & 2032
- Table 90: Global Bromine Derivatives Market Volume K Tons Forecast, by Derivatives 2019 & 2032
- Table 91: Global Bromine Derivatives Market Revenue Billion Forecast, by Application 2019 & 2032
- Table 92: Global Bromine Derivatives Market Volume K Tons Forecast, by Application 2019 & 2032
- Table 93: Global Bromine Derivatives Market Revenue Billion Forecast, by Country 2019 & 2032
- Table 94: Global Bromine Derivatives Market Volume K Tons Forecast, by Country 2019 & 2032
- Table 95: Germany Bromine Derivatives Market Revenue (Billion) Forecast, by Application 2019 & 2032
- Table 96: Germany Bromine Derivatives Market Volume (K Tons) Forecast, by Application 2019 & 2032
- Table 97: United Kingdom Bromine Derivatives Market Revenue (Billion) Forecast, by Application 2019 & 2032
- Table 98: United Kingdom Bromine Derivatives Market Volume (K Tons) Forecast, by Application 2019 & 2032
- Table 99: Italy Bromine Derivatives Market Revenue (Billion) Forecast, by Application 2019 & 2032
- Table 100: Italy Bromine Derivatives Market Volume (K Tons) Forecast, by Application 2019 & 2032
- Table 101: France Bromine Derivatives Market Revenue (Billion) Forecast, by Application 2019 & 2032
- Table 102: France Bromine Derivatives Market Volume (K Tons) Forecast, by Application 2019 & 2032
- Table 103: Spain Bromine Derivatives Market Revenue (Billion) Forecast, by Application 2019 & 2032
- Table 104: Spain Bromine Derivatives Market Volume (K Tons) Forecast, by Application 2019 & 2032
- Table 105: Rest of Europe Bromine Derivatives Market Revenue (Billion) Forecast, by Application 2019 & 2032
- Table 106: Rest of Europe Bromine Derivatives Market Volume (K Tons) Forecast, by Application 2019 & 2032
- Table 107: Global Bromine Derivatives Market Revenue Billion Forecast, by Derivatives 2019 & 2032
- Table 108: Global Bromine Derivatives Market Volume K Tons Forecast, by Derivatives 2019 & 2032
- Table 109: Global Bromine Derivatives Market Revenue Billion Forecast, by Application 2019 & 2032
- Table 110: Global Bromine Derivatives Market Volume K Tons Forecast, by Application 2019 & 2032
- Table 111: Global Bromine Derivatives Market Revenue Billion Forecast, by Country 2019 & 2032
- Table 112: Global Bromine Derivatives Market Volume K Tons Forecast, by Country 2019 & 2032
- Table 113: Brazil Bromine Derivatives Market Revenue (Billion) Forecast, by Application 2019 & 2032
- Table 114: Brazil Bromine Derivatives Market Volume (K Tons) Forecast, by Application 2019 & 2032
- Table 115: Argentina Bromine Derivatives Market Revenue (Billion) Forecast, by Application 2019 & 2032
- Table 116: Argentina Bromine Derivatives Market Volume (K Tons) Forecast, by Application 2019 & 2032
- Table 117: Rest of South America Bromine Derivatives Market Revenue (Billion) Forecast, by Application 2019 & 2032
- Table 118: Rest of South America Bromine Derivatives Market Volume (K Tons) Forecast, by Application 2019 & 2032
- Table 119: Global Bromine Derivatives Market Revenue Billion Forecast, by Derivatives 2019 & 2032
- Table 120: Global Bromine Derivatives Market Volume K Tons Forecast, by Derivatives 2019 & 2032
- Table 121: Global Bromine Derivatives Market Revenue Billion Forecast, by Application 2019 & 2032
- Table 122: Global Bromine Derivatives Market Volume K Tons Forecast, by Application 2019 & 2032
- Table 123: Global Bromine Derivatives Market Revenue Billion Forecast, by Country 2019 & 2032
- Table 124: Global Bromine Derivatives Market Volume K Tons Forecast, by Country 2019 & 2032
- Table 125: Saudi Arabia Bromine Derivatives Market Revenue (Billion) Forecast, by Application 2019 & 2032
- Table 126: Saudi Arabia Bromine Derivatives Market Volume (K Tons) Forecast, by Application 2019 & 2032
- Table 127: South Africa Bromine Derivatives Market Revenue (Billion) Forecast, by Application 2019 & 2032
- Table 128: South Africa Bromine Derivatives Market Volume (K Tons) Forecast, by Application 2019 & 2032
- Table 129: Rest of Middle East and Africa Bromine Derivatives Market Revenue (Billion) Forecast, by Application 2019 & 2032
- Table 130: Rest of Middle East and Africa Bromine Derivatives Market Volume (K Tons) Forecast, by Application 2019 & 2032
Frequently Asked Questions
1. What is the projected Compound Annual Growth Rate (CAGR) of the Bromine Derivatives Market?
The projected CAGR is approximately 5.8%.
2. Which companies are prominent players in the Bromine Derivatives Market?
Key companies in the market include Dhruv Chem Industries, Mody Chemi Pharma Ltd, Thermo Fisher, Merck KGaA, Gulf Resources, Krishna Solvachem Ltd, Jordon Bromine Company, Tokyo Chemical Industry Co Ltd , LANXESS, Shanghai Wescco Chemical Co Ltd, Tata Chemicals Ltd, BRB Chemicals, PACIFIC ORGANICS PVT LTD, Albemarle Corporation, Shandong Hengalin Chemical Co Ltd.
3. What are the main segments of the Bromine Derivatives Market?
The market segments include Derivatives, Application.
4. Can you provide details about the market size?
The market size is estimated to be USD 6.79 Billion as of 2022.
5. What are some drivers contributing to market growth?
Increased Usage of Biocide in Water Treatment Industry; Bromine Derivatives as Intermediates in Chemical. Pharmaceutical and Agro Industries.
6. What are the notable trends driving market growth?
Increasing Usage from the Water Treatment Segment.
7. Are there any restraints impacting market growth?
Reduced Oil and Gas Demand Owing to Geopolitical Tensions.
8. Can you provide examples of recent developments in the market?
In August 2021, the Environmental Protection Agency (EPA) released revised guidelines on the usage of methyl bromide as a quarantine and pre-shipment fumigant for logs stored in a ship's hold, effective from 1st January 2023.
9. What pricing options are available for accessing the report?
Pricing options include single-user, multi-user, and enterprise licenses priced at USD 3,950, USD 4,950, and USD 6,950 respectively.
10. Is the market size provided in terms of value or volume?
The market size is provided in terms of value, measured in Billion and volume, measured in K Tons.
11. Are there any specific market keywords associated with the report?
Yes, the market keyword associated with the report is "Bromine Derivatives Market," which aids in identifying and referencing the specific market segment covered.
12. How do I determine which pricing option suits my needs best?
The pricing options vary based on user requirements and access needs. Individual users may opt for single-user licenses, while businesses requiring broader access may choose multi-user or enterprise licenses for cost-effective access to the report.
13. Are there any additional resources or data provided in the Bromine Derivatives Market report?
While the report offers comprehensive insights, it's advisable to review the specific contents or supplementary materials provided to ascertain if additional resources or data are available.
14. How can I stay updated on further developments or reports in the Bromine Derivatives Market?
To stay informed about further developments, trends, and reports in the Bromine Derivatives Market, consider subscribing to industry newsletters, following relevant companies and organizations, or regularly checking reputable industry news sources and publications.
Methodology
Step 1 - Identification of Relevant Samples Size from Population Database


Step 2 - Approaches for Defining Global Market Size (Value, Volume* & Price*)

Note*: In applicable scenarios
Step 3 - Data Sources
Primary Research
- Web Analytics
- Survey Reports
- Research Institute
- Latest Research Reports
- Opinion Leaders
Secondary Research
- Annual Reports
- White Paper
- Latest Press Release
- Industry Association
- Paid Database
- Investor Presentations

Step 4 - Data Triangulation
Involves using different sources of information in order to increase the validity of a study
These sources are likely to be stakeholders in a program - participants, other researchers, program staff, other community members, and so on.
Then we put all data in single framework & apply various statistical tools to find out the dynamic on the market.
During the analysis stage, feedback from the stakeholder groups would be compared to determine areas of agreement as well as areas of divergence


