
Key Insights
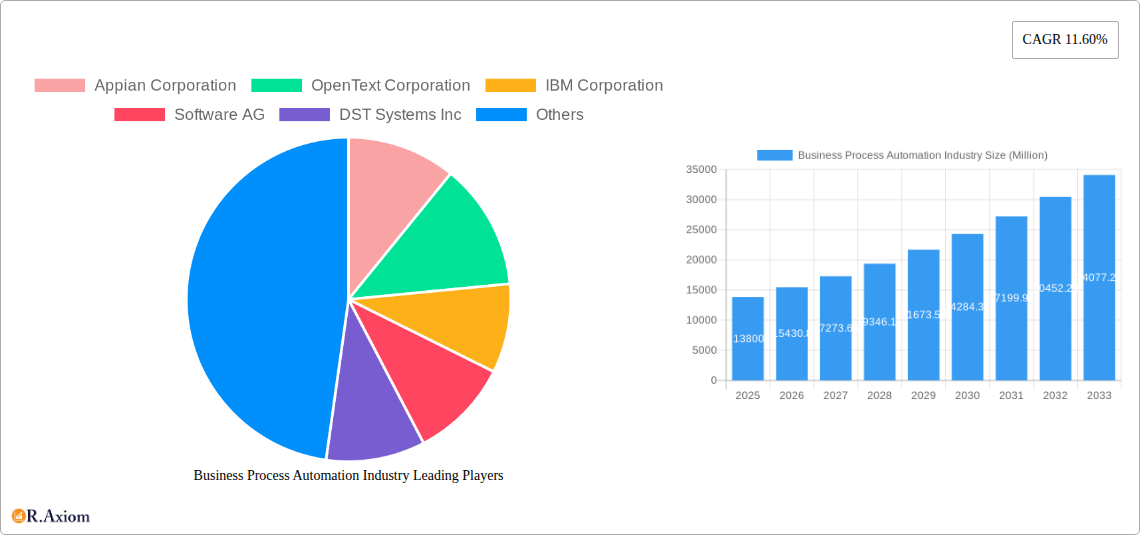
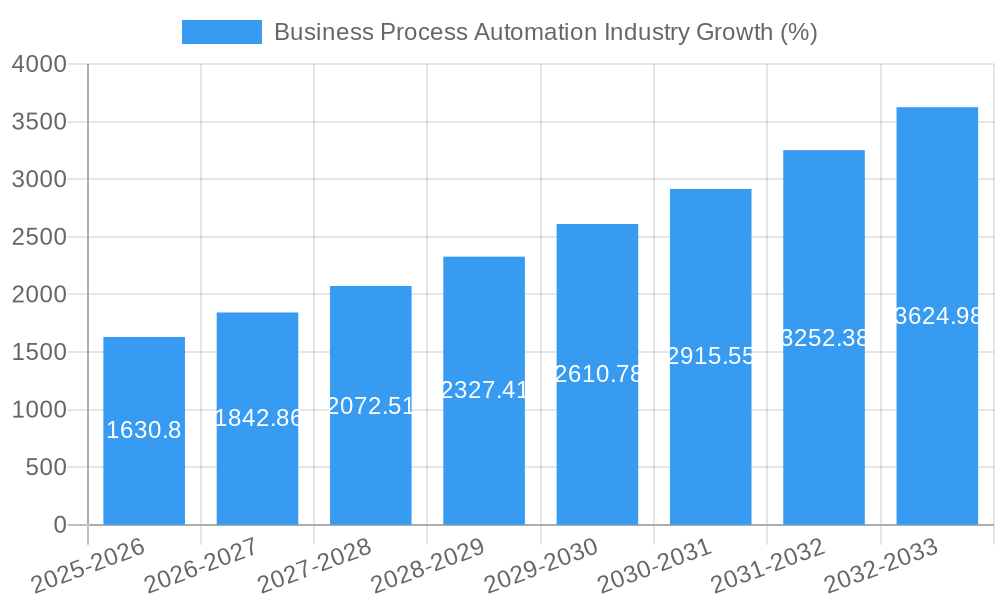
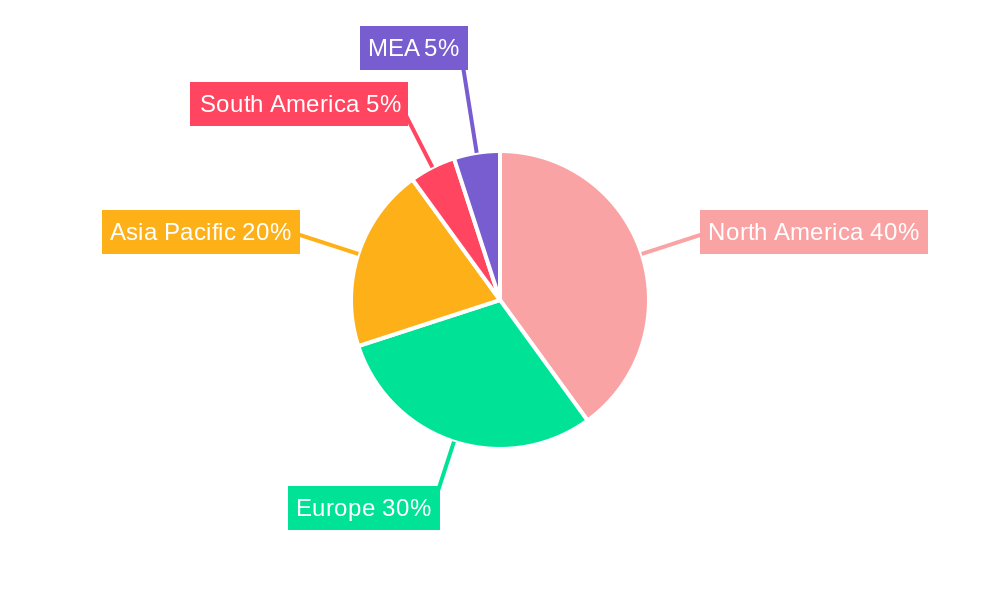
The Business Process Automation (BPA) market, valued at $13.80 billion in 2025, is experiencing robust growth, projected to expand at a Compound Annual Growth Rate (CAGR) of 11.6% from 2025 to 2033. This surge is driven by the increasing need for enhanced operational efficiency, reduced costs, and improved customer experiences across various industries. Key drivers include the rising adoption of cloud-based solutions, the growing demand for digital transformation initiatives, and the increasing complexity of business processes. Furthermore, the integration of artificial intelligence (AI) and machine learning (ML) into BPA solutions is fueling innovation and expanding the capabilities of these systems, enabling automation of previously complex or manual tasks. The market is segmented by component (solution and service), deployment (on-demand and on-premise), organization size (SMEs and large enterprises), and end-user industry (BFSI, manufacturing, IT & telecommunications, aerospace & defense, healthcare, retail & consumer goods, and others). North America currently holds a significant market share, followed by Europe and Asia Pacific, but rapid growth is anticipated in emerging economies in Asia Pacific and South America due to increasing digitalization efforts. Leading vendors include Appian Corporation, OpenText Corporation, IBM Corporation, Software AG, and others, constantly innovating to meet evolving business needs.
The competitive landscape is characterized by both established players and emerging niche providers. The market's growth trajectory is influenced by factors such as increasing cybersecurity concerns, the need for skilled workforce to implement and manage BPA systems, and the potential for integration challenges across diverse systems. However, the ongoing development of user-friendly interfaces and robust integration capabilities is mitigating these challenges. The long-term forecast predicts continued strong growth, driven by the sustained demand for improved efficiency, scalability, and agility in business operations. The increasing adoption of BPA solutions across various industry verticals will further propel market expansion throughout the forecast period, leading to substantial market value by 2033. The market's evolution will be shaped by ongoing technological advancements, evolving customer needs, and the emergence of innovative BPA solutions tailored to specific industry requirements.
Business Process Automation Industry: A Comprehensive Market Report (2019-2033)
This detailed report provides a comprehensive analysis of the Business Process Automation (BPA) industry, offering invaluable insights for stakeholders, investors, and industry professionals. Covering the period from 2019 to 2033, with a focus on 2025, this report leverages extensive market research to provide actionable intelligence on market size, growth drivers, challenges, and opportunities. The study period encompasses historical data (2019-2024), the base year (2025), and a forecast period (2025-2033). The report projects a market valuation reaching xx Million by 2033, exhibiting a CAGR of xx% during the forecast period. Key players analyzed include Appian Corporation, OpenText Corporation, IBM Corporation, Software AG, DST Systems Inc, TIBCO Software Inc, Pegasystems Inc, Oracle Corporation, Bizagi Group Limited, and Newgen Software Technologies Ltd. The report segments the market by component (solution, service), deployment (on-demand, on-premise), organization size (SMEs, large enterprises), and end-user industry (BFSI, manufacturing, IT & telecommunication, aerospace & defense, healthcare, retail & consumer goods, others).
Business Process Automation Industry Market Concentration & Innovation
The Business Process Automation industry exhibits a moderately concentrated landscape, with a few dominant players holding significant market share. In 2025, the top five companies are estimated to collectively hold approximately xx% of the market share. However, the market also features a significant number of smaller players, fostering competition and innovation. Market concentration is influenced by factors such as M&A activities, with deal values exceeding xx Million in recent years. These acquisitions often involve smaller companies with specialized solutions being integrated into larger platforms. Key innovation drivers include the rising adoption of cloud computing, AI, and machine learning. Regulatory frameworks, while varied across different geographies, largely encourage BPA adoption to improve efficiency and compliance. Product substitutes, primarily manual processes, are being rapidly replaced by BPA solutions, fueled by cost and efficiency benefits. End-user trends demonstrate a preference for flexible, scalable, and cost-effective solutions.
- Market Share (2025, estimated): Top 5 players - xx%; Others - xx%
- M&A Activity (2020-2024): Total deal value - xx Million; Average deal size - xx Million
- Key Innovation Drivers: AI, Machine Learning, Cloud Computing, Robotic Process Automation (RPA)
Business Process Automation Industry Industry Trends & Insights
The Business Process Automation industry is experiencing robust growth, driven by several factors. The increasing need for operational efficiency, improved customer experience, and reduced costs are pushing organizations to adopt BPA solutions. Technological advancements, such as AI-powered automation and cloud-based platforms, are further accelerating market growth. Consumer preferences are shifting toward user-friendly, scalable, and integrated solutions. Competitive dynamics are intense, with established players focusing on expanding their product portfolios and enhancing their capabilities through strategic partnerships and acquisitions. The market is witnessing a significant shift towards cloud-based deployments, offering greater flexibility and scalability. The growth is fueled by a surge in demand from large enterprises seeking to optimize their complex business processes. The CAGR for the forecast period (2025-2033) is estimated at xx%, while market penetration is expected to reach xx% by 2033.
Dominant Markets & Segments in Business Process Automation Industry
North America currently holds the dominant position in the Business Process Automation market, driven by strong technological advancements, high adoption rates, and a mature IT infrastructure. Within segments:
- By Component: The solution segment dominates, fueled by higher initial investments and longer-term benefits.
- By Deployment: The on-demand segment is experiencing rapid growth, driven by its flexibility and cost-effectiveness.
- By Organization Size: Large enterprises dominate due to their greater need for process optimization and higher investment capacity.
- By End-User: The BFSI sector is a major adopter, followed by the manufacturing and IT & telecommunications sectors.
Key Drivers:
- North America: Strong technological infrastructure, high adoption rates, robust funding.
- BFSI: Need for regulatory compliance, fraud prevention, and improved customer service.
- Manufacturing: Optimization of supply chains, production processes, and inventory management.
Business Process Automation Industry Product Developments
Recent product innovations focus on integrating AI, machine learning, and advanced analytics to enhance automation capabilities. This includes intelligent process automation (IPA), which combines RPA with AI to handle complex, unstructured data. The focus is on creating seamless integration with existing enterprise systems, offering intuitive user interfaces, and improving scalability and security. These developments cater to market demands for increased efficiency, reduced operational costs, and improved decision-making.
Report Scope & Segmentation Analysis
This report segments the Business Process Automation market by component (solution & service), deployment (on-demand & on-premise), organization size (SMEs & large enterprises), and end-user (BFSI, manufacturing, IT & Telecom, aerospace & defense, healthcare, retail & consumer goods, and others). Each segment's growth projection, market size, and competitive dynamics are analyzed in detail. The report projects significant growth across all segments, particularly in the cloud-based deployments and large enterprises segments.
Key Drivers of Business Process Automation Industry Growth
The growth of the Business Process Automation industry is fueled by several factors: the increasing need for improved operational efficiency and reduced operational costs across industries, the growing adoption of cloud-based solutions, and advancements in technologies like AI and machine learning. Government initiatives promoting digital transformation and automation also contribute significantly. The demand for improved customer experiences and enhanced decision-making further drives market expansion.
Challenges in the Business Process Automation Industry Sector
Key challenges include the high initial investment costs associated with implementing BPA solutions, the need for specialized skills and expertise, and concerns about data security and integration complexities. Resistance to change within organizations and a lack of awareness about BPA benefits can also hinder adoption. Furthermore, the competitive landscape, with both established and emerging players, presents challenges in maintaining market share and profitability.
Emerging Opportunities in Business Process Automation Industry
Emerging opportunities lie in the expansion into new markets (e.g., developing economies), integrating with emerging technologies (e.g., blockchain and IoT), and catering to specific industry needs (e.g., healthcare and supply chain management). The focus on hyperautomation, combining multiple automation technologies, presents a significant growth opportunity. The increasing adoption of low-code/no-code platforms is making BPA solutions accessible to a broader range of organizations.
Leading Players in the Business Process Automation Industry Market
- Appian Corporation
- OpenText Corporation
- IBM Corporation
- Software AG
- DST Systems Inc
- TIBCO Software Inc
- Pegasystems Inc
- Oracle Corporation
- Bizagi Group Limited
- Newgen Software Technologies Ltd
Key Developments in Business Process Automation Industry Industry
- July 2022: Oracle updates Fusion Sales, its AI-driven sales automation tool, enhancing deal closure speed and seller productivity.
- May 2022: Digital Workforce partners with Flowable to develop the Outsmart platform for fully automated business processes, leveraging best-of-breed technologies.
Strategic Outlook for Business Process Automation Industry Market
The Business Process Automation market is poised for significant growth, driven by continuous technological advancements, rising demand for operational efficiency, and increasing adoption across diverse industries. The market's future potential hinges on companies' ability to provide innovative, scalable, and user-friendly solutions that address specific industry challenges and incorporate emerging technologies effectively. The focus on hyperautomation and low-code/no-code platforms will be pivotal for expansion and market penetration.
Business Process Automation Industry Segmentation
-
1. Component
- 1.1. Solution
- 1.2. Service
-
2. Deployment
- 2.1. On-demand
- 2.2. On-premise
-
3. Organization Size
- 3.1. Small- and Medium-sized Enterprises
- 3.2. Large Enterprises
-
4. End User
- 4.1. Banking, Financial Services, and Insurance (BFSI)
- 4.2. Manufacturing
- 4.3. IT and Telecommunication
- 4.4. Aerospace and Defense
- 4.5. Healthcare
- 4.6. Retail and Consumer Goods
- 4.7. Other End Users
Business Process Automation Industry Segmentation By Geography
- 1. North America
- 2. Europe
- 3. Asia Pacific
- 4. Latin America
- 5. Middle East and Africa
Business Process Automation Industry REPORT HIGHLIGHTS
| Aspects | Details |
|---|---|
| Study Period | 2019-2033 |
| Base Year | 2024 |
| Estimated Year | 2025 |
| Forecast Period | 2025-2033 |
| Historical Period | 2019-2024 |
| Growth Rate | CAGR of 11.60% from 2019-2033 |
| Segmentation |
|
Table of Contents
- 1. Introduction
- 1.1. Research Scope
- 1.2. Market Segmentation
- 1.3. Research Methodology
- 1.4. Definitions and Assumptions
- 2. Executive Summary
- 2.1. Introduction
- 3. Market Dynamics
- 3.1. Introduction
- 3.2. Market Drivers
- 3.2.1. Increase Demand of Automating Business Process for Efficient Back-end process; Increase Adoption of Low Code Automation for Greater Accessibility
- 3.3. Market Restrains
- 3.3.1. Lack of Skilled Workforce
- 3.4. Market Trends
- 3.4.1. Small Enterprises are expected to grow at a higher pace on back of growing adoption of Business Process Management (BPM)
- 4. Market Factor Analysis
- 4.1. Porters Five Forces
- 4.2. Supply/Value Chain
- 4.3. PESTEL analysis
- 4.4. Market Entropy
- 4.5. Patent/Trademark Analysis
- 5. Global Business Process Automation Industry Analysis, Insights and Forecast, 2019-2031
- 5.1. Market Analysis, Insights and Forecast - by Component
- 5.1.1. Solution
- 5.1.2. Service
- 5.2. Market Analysis, Insights and Forecast - by Deployment
- 5.2.1. On-demand
- 5.2.2. On-premise
- 5.3. Market Analysis, Insights and Forecast - by Organization Size
- 5.3.1. Small- and Medium-sized Enterprises
- 5.3.2. Large Enterprises
- 5.4. Market Analysis, Insights and Forecast - by End User
- 5.4.1. Banking, Financial Services, and Insurance (BFSI)
- 5.4.2. Manufacturing
- 5.4.3. IT and Telecommunication
- 5.4.4. Aerospace and Defense
- 5.4.5. Healthcare
- 5.4.6. Retail and Consumer Goods
- 5.4.7. Other End Users
- 5.5. Market Analysis, Insights and Forecast - by Region
- 5.5.1. North America
- 5.5.2. Europe
- 5.5.3. Asia Pacific
- 5.5.4. Latin America
- 5.5.5. Middle East and Africa
- 5.1. Market Analysis, Insights and Forecast - by Component
- 6. North America Business Process Automation Industry Analysis, Insights and Forecast, 2019-2031
- 6.1. Market Analysis, Insights and Forecast - by Component
- 6.1.1. Solution
- 6.1.2. Service
- 6.2. Market Analysis, Insights and Forecast - by Deployment
- 6.2.1. On-demand
- 6.2.2. On-premise
- 6.3. Market Analysis, Insights and Forecast - by Organization Size
- 6.3.1. Small- and Medium-sized Enterprises
- 6.3.2. Large Enterprises
- 6.4. Market Analysis, Insights and Forecast - by End User
- 6.4.1. Banking, Financial Services, and Insurance (BFSI)
- 6.4.2. Manufacturing
- 6.4.3. IT and Telecommunication
- 6.4.4. Aerospace and Defense
- 6.4.5. Healthcare
- 6.4.6. Retail and Consumer Goods
- 6.4.7. Other End Users
- 6.1. Market Analysis, Insights and Forecast - by Component
- 7. Europe Business Process Automation Industry Analysis, Insights and Forecast, 2019-2031
- 7.1. Market Analysis, Insights and Forecast - by Component
- 7.1.1. Solution
- 7.1.2. Service
- 7.2. Market Analysis, Insights and Forecast - by Deployment
- 7.2.1. On-demand
- 7.2.2. On-premise
- 7.3. Market Analysis, Insights and Forecast - by Organization Size
- 7.3.1. Small- and Medium-sized Enterprises
- 7.3.2. Large Enterprises
- 7.4. Market Analysis, Insights and Forecast - by End User
- 7.4.1. Banking, Financial Services, and Insurance (BFSI)
- 7.4.2. Manufacturing
- 7.4.3. IT and Telecommunication
- 7.4.4. Aerospace and Defense
- 7.4.5. Healthcare
- 7.4.6. Retail and Consumer Goods
- 7.4.7. Other End Users
- 7.1. Market Analysis, Insights and Forecast - by Component
- 8. Asia Pacific Business Process Automation Industry Analysis, Insights and Forecast, 2019-2031
- 8.1. Market Analysis, Insights and Forecast - by Component
- 8.1.1. Solution
- 8.1.2. Service
- 8.2. Market Analysis, Insights and Forecast - by Deployment
- 8.2.1. On-demand
- 8.2.2. On-premise
- 8.3. Market Analysis, Insights and Forecast - by Organization Size
- 8.3.1. Small- and Medium-sized Enterprises
- 8.3.2. Large Enterprises
- 8.4. Market Analysis, Insights and Forecast - by End User
- 8.4.1. Banking, Financial Services, and Insurance (BFSI)
- 8.4.2. Manufacturing
- 8.4.3. IT and Telecommunication
- 8.4.4. Aerospace and Defense
- 8.4.5. Healthcare
- 8.4.6. Retail and Consumer Goods
- 8.4.7. Other End Users
- 8.1. Market Analysis, Insights and Forecast - by Component
- 9. Latin America Business Process Automation Industry Analysis, Insights and Forecast, 2019-2031
- 9.1. Market Analysis, Insights and Forecast - by Component
- 9.1.1. Solution
- 9.1.2. Service
- 9.2. Market Analysis, Insights and Forecast - by Deployment
- 9.2.1. On-demand
- 9.2.2. On-premise
- 9.3. Market Analysis, Insights and Forecast - by Organization Size
- 9.3.1. Small- and Medium-sized Enterprises
- 9.3.2. Large Enterprises
- 9.4. Market Analysis, Insights and Forecast - by End User
- 9.4.1. Banking, Financial Services, and Insurance (BFSI)
- 9.4.2. Manufacturing
- 9.4.3. IT and Telecommunication
- 9.4.4. Aerospace and Defense
- 9.4.5. Healthcare
- 9.4.6. Retail and Consumer Goods
- 9.4.7. Other End Users
- 9.1. Market Analysis, Insights and Forecast - by Component
- 10. Middle East and Africa Business Process Automation Industry Analysis, Insights and Forecast, 2019-2031
- 10.1. Market Analysis, Insights and Forecast - by Component
- 10.1.1. Solution
- 10.1.2. Service
- 10.2. Market Analysis, Insights and Forecast - by Deployment
- 10.2.1. On-demand
- 10.2.2. On-premise
- 10.3. Market Analysis, Insights and Forecast - by Organization Size
- 10.3.1. Small- and Medium-sized Enterprises
- 10.3.2. Large Enterprises
- 10.4. Market Analysis, Insights and Forecast - by End User
- 10.4.1. Banking, Financial Services, and Insurance (BFSI)
- 10.4.2. Manufacturing
- 10.4.3. IT and Telecommunication
- 10.4.4. Aerospace and Defense
- 10.4.5. Healthcare
- 10.4.6. Retail and Consumer Goods
- 10.4.7. Other End Users
- 10.1. Market Analysis, Insights and Forecast - by Component
- 11. North America Business Process Automation Industry Analysis, Insights and Forecast, 2019-2031
- 11.1. Market Analysis, Insights and Forecast - By Country/Sub-region
- 11.1.1 United States
- 11.1.2 Canada
- 11.1.3 Mexico
- 12. Europe Business Process Automation Industry Analysis, Insights and Forecast, 2019-2031
- 12.1. Market Analysis, Insights and Forecast - By Country/Sub-region
- 12.1.1 Germany
- 12.1.2 United Kingdom
- 12.1.3 France
- 12.1.4 Spain
- 12.1.5 Italy
- 12.1.6 Spain
- 12.1.7 Belgium
- 12.1.8 Netherland
- 12.1.9 Nordics
- 12.1.10 Rest of Europe
- 13. Asia Pacific Business Process Automation Industry Analysis, Insights and Forecast, 2019-2031
- 13.1. Market Analysis, Insights and Forecast - By Country/Sub-region
- 13.1.1 China
- 13.1.2 Japan
- 13.1.3 India
- 13.1.4 South Korea
- 13.1.5 Southeast Asia
- 13.1.6 Australia
- 13.1.7 Indonesia
- 13.1.8 Phillipes
- 13.1.9 Singapore
- 13.1.10 Thailandc
- 13.1.11 Rest of Asia Pacific
- 14. South America Business Process Automation Industry Analysis, Insights and Forecast, 2019-2031
- 14.1. Market Analysis, Insights and Forecast - By Country/Sub-region
- 14.1.1 Brazil
- 14.1.2 Argentina
- 14.1.3 Peru
- 14.1.4 Chile
- 14.1.5 Colombia
- 14.1.6 Ecuador
- 14.1.7 Venezuela
- 14.1.8 Rest of South America
- 15. North America Business Process Automation Industry Analysis, Insights and Forecast, 2019-2031
- 15.1. Market Analysis, Insights and Forecast - By Country/Sub-region
- 15.1.1 United States
- 15.1.2 Canada
- 15.1.3 Mexico
- 16. MEA Business Process Automation Industry Analysis, Insights and Forecast, 2019-2031
- 16.1. Market Analysis, Insights and Forecast - By Country/Sub-region
- 16.1.1 United Arab Emirates
- 16.1.2 Saudi Arabia
- 16.1.3 South Africa
- 16.1.4 Rest of Middle East and Africa
- 17. Competitive Analysis
- 17.1. Global Market Share Analysis 2024
- 17.2. Company Profiles
- 17.2.1 Appian Corporation
- 17.2.1.1. Overview
- 17.2.1.2. Products
- 17.2.1.3. SWOT Analysis
- 17.2.1.4. Recent Developments
- 17.2.1.5. Financials (Based on Availability)
- 17.2.2 OpenText Corporation
- 17.2.2.1. Overview
- 17.2.2.2. Products
- 17.2.2.3. SWOT Analysis
- 17.2.2.4. Recent Developments
- 17.2.2.5. Financials (Based on Availability)
- 17.2.3 IBM Corporation
- 17.2.3.1. Overview
- 17.2.3.2. Products
- 17.2.3.3. SWOT Analysis
- 17.2.3.4. Recent Developments
- 17.2.3.5. Financials (Based on Availability)
- 17.2.4 Software AG
- 17.2.4.1. Overview
- 17.2.4.2. Products
- 17.2.4.3. SWOT Analysis
- 17.2.4.4. Recent Developments
- 17.2.4.5. Financials (Based on Availability)
- 17.2.5 DST Systems Inc
- 17.2.5.1. Overview
- 17.2.5.2. Products
- 17.2.5.3. SWOT Analysis
- 17.2.5.4. Recent Developments
- 17.2.5.5. Financials (Based on Availability)
- 17.2.6 TIBCO Software Inc *List Not Exhaustive
- 17.2.6.1. Overview
- 17.2.6.2. Products
- 17.2.6.3. SWOT Analysis
- 17.2.6.4. Recent Developments
- 17.2.6.5. Financials (Based on Availability)
- 17.2.7 Pegasystems Inc
- 17.2.7.1. Overview
- 17.2.7.2. Products
- 17.2.7.3. SWOT Analysis
- 17.2.7.4. Recent Developments
- 17.2.7.5. Financials (Based on Availability)
- 17.2.8 Oracle Corporation
- 17.2.8.1. Overview
- 17.2.8.2. Products
- 17.2.8.3. SWOT Analysis
- 17.2.8.4. Recent Developments
- 17.2.8.5. Financials (Based on Availability)
- 17.2.9 Bizagi Group Limited
- 17.2.9.1. Overview
- 17.2.9.2. Products
- 17.2.9.3. SWOT Analysis
- 17.2.9.4. Recent Developments
- 17.2.9.5. Financials (Based on Availability)
- 17.2.10 Newgen Software Technologies Ltd
- 17.2.10.1. Overview
- 17.2.10.2. Products
- 17.2.10.3. SWOT Analysis
- 17.2.10.4. Recent Developments
- 17.2.10.5. Financials (Based on Availability)
- 17.2.1 Appian Corporation
List of Figures
- Figure 1: Global Business Process Automation Industry Revenue Breakdown (Million, %) by Region 2024 & 2032
- Figure 2: North America Business Process Automation Industry Revenue (Million), by Country 2024 & 2032
- Figure 3: North America Business Process Automation Industry Revenue Share (%), by Country 2024 & 2032
- Figure 4: Europe Business Process Automation Industry Revenue (Million), by Country 2024 & 2032
- Figure 5: Europe Business Process Automation Industry Revenue Share (%), by Country 2024 & 2032
- Figure 6: Asia Pacific Business Process Automation Industry Revenue (Million), by Country 2024 & 2032
- Figure 7: Asia Pacific Business Process Automation Industry Revenue Share (%), by Country 2024 & 2032
- Figure 8: South America Business Process Automation Industry Revenue (Million), by Country 2024 & 2032
- Figure 9: South America Business Process Automation Industry Revenue Share (%), by Country 2024 & 2032
- Figure 10: North America Business Process Automation Industry Revenue (Million), by Country 2024 & 2032
- Figure 11: North America Business Process Automation Industry Revenue Share (%), by Country 2024 & 2032
- Figure 12: MEA Business Process Automation Industry Revenue (Million), by Country 2024 & 2032
- Figure 13: MEA Business Process Automation Industry Revenue Share (%), by Country 2024 & 2032
- Figure 14: North America Business Process Automation Industry Revenue (Million), by Component 2024 & 2032
- Figure 15: North America Business Process Automation Industry Revenue Share (%), by Component 2024 & 2032
- Figure 16: North America Business Process Automation Industry Revenue (Million), by Deployment 2024 & 2032
- Figure 17: North America Business Process Automation Industry Revenue Share (%), by Deployment 2024 & 2032
- Figure 18: North America Business Process Automation Industry Revenue (Million), by Organization Size 2024 & 2032
- Figure 19: North America Business Process Automation Industry Revenue Share (%), by Organization Size 2024 & 2032
- Figure 20: North America Business Process Automation Industry Revenue (Million), by End User 2024 & 2032
- Figure 21: North America Business Process Automation Industry Revenue Share (%), by End User 2024 & 2032
- Figure 22: North America Business Process Automation Industry Revenue (Million), by Country 2024 & 2032
- Figure 23: North America Business Process Automation Industry Revenue Share (%), by Country 2024 & 2032
- Figure 24: Europe Business Process Automation Industry Revenue (Million), by Component 2024 & 2032
- Figure 25: Europe Business Process Automation Industry Revenue Share (%), by Component 2024 & 2032
- Figure 26: Europe Business Process Automation Industry Revenue (Million), by Deployment 2024 & 2032
- Figure 27: Europe Business Process Automation Industry Revenue Share (%), by Deployment 2024 & 2032
- Figure 28: Europe Business Process Automation Industry Revenue (Million), by Organization Size 2024 & 2032
- Figure 29: Europe Business Process Automation Industry Revenue Share (%), by Organization Size 2024 & 2032
- Figure 30: Europe Business Process Automation Industry Revenue (Million), by End User 2024 & 2032
- Figure 31: Europe Business Process Automation Industry Revenue Share (%), by End User 2024 & 2032
- Figure 32: Europe Business Process Automation Industry Revenue (Million), by Country 2024 & 2032
- Figure 33: Europe Business Process Automation Industry Revenue Share (%), by Country 2024 & 2032
- Figure 34: Asia Pacific Business Process Automation Industry Revenue (Million), by Component 2024 & 2032
- Figure 35: Asia Pacific Business Process Automation Industry Revenue Share (%), by Component 2024 & 2032
- Figure 36: Asia Pacific Business Process Automation Industry Revenue (Million), by Deployment 2024 & 2032
- Figure 37: Asia Pacific Business Process Automation Industry Revenue Share (%), by Deployment 2024 & 2032
- Figure 38: Asia Pacific Business Process Automation Industry Revenue (Million), by Organization Size 2024 & 2032
- Figure 39: Asia Pacific Business Process Automation Industry Revenue Share (%), by Organization Size 2024 & 2032
- Figure 40: Asia Pacific Business Process Automation Industry Revenue (Million), by End User 2024 & 2032
- Figure 41: Asia Pacific Business Process Automation Industry Revenue Share (%), by End User 2024 & 2032
- Figure 42: Asia Pacific Business Process Automation Industry Revenue (Million), by Country 2024 & 2032
- Figure 43: Asia Pacific Business Process Automation Industry Revenue Share (%), by Country 2024 & 2032
- Figure 44: Latin America Business Process Automation Industry Revenue (Million), by Component 2024 & 2032
- Figure 45: Latin America Business Process Automation Industry Revenue Share (%), by Component 2024 & 2032
- Figure 46: Latin America Business Process Automation Industry Revenue (Million), by Deployment 2024 & 2032
- Figure 47: Latin America Business Process Automation Industry Revenue Share (%), by Deployment 2024 & 2032
- Figure 48: Latin America Business Process Automation Industry Revenue (Million), by Organization Size 2024 & 2032
- Figure 49: Latin America Business Process Automation Industry Revenue Share (%), by Organization Size 2024 & 2032
- Figure 50: Latin America Business Process Automation Industry Revenue (Million), by End User 2024 & 2032
- Figure 51: Latin America Business Process Automation Industry Revenue Share (%), by End User 2024 & 2032
- Figure 52: Latin America Business Process Automation Industry Revenue (Million), by Country 2024 & 2032
- Figure 53: Latin America Business Process Automation Industry Revenue Share (%), by Country 2024 & 2032
- Figure 54: Middle East and Africa Business Process Automation Industry Revenue (Million), by Component 2024 & 2032
- Figure 55: Middle East and Africa Business Process Automation Industry Revenue Share (%), by Component 2024 & 2032
- Figure 56: Middle East and Africa Business Process Automation Industry Revenue (Million), by Deployment 2024 & 2032
- Figure 57: Middle East and Africa Business Process Automation Industry Revenue Share (%), by Deployment 2024 & 2032
- Figure 58: Middle East and Africa Business Process Automation Industry Revenue (Million), by Organization Size 2024 & 2032
- Figure 59: Middle East and Africa Business Process Automation Industry Revenue Share (%), by Organization Size 2024 & 2032
- Figure 60: Middle East and Africa Business Process Automation Industry Revenue (Million), by End User 2024 & 2032
- Figure 61: Middle East and Africa Business Process Automation Industry Revenue Share (%), by End User 2024 & 2032
- Figure 62: Middle East and Africa Business Process Automation Industry Revenue (Million), by Country 2024 & 2032
- Figure 63: Middle East and Africa Business Process Automation Industry Revenue Share (%), by Country 2024 & 2032
List of Tables
- Table 1: Global Business Process Automation Industry Revenue Million Forecast, by Region 2019 & 2032
- Table 2: Global Business Process Automation Industry Revenue Million Forecast, by Component 2019 & 2032
- Table 3: Global Business Process Automation Industry Revenue Million Forecast, by Deployment 2019 & 2032
- Table 4: Global Business Process Automation Industry Revenue Million Forecast, by Organization Size 2019 & 2032
- Table 5: Global Business Process Automation Industry Revenue Million Forecast, by End User 2019 & 2032
- Table 6: Global Business Process Automation Industry Revenue Million Forecast, by Region 2019 & 2032
- Table 7: Global Business Process Automation Industry Revenue Million Forecast, by Country 2019 & 2032
- Table 8: United States Business Process Automation Industry Revenue (Million) Forecast, by Application 2019 & 2032
- Table 9: Canada Business Process Automation Industry Revenue (Million) Forecast, by Application 2019 & 2032
- Table 10: Mexico Business Process Automation Industry Revenue (Million) Forecast, by Application 2019 & 2032
- Table 11: Global Business Process Automation Industry Revenue Million Forecast, by Country 2019 & 2032
- Table 12: Germany Business Process Automation Industry Revenue (Million) Forecast, by Application 2019 & 2032
- Table 13: United Kingdom Business Process Automation Industry Revenue (Million) Forecast, by Application 2019 & 2032
- Table 14: France Business Process Automation Industry Revenue (Million) Forecast, by Application 2019 & 2032
- Table 15: Spain Business Process Automation Industry Revenue (Million) Forecast, by Application 2019 & 2032
- Table 16: Italy Business Process Automation Industry Revenue (Million) Forecast, by Application 2019 & 2032
- Table 17: Spain Business Process Automation Industry Revenue (Million) Forecast, by Application 2019 & 2032
- Table 18: Belgium Business Process Automation Industry Revenue (Million) Forecast, by Application 2019 & 2032
- Table 19: Netherland Business Process Automation Industry Revenue (Million) Forecast, by Application 2019 & 2032
- Table 20: Nordics Business Process Automation Industry Revenue (Million) Forecast, by Application 2019 & 2032
- Table 21: Rest of Europe Business Process Automation Industry Revenue (Million) Forecast, by Application 2019 & 2032
- Table 22: Global Business Process Automation Industry Revenue Million Forecast, by Country 2019 & 2032
- Table 23: China Business Process Automation Industry Revenue (Million) Forecast, by Application 2019 & 2032
- Table 24: Japan Business Process Automation Industry Revenue (Million) Forecast, by Application 2019 & 2032
- Table 25: India Business Process Automation Industry Revenue (Million) Forecast, by Application 2019 & 2032
- Table 26: South Korea Business Process Automation Industry Revenue (Million) Forecast, by Application 2019 & 2032
- Table 27: Southeast Asia Business Process Automation Industry Revenue (Million) Forecast, by Application 2019 & 2032
- Table 28: Australia Business Process Automation Industry Revenue (Million) Forecast, by Application 2019 & 2032
- Table 29: Indonesia Business Process Automation Industry Revenue (Million) Forecast, by Application 2019 & 2032
- Table 30: Phillipes Business Process Automation Industry Revenue (Million) Forecast, by Application 2019 & 2032
- Table 31: Singapore Business Process Automation Industry Revenue (Million) Forecast, by Application 2019 & 2032
- Table 32: Thailandc Business Process Automation Industry Revenue (Million) Forecast, by Application 2019 & 2032
- Table 33: Rest of Asia Pacific Business Process Automation Industry Revenue (Million) Forecast, by Application 2019 & 2032
- Table 34: Global Business Process Automation Industry Revenue Million Forecast, by Country 2019 & 2032
- Table 35: Brazil Business Process Automation Industry Revenue (Million) Forecast, by Application 2019 & 2032
- Table 36: Argentina Business Process Automation Industry Revenue (Million) Forecast, by Application 2019 & 2032
- Table 37: Peru Business Process Automation Industry Revenue (Million) Forecast, by Application 2019 & 2032
- Table 38: Chile Business Process Automation Industry Revenue (Million) Forecast, by Application 2019 & 2032
- Table 39: Colombia Business Process Automation Industry Revenue (Million) Forecast, by Application 2019 & 2032
- Table 40: Ecuador Business Process Automation Industry Revenue (Million) Forecast, by Application 2019 & 2032
- Table 41: Venezuela Business Process Automation Industry Revenue (Million) Forecast, by Application 2019 & 2032
- Table 42: Rest of South America Business Process Automation Industry Revenue (Million) Forecast, by Application 2019 & 2032
- Table 43: Global Business Process Automation Industry Revenue Million Forecast, by Country 2019 & 2032
- Table 44: United States Business Process Automation Industry Revenue (Million) Forecast, by Application 2019 & 2032
- Table 45: Canada Business Process Automation Industry Revenue (Million) Forecast, by Application 2019 & 2032
- Table 46: Mexico Business Process Automation Industry Revenue (Million) Forecast, by Application 2019 & 2032
- Table 47: Global Business Process Automation Industry Revenue Million Forecast, by Country 2019 & 2032
- Table 48: United Arab Emirates Business Process Automation Industry Revenue (Million) Forecast, by Application 2019 & 2032
- Table 49: Saudi Arabia Business Process Automation Industry Revenue (Million) Forecast, by Application 2019 & 2032
- Table 50: South Africa Business Process Automation Industry Revenue (Million) Forecast, by Application 2019 & 2032
- Table 51: Rest of Middle East and Africa Business Process Automation Industry Revenue (Million) Forecast, by Application 2019 & 2032
- Table 52: Global Business Process Automation Industry Revenue Million Forecast, by Component 2019 & 2032
- Table 53: Global Business Process Automation Industry Revenue Million Forecast, by Deployment 2019 & 2032
- Table 54: Global Business Process Automation Industry Revenue Million Forecast, by Organization Size 2019 & 2032
- Table 55: Global Business Process Automation Industry Revenue Million Forecast, by End User 2019 & 2032
- Table 56: Global Business Process Automation Industry Revenue Million Forecast, by Country 2019 & 2032
- Table 57: Global Business Process Automation Industry Revenue Million Forecast, by Component 2019 & 2032
- Table 58: Global Business Process Automation Industry Revenue Million Forecast, by Deployment 2019 & 2032
- Table 59: Global Business Process Automation Industry Revenue Million Forecast, by Organization Size 2019 & 2032
- Table 60: Global Business Process Automation Industry Revenue Million Forecast, by End User 2019 & 2032
- Table 61: Global Business Process Automation Industry Revenue Million Forecast, by Country 2019 & 2032
- Table 62: Global Business Process Automation Industry Revenue Million Forecast, by Component 2019 & 2032
- Table 63: Global Business Process Automation Industry Revenue Million Forecast, by Deployment 2019 & 2032
- Table 64: Global Business Process Automation Industry Revenue Million Forecast, by Organization Size 2019 & 2032
- Table 65: Global Business Process Automation Industry Revenue Million Forecast, by End User 2019 & 2032
- Table 66: Global Business Process Automation Industry Revenue Million Forecast, by Country 2019 & 2032
- Table 67: Global Business Process Automation Industry Revenue Million Forecast, by Component 2019 & 2032
- Table 68: Global Business Process Automation Industry Revenue Million Forecast, by Deployment 2019 & 2032
- Table 69: Global Business Process Automation Industry Revenue Million Forecast, by Organization Size 2019 & 2032
- Table 70: Global Business Process Automation Industry Revenue Million Forecast, by End User 2019 & 2032
- Table 71: Global Business Process Automation Industry Revenue Million Forecast, by Country 2019 & 2032
- Table 72: Global Business Process Automation Industry Revenue Million Forecast, by Component 2019 & 2032
- Table 73: Global Business Process Automation Industry Revenue Million Forecast, by Deployment 2019 & 2032
- Table 74: Global Business Process Automation Industry Revenue Million Forecast, by Organization Size 2019 & 2032
- Table 75: Global Business Process Automation Industry Revenue Million Forecast, by End User 2019 & 2032
- Table 76: Global Business Process Automation Industry Revenue Million Forecast, by Country 2019 & 2032
Frequently Asked Questions
1. What is the projected Compound Annual Growth Rate (CAGR) of the Business Process Automation Industry?
The projected CAGR is approximately 11.60%.
2. Which companies are prominent players in the Business Process Automation Industry?
Key companies in the market include Appian Corporation, OpenText Corporation, IBM Corporation, Software AG, DST Systems Inc, TIBCO Software Inc *List Not Exhaustive, Pegasystems Inc, Oracle Corporation, Bizagi Group Limited, Newgen Software Technologies Ltd.
3. What are the main segments of the Business Process Automation Industry?
The market segments include Component, Deployment, Organization Size, End User.
4. Can you provide details about the market size?
The market size is estimated to be USD 13.80 Million as of 2022.
5. What are some drivers contributing to market growth?
Increase Demand of Automating Business Process for Efficient Back-end process; Increase Adoption of Low Code Automation for Greater Accessibility.
6. What are the notable trends driving market growth?
Small Enterprises are expected to grow at a higher pace on back of growing adoption of Business Process Management (BPM).
7. Are there any restraints impacting market growth?
Lack of Skilled Workforce.
8. Can you provide examples of recent developments in the market?
July 2022 - Oracle Fusion Sales, a sales automation tool that locates high-quality sales opportunities and helps sellers close deals more quickly, has just received an update, according to Oracle. Fusion Sales is an artificial intelligence (AI)-driven component of Oracle Fusion Cloud Customer Experience (CX) that automatically offers sellers prices, recommendations, and suggested next steps in order to help them close more deals, work more productively, and inspire trust in their customers.
9. What pricing options are available for accessing the report?
Pricing options include single-user, multi-user, and enterprise licenses priced at USD 4750, USD 5250, and USD 8750 respectively.
10. Is the market size provided in terms of value or volume?
The market size is provided in terms of value, measured in Million.
11. Are there any specific market keywords associated with the report?
Yes, the market keyword associated with the report is "Business Process Automation Industry," which aids in identifying and referencing the specific market segment covered.
12. How do I determine which pricing option suits my needs best?
The pricing options vary based on user requirements and access needs. Individual users may opt for single-user licenses, while businesses requiring broader access may choose multi-user or enterprise licenses for cost-effective access to the report.
13. Are there any additional resources or data provided in the Business Process Automation Industry report?
While the report offers comprehensive insights, it's advisable to review the specific contents or supplementary materials provided to ascertain if additional resources or data are available.
14. How can I stay updated on further developments or reports in the Business Process Automation Industry?
To stay informed about further developments, trends, and reports in the Business Process Automation Industry, consider subscribing to industry newsletters, following relevant companies and organizations, or regularly checking reputable industry news sources and publications.
Methodology
Step 1 - Identification of Relevant Samples Size from Population Database


Step 2 - Approaches for Defining Global Market Size (Value, Volume* & Price*)

Note*: In applicable scenarios
Step 3 - Data Sources
Primary Research
- Web Analytics
- Survey Reports
- Research Institute
- Latest Research Reports
- Opinion Leaders
Secondary Research
- Annual Reports
- White Paper
- Latest Press Release
- Industry Association
- Paid Database
- Investor Presentations

Step 4 - Data Triangulation
Involves using different sources of information in order to increase the validity of a study
These sources are likely to be stakeholders in a program - participants, other researchers, program staff, other community members, and so on.
Then we put all data in single framework & apply various statistical tools to find out the dynamic on the market.
During the analysis stage, feedback from the stakeholder groups would be compared to determine areas of agreement as well as areas of divergence


