
Key Insights
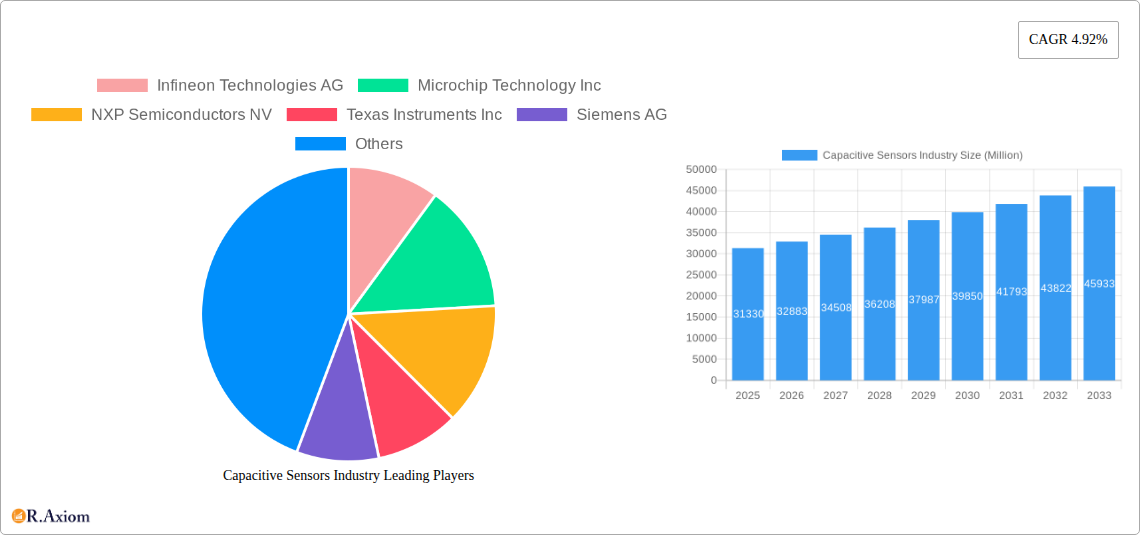
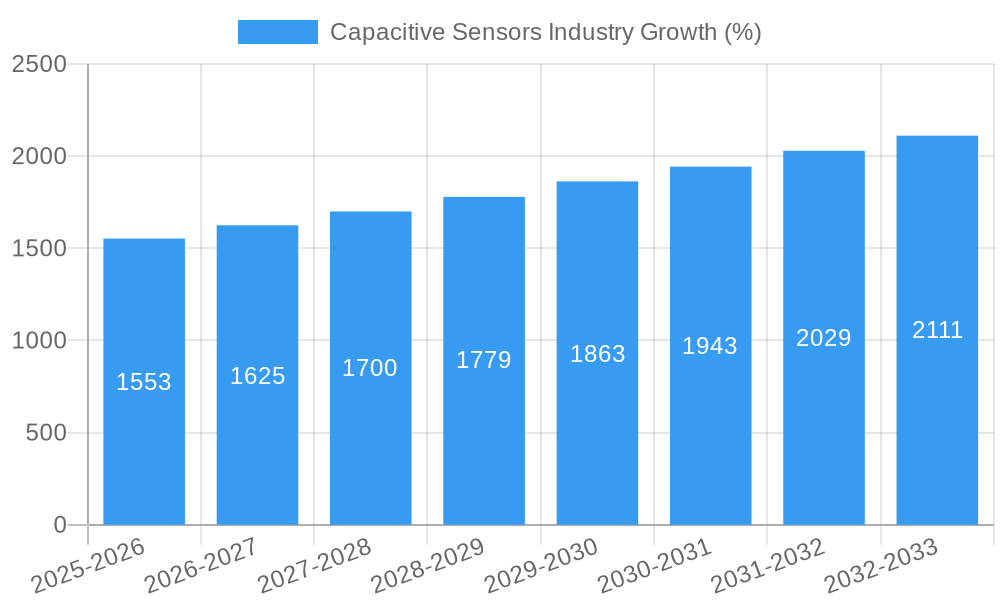
The capacitive sensor market, valued at $31.33 billion in 2025, is projected to experience robust growth, driven by a compound annual growth rate (CAGR) of 4.92% from 2025 to 2033. This expansion is fueled by several key factors. The increasing adoption of capacitive sensors in consumer electronics, particularly smartphones and tablets, continues to be a significant driver. Advancements in sensor technology, leading to improved sensitivity, accuracy, and miniaturization, are further boosting market growth. The automotive industry's transition towards advanced driver-assistance systems (ADAS) and autonomous driving necessitates sophisticated sensor integration, creating substantial demand for capacitive sensors. Similarly, the healthcare sector's adoption of touch-sensitive medical equipment and the expansion of the Internet of Medical Things (IoMT) contribute to market expansion. Growth within the industrial automation sector, specifically in robotics and process control, is also a significant factor, demanding reliable and durable capacitive sensing solutions. While competition among established players and potential price fluctuations represent challenges, ongoing technological innovation and broadening applications across various end-user industries are poised to propel significant market expansion in the coming years.
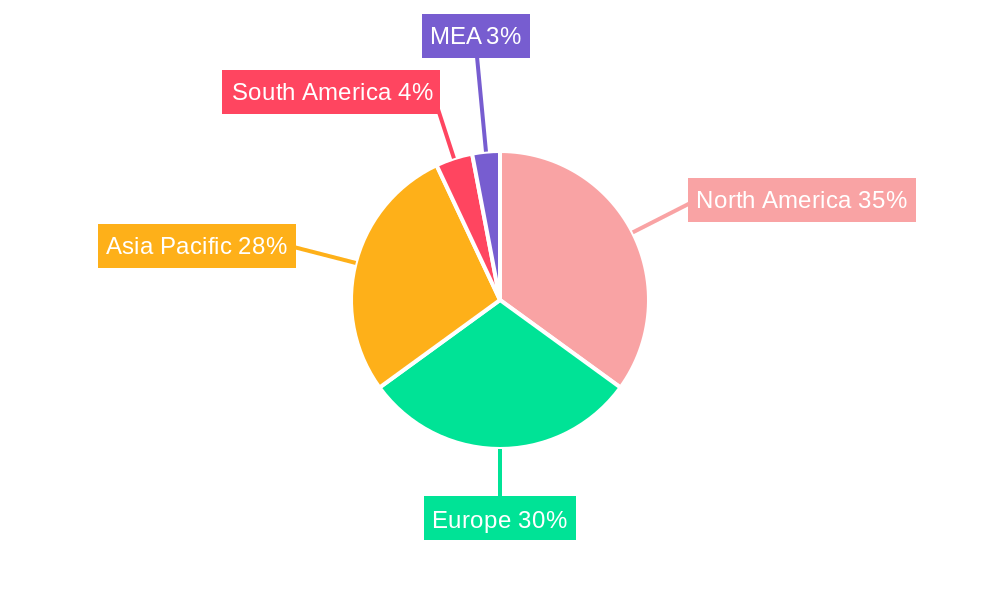
The geographical distribution of the market shows a strong presence across North America, Europe, and Asia Pacific. North America, with its established technological infrastructure and high consumer electronics adoption, holds a significant market share. Europe follows closely, benefiting from a strong automotive industry and the increasing integration of smart technologies in various sectors. Asia Pacific, particularly China, Japan, and India, demonstrates rapid growth driven by increasing manufacturing, rising disposable incomes, and expanding technological adoption rates. While South America and the Middle East and Africa exhibit slower growth currently, they present significant future opportunities as these regions undergo technological advancements and infrastructure improvements. The market segmentation by sensor type (touch, motion, position, others) and end-user industry showcases diverse application areas, indicating a dynamic and multifaceted market landscape with considerable potential for continued expansion. The leading companies, including Infineon, Microchip Technology, NXP Semiconductors, and Texas Instruments, are constantly innovating and expanding their product portfolios, further intensifying market competitiveness and driving down costs which benefits consumers.
Capacitive Sensors Industry: A Comprehensive Market Report (2019-2033)
This in-depth report provides a comprehensive analysis of the Capacitive Sensors industry, covering market size, segmentation, growth drivers, challenges, and key players. The study period spans from 2019 to 2033, with 2025 serving as the base and estimated year. The forecast period extends from 2025 to 2033, while the historical period encompasses 2019-2024. This report is invaluable for industry stakeholders, investors, and market researchers seeking to understand the current landscape and future trajectory of this dynamic market. The market is expected to reach xx Million by 2033, exhibiting a CAGR of xx% during the forecast period.
Capacitive Sensors Industry Market Concentration & Innovation
The capacitive sensors market exhibits a moderately concentrated landscape, with several major players holding significant market share. Infineon Technologies AG, Microchip Technology Inc, NXP Semiconductors NV, and Texas Instruments Inc are among the leading companies, collectively accounting for an estimated xx% of the global market in 2024. Market share is dynamic, influenced by factors such as R&D investments, strategic partnerships, and mergers and acquisitions (M&A). Recent M&A activities, while not publicly disclosing specific deal values in all instances, indicate a trend toward consolidation within the industry. For example, [Insert example of relevant M&A activity if available, otherwise state "Specific deal values are not publicly available for all transactions, but activity suggests consolidation."].
Innovation is a key driver, with continuous advancements in sensor technology, miniaturization, and integration capabilities. Regulatory frameworks, particularly concerning safety and data privacy, play a significant role in shaping market dynamics. Product substitutes, such as optical sensors and ultrasonic sensors, present competitive challenges, though capacitive sensors maintain advantages in certain applications due to cost-effectiveness and performance. End-user trends favoring smart devices and automation fuel demand for capacitive sensors across various sectors.
Capacitive Sensors Industry Industry Trends & Insights
The capacitive sensors market is experiencing robust growth, driven primarily by the increasing demand for touch-enabled devices, advanced driver-assistance systems (ADAS) in the automotive sector, and the proliferation of IoT applications. The global market size is estimated at xx Million in 2025 and is projected to reach xx Million by 2033, representing a CAGR of xx%. Technological disruptions, including the development of more sensitive, power-efficient, and cost-effective sensors, are further accelerating market expansion. Consumer preferences towards smaller, more intuitive, and responsive devices are also driving innovation. The competitive dynamics are characterized by intense competition among established players and the emergence of new entrants, particularly in niche applications. Market penetration is high in established segments like consumer electronics, while growth potential remains considerable in emerging areas such as healthcare and industrial automation.
Dominant Markets & Segments in Capacitive Sensors Industry
The consumer electronics segment dominates the capacitive sensors market, driven by the widespread adoption of smartphones, tablets, and other touch-enabled devices. Within the "By Type" segmentation, touch sensors hold the largest market share due to their prevalence in consumer electronics.
Key Drivers for Consumer Electronics Dominance: High consumer electronics penetration rates globally, increasing demand for advanced features in smartphones and tablets, and continuous miniaturization of sensors.
Automotive Segment Growth: The automotive segment is another significant contributor, fueled by the increasing integration of ADAS and infotainment systems. This segment is projected to exhibit robust growth in the forecast period.
Geographic Dominance: [Insert details on leading region/country. If data is unavailable, state "Further regional breakdown requires additional data."]
The other segments, including aerospace and defense, healthcare, and industrial applications, are experiencing steady growth, although at a slower pace compared to consumer electronics and automotive. However, these segments present substantial opportunities for expansion as adoption rates increase.
Capacitive Sensors Industry Product Developments
Recent product innovations highlight a strong focus on improving sensor performance, reducing power consumption, and enhancing integration capabilities. For instance, the development of flexible and curved capacitive sensors is enabling seamless integration into curved device surfaces, as exemplified by Fingerprint Cards AB's FPC1552 sensor used in Xiaomi's Redmi K50. This trend underlines the market's responsiveness to user experience demands and design innovations. Moreover, the emergence of multi-functional sensors integrating various sensing modalities is expected to drive further growth and enhance market competitiveness.
Report Scope & Segmentation Analysis
This report segments the capacitive sensors market by type (touch sensor, motion sensor, position sensor, other types) and by end-user industry (consumer electronics, automotive, aerospace and defense, healthcare, food and beverages, oil and gas, other end-user industries). Each segment is analyzed in detail, providing insights into growth projections, market size, and competitive dynamics. For example, the touch sensor segment is the largest, driven by the widespread use in consumer electronics, while the automotive segment shows the highest growth potential. Detailed regional breakdowns are also included for each segment, providing a granular view of market distribution and trends.
Key Drivers of Capacitive Sensors Industry Growth
The capacitive sensors market growth is fueled by several key factors: the rising demand for touch-enabled devices and the increasing adoption of IoT technology across various sectors; technological advancements leading to higher sensitivity, miniaturization, and reduced power consumption of sensors; and government initiatives promoting technological advancements and automation in various industries. The automotive industry's shift toward ADAS further boosts demand for advanced sensing solutions.
Challenges in the Capacitive Sensors Industry Sector
The industry faces challenges like the availability and cost of raw materials, particularly during periods of global supply chain disruptions which impact manufacturing costs and timelines. Intense competition from existing players and emerging companies requires constant innovation and cost optimization to maintain market share. Furthermore, stringent regulatory requirements relating to sensor safety and data privacy necessitate compliance investments.
Emerging Opportunities in Capacitive Sensors Industry
Emerging opportunities lie in the integration of capacitive sensors into new applications such as augmented reality/virtual reality devices and advanced wearable technology. The expanding use of capacitive sensors in healthcare for monitoring vital signs and in industrial automation for precision control offers substantial growth potential. Furthermore, the development of highly sensitive and miniaturized sensors opens new avenues for market expansion in niche sectors like robotics and environmental monitoring.
Leading Players in the Capacitive Sensors Industry Market
- Infineon Technologies AG
- Microchip Technology Inc
- NXP Semiconductors NV
- Texas Instruments Inc
- Siemens AG
- 3M Company
- Omron Corporation
- STMicroelectronics NV
- Fujitsu Limited
- Sony Corporation
- TDK Corporation
- Analog Devices Inc
Key Developments in Capacitive Sensors Industry Industry
- February 2022: Fingerprint Cards AB's FPC1552 curved capacitive touch sensor integrated into Xiaomi's Redmi K50 smartphone, showcasing advancements in sensor design and seamless integration.
- February 2022: Hogar Controls Inc launched its Prima+ Smart Touch Panel line, expanding the application of capacitive touch technology in smart home solutions.
Strategic Outlook for Capacitive Sensors Industry Market
The future of the capacitive sensors market is promising, driven by continuous technological advancements, growing demand across various sectors, and the emergence of new applications. The market is poised for significant growth, particularly in the automotive, healthcare, and industrial automation sectors. Strategic investments in R&D and strategic partnerships are crucial for companies seeking to capitalize on this market potential and maintain a competitive edge.
Capacitive Sensors Industry Segmentation
-
1. Type
- 1.1. Touch Sensor
- 1.2. Motion Sensor
- 1.3. Position Sensor
- 1.4. Other Types
-
2. End-user Industry
- 2.1. Consumer Electronics
- 2.2. Automotive
- 2.3. Aerospace and Defense
- 2.4. Healthcare
- 2.5. Food and Beverages
- 2.6. Oil and Gas
- 2.7. Other End-user Industries
Capacitive Sensors Industry Segmentation By Geography
-
1. North America
- 1.1. United States
- 1.2. Canada
-
2. Europe
- 2.1. United Kingdom
- 2.2. Germany
- 2.3. France
- 2.4. Italy
-
3. Asia
- 3.1. China
- 3.2. Japan
- 3.3. India
- 3.4. South Korea
-
4. Latin America
- 4.1. Mexico
- 4.2. Brazil
- 5. Middle East and Africa
Capacitive Sensors Industry REPORT HIGHLIGHTS
| Aspects | Details |
|---|---|
| Study Period | 2019-2033 |
| Base Year | 2024 |
| Estimated Year | 2025 |
| Forecast Period | 2025-2033 |
| Historical Period | 2019-2024 |
| Growth Rate | CAGR of 4.92% from 2019-2033 |
| Segmentation |
|
Table of Contents
- 1. Introduction
- 1.1. Research Scope
- 1.2. Market Segmentation
- 1.3. Research Methodology
- 1.4. Definitions and Assumptions
- 2. Executive Summary
- 2.1. Introduction
- 3. Market Dynamics
- 3.1. Introduction
- 3.2. Market Drivers
- 3.2.1. Increasing Implementation of Touch Screen Displays as Human Machine Interaction Systems; Rising Usage of Scratch-resistant Non-glass Surfaces
- 3.3. Market Restrains
- 3.3.1. Supply Shortage of Indium Tin Oxide
- 3.4. Market Trends
- 3.4.1. The Automotive End-user Industry is Expected to Hold Significant Market Share
- 4. Market Factor Analysis
- 4.1. Porters Five Forces
- 4.2. Supply/Value Chain
- 4.3. PESTEL analysis
- 4.4. Market Entropy
- 4.5. Patent/Trademark Analysis
- 5. Global Capacitive Sensors Industry Analysis, Insights and Forecast, 2019-2031
- 5.1. Market Analysis, Insights and Forecast - by Type
- 5.1.1. Touch Sensor
- 5.1.2. Motion Sensor
- 5.1.3. Position Sensor
- 5.1.4. Other Types
- 5.2. Market Analysis, Insights and Forecast - by End-user Industry
- 5.2.1. Consumer Electronics
- 5.2.2. Automotive
- 5.2.3. Aerospace and Defense
- 5.2.4. Healthcare
- 5.2.5. Food and Beverages
- 5.2.6. Oil and Gas
- 5.2.7. Other End-user Industries
- 5.3. Market Analysis, Insights and Forecast - by Region
- 5.3.1. North America
- 5.3.2. Europe
- 5.3.3. Asia
- 5.3.4. Latin America
- 5.3.5. Middle East and Africa
- 5.1. Market Analysis, Insights and Forecast - by Type
- 6. North America Capacitive Sensors Industry Analysis, Insights and Forecast, 2019-2031
- 6.1. Market Analysis, Insights and Forecast - by Type
- 6.1.1. Touch Sensor
- 6.1.2. Motion Sensor
- 6.1.3. Position Sensor
- 6.1.4. Other Types
- 6.2. Market Analysis, Insights and Forecast - by End-user Industry
- 6.2.1. Consumer Electronics
- 6.2.2. Automotive
- 6.2.3. Aerospace and Defense
- 6.2.4. Healthcare
- 6.2.5. Food and Beverages
- 6.2.6. Oil and Gas
- 6.2.7. Other End-user Industries
- 6.1. Market Analysis, Insights and Forecast - by Type
- 7. Europe Capacitive Sensors Industry Analysis, Insights and Forecast, 2019-2031
- 7.1. Market Analysis, Insights and Forecast - by Type
- 7.1.1. Touch Sensor
- 7.1.2. Motion Sensor
- 7.1.3. Position Sensor
- 7.1.4. Other Types
- 7.2. Market Analysis, Insights and Forecast - by End-user Industry
- 7.2.1. Consumer Electronics
- 7.2.2. Automotive
- 7.2.3. Aerospace and Defense
- 7.2.4. Healthcare
- 7.2.5. Food and Beverages
- 7.2.6. Oil and Gas
- 7.2.7. Other End-user Industries
- 7.1. Market Analysis, Insights and Forecast - by Type
- 8. Asia Capacitive Sensors Industry Analysis, Insights and Forecast, 2019-2031
- 8.1. Market Analysis, Insights and Forecast - by Type
- 8.1.1. Touch Sensor
- 8.1.2. Motion Sensor
- 8.1.3. Position Sensor
- 8.1.4. Other Types
- 8.2. Market Analysis, Insights and Forecast - by End-user Industry
- 8.2.1. Consumer Electronics
- 8.2.2. Automotive
- 8.2.3. Aerospace and Defense
- 8.2.4. Healthcare
- 8.2.5. Food and Beverages
- 8.2.6. Oil and Gas
- 8.2.7. Other End-user Industries
- 8.1. Market Analysis, Insights and Forecast - by Type
- 9. Latin America Capacitive Sensors Industry Analysis, Insights and Forecast, 2019-2031
- 9.1. Market Analysis, Insights and Forecast - by Type
- 9.1.1. Touch Sensor
- 9.1.2. Motion Sensor
- 9.1.3. Position Sensor
- 9.1.4. Other Types
- 9.2. Market Analysis, Insights and Forecast - by End-user Industry
- 9.2.1. Consumer Electronics
- 9.2.2. Automotive
- 9.2.3. Aerospace and Defense
- 9.2.4. Healthcare
- 9.2.5. Food and Beverages
- 9.2.6. Oil and Gas
- 9.2.7. Other End-user Industries
- 9.1. Market Analysis, Insights and Forecast - by Type
- 10. Middle East and Africa Capacitive Sensors Industry Analysis, Insights and Forecast, 2019-2031
- 10.1. Market Analysis, Insights and Forecast - by Type
- 10.1.1. Touch Sensor
- 10.1.2. Motion Sensor
- 10.1.3. Position Sensor
- 10.1.4. Other Types
- 10.2. Market Analysis, Insights and Forecast - by End-user Industry
- 10.2.1. Consumer Electronics
- 10.2.2. Automotive
- 10.2.3. Aerospace and Defense
- 10.2.4. Healthcare
- 10.2.5. Food and Beverages
- 10.2.6. Oil and Gas
- 10.2.7. Other End-user Industries
- 10.1. Market Analysis, Insights and Forecast - by Type
- 11. North America Capacitive Sensors Industry Analysis, Insights and Forecast, 2019-2031
- 11.1. Market Analysis, Insights and Forecast - By Country/Sub-region
- 11.1.1 United States
- 11.1.2 Canada
- 11.1.3 Mexico
- 12. Europe Capacitive Sensors Industry Analysis, Insights and Forecast, 2019-2031
- 12.1. Market Analysis, Insights and Forecast - By Country/Sub-region
- 12.1.1 Germany
- 12.1.2 United Kingdom
- 12.1.3 France
- 12.1.4 Spain
- 12.1.5 Italy
- 12.1.6 Spain
- 12.1.7 Belgium
- 12.1.8 Netherland
- 12.1.9 Nordics
- 12.1.10 Rest of Europe
- 13. Asia Pacific Capacitive Sensors Industry Analysis, Insights and Forecast, 2019-2031
- 13.1. Market Analysis, Insights and Forecast - By Country/Sub-region
- 13.1.1 China
- 13.1.2 Japan
- 13.1.3 India
- 13.1.4 South Korea
- 13.1.5 Southeast Asia
- 13.1.6 Australia
- 13.1.7 Indonesia
- 13.1.8 Phillipes
- 13.1.9 Singapore
- 13.1.10 Thailandc
- 13.1.11 Rest of Asia Pacific
- 14. South America Capacitive Sensors Industry Analysis, Insights and Forecast, 2019-2031
- 14.1. Market Analysis, Insights and Forecast - By Country/Sub-region
- 14.1.1 Brazil
- 14.1.2 Argentina
- 14.1.3 Peru
- 14.1.4 Chile
- 14.1.5 Colombia
- 14.1.6 Ecuador
- 14.1.7 Venezuela
- 14.1.8 Rest of South America
- 15. North America Capacitive Sensors Industry Analysis, Insights and Forecast, 2019-2031
- 15.1. Market Analysis, Insights and Forecast - By Country/Sub-region
- 15.1.1 United States
- 15.1.2 Canada
- 15.1.3 Mexico
- 16. MEA Capacitive Sensors Industry Analysis, Insights and Forecast, 2019-2031
- 16.1. Market Analysis, Insights and Forecast - By Country/Sub-region
- 16.1.1 United Arab Emirates
- 16.1.2 Saudi Arabia
- 16.1.3 South Africa
- 16.1.4 Rest of Middle East and Africa
- 17. Competitive Analysis
- 17.1. Global Market Share Analysis 2024
- 17.2. Company Profiles
- 17.2.1 Infineon Technologies AG
- 17.2.1.1. Overview
- 17.2.1.2. Products
- 17.2.1.3. SWOT Analysis
- 17.2.1.4. Recent Developments
- 17.2.1.5. Financials (Based on Availability)
- 17.2.2 Microchip Technology Inc
- 17.2.2.1. Overview
- 17.2.2.2. Products
- 17.2.2.3. SWOT Analysis
- 17.2.2.4. Recent Developments
- 17.2.2.5. Financials (Based on Availability)
- 17.2.3 NXP Semiconductors NV
- 17.2.3.1. Overview
- 17.2.3.2. Products
- 17.2.3.3. SWOT Analysis
- 17.2.3.4. Recent Developments
- 17.2.3.5. Financials (Based on Availability)
- 17.2.4 Texas Instruments Inc
- 17.2.4.1. Overview
- 17.2.4.2. Products
- 17.2.4.3. SWOT Analysis
- 17.2.4.4. Recent Developments
- 17.2.4.5. Financials (Based on Availability)
- 17.2.5 Siemens AG
- 17.2.5.1. Overview
- 17.2.5.2. Products
- 17.2.5.3. SWOT Analysis
- 17.2.5.4. Recent Developments
- 17.2.5.5. Financials (Based on Availability)
- 17.2.6 3M Company
- 17.2.6.1. Overview
- 17.2.6.2. Products
- 17.2.6.3. SWOT Analysis
- 17.2.6.4. Recent Developments
- 17.2.6.5. Financials (Based on Availability)
- 17.2.7 Omron Corporation
- 17.2.7.1. Overview
- 17.2.7.2. Products
- 17.2.7.3. SWOT Analysis
- 17.2.7.4. Recent Developments
- 17.2.7.5. Financials (Based on Availability)
- 17.2.8 STMicroelectronics NV
- 17.2.8.1. Overview
- 17.2.8.2. Products
- 17.2.8.3. SWOT Analysis
- 17.2.8.4. Recent Developments
- 17.2.8.5. Financials (Based on Availability)
- 17.2.9 Fujitsu Limited
- 17.2.9.1. Overview
- 17.2.9.2. Products
- 17.2.9.3. SWOT Analysis
- 17.2.9.4. Recent Developments
- 17.2.9.5. Financials (Based on Availability)
- 17.2.10 Sony Corporation
- 17.2.10.1. Overview
- 17.2.10.2. Products
- 17.2.10.3. SWOT Analysis
- 17.2.10.4. Recent Developments
- 17.2.10.5. Financials (Based on Availability)
- 17.2.11 TDK Corporation
- 17.2.11.1. Overview
- 17.2.11.2. Products
- 17.2.11.3. SWOT Analysis
- 17.2.11.4. Recent Developments
- 17.2.11.5. Financials (Based on Availability)
- 17.2.12 Analog Devices Inc
- 17.2.12.1. Overview
- 17.2.12.2. Products
- 17.2.12.3. SWOT Analysis
- 17.2.12.4. Recent Developments
- 17.2.12.5. Financials (Based on Availability)
- 17.2.1 Infineon Technologies AG
List of Figures
- Figure 1: Global Capacitive Sensors Industry Revenue Breakdown (Million, %) by Region 2024 & 2032
- Figure 2: Global Capacitive Sensors Industry Volume Breakdown (K Unit, %) by Region 2024 & 2032
- Figure 3: North America Capacitive Sensors Industry Revenue (Million), by Country 2024 & 2032
- Figure 4: North America Capacitive Sensors Industry Volume (K Unit), by Country 2024 & 2032
- Figure 5: North America Capacitive Sensors Industry Revenue Share (%), by Country 2024 & 2032
- Figure 6: North America Capacitive Sensors Industry Volume Share (%), by Country 2024 & 2032
- Figure 7: Europe Capacitive Sensors Industry Revenue (Million), by Country 2024 & 2032
- Figure 8: Europe Capacitive Sensors Industry Volume (K Unit), by Country 2024 & 2032
- Figure 9: Europe Capacitive Sensors Industry Revenue Share (%), by Country 2024 & 2032
- Figure 10: Europe Capacitive Sensors Industry Volume Share (%), by Country 2024 & 2032
- Figure 11: Asia Pacific Capacitive Sensors Industry Revenue (Million), by Country 2024 & 2032
- Figure 12: Asia Pacific Capacitive Sensors Industry Volume (K Unit), by Country 2024 & 2032
- Figure 13: Asia Pacific Capacitive Sensors Industry Revenue Share (%), by Country 2024 & 2032
- Figure 14: Asia Pacific Capacitive Sensors Industry Volume Share (%), by Country 2024 & 2032
- Figure 15: South America Capacitive Sensors Industry Revenue (Million), by Country 2024 & 2032
- Figure 16: South America Capacitive Sensors Industry Volume (K Unit), by Country 2024 & 2032
- Figure 17: South America Capacitive Sensors Industry Revenue Share (%), by Country 2024 & 2032
- Figure 18: South America Capacitive Sensors Industry Volume Share (%), by Country 2024 & 2032
- Figure 19: North America Capacitive Sensors Industry Revenue (Million), by Country 2024 & 2032
- Figure 20: North America Capacitive Sensors Industry Volume (K Unit), by Country 2024 & 2032
- Figure 21: North America Capacitive Sensors Industry Revenue Share (%), by Country 2024 & 2032
- Figure 22: North America Capacitive Sensors Industry Volume Share (%), by Country 2024 & 2032
- Figure 23: MEA Capacitive Sensors Industry Revenue (Million), by Country 2024 & 2032
- Figure 24: MEA Capacitive Sensors Industry Volume (K Unit), by Country 2024 & 2032
- Figure 25: MEA Capacitive Sensors Industry Revenue Share (%), by Country 2024 & 2032
- Figure 26: MEA Capacitive Sensors Industry Volume Share (%), by Country 2024 & 2032
- Figure 27: North America Capacitive Sensors Industry Revenue (Million), by Type 2024 & 2032
- Figure 28: North America Capacitive Sensors Industry Volume (K Unit), by Type 2024 & 2032
- Figure 29: North America Capacitive Sensors Industry Revenue Share (%), by Type 2024 & 2032
- Figure 30: North America Capacitive Sensors Industry Volume Share (%), by Type 2024 & 2032
- Figure 31: North America Capacitive Sensors Industry Revenue (Million), by End-user Industry 2024 & 2032
- Figure 32: North America Capacitive Sensors Industry Volume (K Unit), by End-user Industry 2024 & 2032
- Figure 33: North America Capacitive Sensors Industry Revenue Share (%), by End-user Industry 2024 & 2032
- Figure 34: North America Capacitive Sensors Industry Volume Share (%), by End-user Industry 2024 & 2032
- Figure 35: North America Capacitive Sensors Industry Revenue (Million), by Country 2024 & 2032
- Figure 36: North America Capacitive Sensors Industry Volume (K Unit), by Country 2024 & 2032
- Figure 37: North America Capacitive Sensors Industry Revenue Share (%), by Country 2024 & 2032
- Figure 38: North America Capacitive Sensors Industry Volume Share (%), by Country 2024 & 2032
- Figure 39: Europe Capacitive Sensors Industry Revenue (Million), by Type 2024 & 2032
- Figure 40: Europe Capacitive Sensors Industry Volume (K Unit), by Type 2024 & 2032
- Figure 41: Europe Capacitive Sensors Industry Revenue Share (%), by Type 2024 & 2032
- Figure 42: Europe Capacitive Sensors Industry Volume Share (%), by Type 2024 & 2032
- Figure 43: Europe Capacitive Sensors Industry Revenue (Million), by End-user Industry 2024 & 2032
- Figure 44: Europe Capacitive Sensors Industry Volume (K Unit), by End-user Industry 2024 & 2032
- Figure 45: Europe Capacitive Sensors Industry Revenue Share (%), by End-user Industry 2024 & 2032
- Figure 46: Europe Capacitive Sensors Industry Volume Share (%), by End-user Industry 2024 & 2032
- Figure 47: Europe Capacitive Sensors Industry Revenue (Million), by Country 2024 & 2032
- Figure 48: Europe Capacitive Sensors Industry Volume (K Unit), by Country 2024 & 2032
- Figure 49: Europe Capacitive Sensors Industry Revenue Share (%), by Country 2024 & 2032
- Figure 50: Europe Capacitive Sensors Industry Volume Share (%), by Country 2024 & 2032
- Figure 51: Asia Capacitive Sensors Industry Revenue (Million), by Type 2024 & 2032
- Figure 52: Asia Capacitive Sensors Industry Volume (K Unit), by Type 2024 & 2032
- Figure 53: Asia Capacitive Sensors Industry Revenue Share (%), by Type 2024 & 2032
- Figure 54: Asia Capacitive Sensors Industry Volume Share (%), by Type 2024 & 2032
- Figure 55: Asia Capacitive Sensors Industry Revenue (Million), by End-user Industry 2024 & 2032
- Figure 56: Asia Capacitive Sensors Industry Volume (K Unit), by End-user Industry 2024 & 2032
- Figure 57: Asia Capacitive Sensors Industry Revenue Share (%), by End-user Industry 2024 & 2032
- Figure 58: Asia Capacitive Sensors Industry Volume Share (%), by End-user Industry 2024 & 2032
- Figure 59: Asia Capacitive Sensors Industry Revenue (Million), by Country 2024 & 2032
- Figure 60: Asia Capacitive Sensors Industry Volume (K Unit), by Country 2024 & 2032
- Figure 61: Asia Capacitive Sensors Industry Revenue Share (%), by Country 2024 & 2032
- Figure 62: Asia Capacitive Sensors Industry Volume Share (%), by Country 2024 & 2032
- Figure 63: Latin America Capacitive Sensors Industry Revenue (Million), by Type 2024 & 2032
- Figure 64: Latin America Capacitive Sensors Industry Volume (K Unit), by Type 2024 & 2032
- Figure 65: Latin America Capacitive Sensors Industry Revenue Share (%), by Type 2024 & 2032
- Figure 66: Latin America Capacitive Sensors Industry Volume Share (%), by Type 2024 & 2032
- Figure 67: Latin America Capacitive Sensors Industry Revenue (Million), by End-user Industry 2024 & 2032
- Figure 68: Latin America Capacitive Sensors Industry Volume (K Unit), by End-user Industry 2024 & 2032
- Figure 69: Latin America Capacitive Sensors Industry Revenue Share (%), by End-user Industry 2024 & 2032
- Figure 70: Latin America Capacitive Sensors Industry Volume Share (%), by End-user Industry 2024 & 2032
- Figure 71: Latin America Capacitive Sensors Industry Revenue (Million), by Country 2024 & 2032
- Figure 72: Latin America Capacitive Sensors Industry Volume (K Unit), by Country 2024 & 2032
- Figure 73: Latin America Capacitive Sensors Industry Revenue Share (%), by Country 2024 & 2032
- Figure 74: Latin America Capacitive Sensors Industry Volume Share (%), by Country 2024 & 2032
- Figure 75: Middle East and Africa Capacitive Sensors Industry Revenue (Million), by Type 2024 & 2032
- Figure 76: Middle East and Africa Capacitive Sensors Industry Volume (K Unit), by Type 2024 & 2032
- Figure 77: Middle East and Africa Capacitive Sensors Industry Revenue Share (%), by Type 2024 & 2032
- Figure 78: Middle East and Africa Capacitive Sensors Industry Volume Share (%), by Type 2024 & 2032
- Figure 79: Middle East and Africa Capacitive Sensors Industry Revenue (Million), by End-user Industry 2024 & 2032
- Figure 80: Middle East and Africa Capacitive Sensors Industry Volume (K Unit), by End-user Industry 2024 & 2032
- Figure 81: Middle East and Africa Capacitive Sensors Industry Revenue Share (%), by End-user Industry 2024 & 2032
- Figure 82: Middle East and Africa Capacitive Sensors Industry Volume Share (%), by End-user Industry 2024 & 2032
- Figure 83: Middle East and Africa Capacitive Sensors Industry Revenue (Million), by Country 2024 & 2032
- Figure 84: Middle East and Africa Capacitive Sensors Industry Volume (K Unit), by Country 2024 & 2032
- Figure 85: Middle East and Africa Capacitive Sensors Industry Revenue Share (%), by Country 2024 & 2032
- Figure 86: Middle East and Africa Capacitive Sensors Industry Volume Share (%), by Country 2024 & 2032
List of Tables
- Table 1: Global Capacitive Sensors Industry Revenue Million Forecast, by Region 2019 & 2032
- Table 2: Global Capacitive Sensors Industry Volume K Unit Forecast, by Region 2019 & 2032
- Table 3: Global Capacitive Sensors Industry Revenue Million Forecast, by Type 2019 & 2032
- Table 4: Global Capacitive Sensors Industry Volume K Unit Forecast, by Type 2019 & 2032
- Table 5: Global Capacitive Sensors Industry Revenue Million Forecast, by End-user Industry 2019 & 2032
- Table 6: Global Capacitive Sensors Industry Volume K Unit Forecast, by End-user Industry 2019 & 2032
- Table 7: Global Capacitive Sensors Industry Revenue Million Forecast, by Region 2019 & 2032
- Table 8: Global Capacitive Sensors Industry Volume K Unit Forecast, by Region 2019 & 2032
- Table 9: Global Capacitive Sensors Industry Revenue Million Forecast, by Country 2019 & 2032
- Table 10: Global Capacitive Sensors Industry Volume K Unit Forecast, by Country 2019 & 2032
- Table 11: United States Capacitive Sensors Industry Revenue (Million) Forecast, by Application 2019 & 2032
- Table 12: United States Capacitive Sensors Industry Volume (K Unit) Forecast, by Application 2019 & 2032
- Table 13: Canada Capacitive Sensors Industry Revenue (Million) Forecast, by Application 2019 & 2032
- Table 14: Canada Capacitive Sensors Industry Volume (K Unit) Forecast, by Application 2019 & 2032
- Table 15: Mexico Capacitive Sensors Industry Revenue (Million) Forecast, by Application 2019 & 2032
- Table 16: Mexico Capacitive Sensors Industry Volume (K Unit) Forecast, by Application 2019 & 2032
- Table 17: Global Capacitive Sensors Industry Revenue Million Forecast, by Country 2019 & 2032
- Table 18: Global Capacitive Sensors Industry Volume K Unit Forecast, by Country 2019 & 2032
- Table 19: Germany Capacitive Sensors Industry Revenue (Million) Forecast, by Application 2019 & 2032
- Table 20: Germany Capacitive Sensors Industry Volume (K Unit) Forecast, by Application 2019 & 2032
- Table 21: United Kingdom Capacitive Sensors Industry Revenue (Million) Forecast, by Application 2019 & 2032
- Table 22: United Kingdom Capacitive Sensors Industry Volume (K Unit) Forecast, by Application 2019 & 2032
- Table 23: France Capacitive Sensors Industry Revenue (Million) Forecast, by Application 2019 & 2032
- Table 24: France Capacitive Sensors Industry Volume (K Unit) Forecast, by Application 2019 & 2032
- Table 25: Spain Capacitive Sensors Industry Revenue (Million) Forecast, by Application 2019 & 2032
- Table 26: Spain Capacitive Sensors Industry Volume (K Unit) Forecast, by Application 2019 & 2032
- Table 27: Italy Capacitive Sensors Industry Revenue (Million) Forecast, by Application 2019 & 2032
- Table 28: Italy Capacitive Sensors Industry Volume (K Unit) Forecast, by Application 2019 & 2032
- Table 29: Spain Capacitive Sensors Industry Revenue (Million) Forecast, by Application 2019 & 2032
- Table 30: Spain Capacitive Sensors Industry Volume (K Unit) Forecast, by Application 2019 & 2032
- Table 31: Belgium Capacitive Sensors Industry Revenue (Million) Forecast, by Application 2019 & 2032
- Table 32: Belgium Capacitive Sensors Industry Volume (K Unit) Forecast, by Application 2019 & 2032
- Table 33: Netherland Capacitive Sensors Industry Revenue (Million) Forecast, by Application 2019 & 2032
- Table 34: Netherland Capacitive Sensors Industry Volume (K Unit) Forecast, by Application 2019 & 2032
- Table 35: Nordics Capacitive Sensors Industry Revenue (Million) Forecast, by Application 2019 & 2032
- Table 36: Nordics Capacitive Sensors Industry Volume (K Unit) Forecast, by Application 2019 & 2032
- Table 37: Rest of Europe Capacitive Sensors Industry Revenue (Million) Forecast, by Application 2019 & 2032
- Table 38: Rest of Europe Capacitive Sensors Industry Volume (K Unit) Forecast, by Application 2019 & 2032
- Table 39: Global Capacitive Sensors Industry Revenue Million Forecast, by Country 2019 & 2032
- Table 40: Global Capacitive Sensors Industry Volume K Unit Forecast, by Country 2019 & 2032
- Table 41: China Capacitive Sensors Industry Revenue (Million) Forecast, by Application 2019 & 2032
- Table 42: China Capacitive Sensors Industry Volume (K Unit) Forecast, by Application 2019 & 2032
- Table 43: Japan Capacitive Sensors Industry Revenue (Million) Forecast, by Application 2019 & 2032
- Table 44: Japan Capacitive Sensors Industry Volume (K Unit) Forecast, by Application 2019 & 2032
- Table 45: India Capacitive Sensors Industry Revenue (Million) Forecast, by Application 2019 & 2032
- Table 46: India Capacitive Sensors Industry Volume (K Unit) Forecast, by Application 2019 & 2032
- Table 47: South Korea Capacitive Sensors Industry Revenue (Million) Forecast, by Application 2019 & 2032
- Table 48: South Korea Capacitive Sensors Industry Volume (K Unit) Forecast, by Application 2019 & 2032
- Table 49: Southeast Asia Capacitive Sensors Industry Revenue (Million) Forecast, by Application 2019 & 2032
- Table 50: Southeast Asia Capacitive Sensors Industry Volume (K Unit) Forecast, by Application 2019 & 2032
- Table 51: Australia Capacitive Sensors Industry Revenue (Million) Forecast, by Application 2019 & 2032
- Table 52: Australia Capacitive Sensors Industry Volume (K Unit) Forecast, by Application 2019 & 2032
- Table 53: Indonesia Capacitive Sensors Industry Revenue (Million) Forecast, by Application 2019 & 2032
- Table 54: Indonesia Capacitive Sensors Industry Volume (K Unit) Forecast, by Application 2019 & 2032
- Table 55: Phillipes Capacitive Sensors Industry Revenue (Million) Forecast, by Application 2019 & 2032
- Table 56: Phillipes Capacitive Sensors Industry Volume (K Unit) Forecast, by Application 2019 & 2032
- Table 57: Singapore Capacitive Sensors Industry Revenue (Million) Forecast, by Application 2019 & 2032
- Table 58: Singapore Capacitive Sensors Industry Volume (K Unit) Forecast, by Application 2019 & 2032
- Table 59: Thailandc Capacitive Sensors Industry Revenue (Million) Forecast, by Application 2019 & 2032
- Table 60: Thailandc Capacitive Sensors Industry Volume (K Unit) Forecast, by Application 2019 & 2032
- Table 61: Rest of Asia Pacific Capacitive Sensors Industry Revenue (Million) Forecast, by Application 2019 & 2032
- Table 62: Rest of Asia Pacific Capacitive Sensors Industry Volume (K Unit) Forecast, by Application 2019 & 2032
- Table 63: Global Capacitive Sensors Industry Revenue Million Forecast, by Country 2019 & 2032
- Table 64: Global Capacitive Sensors Industry Volume K Unit Forecast, by Country 2019 & 2032
- Table 65: Brazil Capacitive Sensors Industry Revenue (Million) Forecast, by Application 2019 & 2032
- Table 66: Brazil Capacitive Sensors Industry Volume (K Unit) Forecast, by Application 2019 & 2032
- Table 67: Argentina Capacitive Sensors Industry Revenue (Million) Forecast, by Application 2019 & 2032
- Table 68: Argentina Capacitive Sensors Industry Volume (K Unit) Forecast, by Application 2019 & 2032
- Table 69: Peru Capacitive Sensors Industry Revenue (Million) Forecast, by Application 2019 & 2032
- Table 70: Peru Capacitive Sensors Industry Volume (K Unit) Forecast, by Application 2019 & 2032
- Table 71: Chile Capacitive Sensors Industry Revenue (Million) Forecast, by Application 2019 & 2032
- Table 72: Chile Capacitive Sensors Industry Volume (K Unit) Forecast, by Application 2019 & 2032
- Table 73: Colombia Capacitive Sensors Industry Revenue (Million) Forecast, by Application 2019 & 2032
- Table 74: Colombia Capacitive Sensors Industry Volume (K Unit) Forecast, by Application 2019 & 2032
- Table 75: Ecuador Capacitive Sensors Industry Revenue (Million) Forecast, by Application 2019 & 2032
- Table 76: Ecuador Capacitive Sensors Industry Volume (K Unit) Forecast, by Application 2019 & 2032
- Table 77: Venezuela Capacitive Sensors Industry Revenue (Million) Forecast, by Application 2019 & 2032
- Table 78: Venezuela Capacitive Sensors Industry Volume (K Unit) Forecast, by Application 2019 & 2032
- Table 79: Rest of South America Capacitive Sensors Industry Revenue (Million) Forecast, by Application 2019 & 2032
- Table 80: Rest of South America Capacitive Sensors Industry Volume (K Unit) Forecast, by Application 2019 & 2032
- Table 81: Global Capacitive Sensors Industry Revenue Million Forecast, by Country 2019 & 2032
- Table 82: Global Capacitive Sensors Industry Volume K Unit Forecast, by Country 2019 & 2032
- Table 83: United States Capacitive Sensors Industry Revenue (Million) Forecast, by Application 2019 & 2032
- Table 84: United States Capacitive Sensors Industry Volume (K Unit) Forecast, by Application 2019 & 2032
- Table 85: Canada Capacitive Sensors Industry Revenue (Million) Forecast, by Application 2019 & 2032
- Table 86: Canada Capacitive Sensors Industry Volume (K Unit) Forecast, by Application 2019 & 2032
- Table 87: Mexico Capacitive Sensors Industry Revenue (Million) Forecast, by Application 2019 & 2032
- Table 88: Mexico Capacitive Sensors Industry Volume (K Unit) Forecast, by Application 2019 & 2032
- Table 89: Global Capacitive Sensors Industry Revenue Million Forecast, by Country 2019 & 2032
- Table 90: Global Capacitive Sensors Industry Volume K Unit Forecast, by Country 2019 & 2032
- Table 91: United Arab Emirates Capacitive Sensors Industry Revenue (Million) Forecast, by Application 2019 & 2032
- Table 92: United Arab Emirates Capacitive Sensors Industry Volume (K Unit) Forecast, by Application 2019 & 2032
- Table 93: Saudi Arabia Capacitive Sensors Industry Revenue (Million) Forecast, by Application 2019 & 2032
- Table 94: Saudi Arabia Capacitive Sensors Industry Volume (K Unit) Forecast, by Application 2019 & 2032
- Table 95: South Africa Capacitive Sensors Industry Revenue (Million) Forecast, by Application 2019 & 2032
- Table 96: South Africa Capacitive Sensors Industry Volume (K Unit) Forecast, by Application 2019 & 2032
- Table 97: Rest of Middle East and Africa Capacitive Sensors Industry Revenue (Million) Forecast, by Application 2019 & 2032
- Table 98: Rest of Middle East and Africa Capacitive Sensors Industry Volume (K Unit) Forecast, by Application 2019 & 2032
- Table 99: Global Capacitive Sensors Industry Revenue Million Forecast, by Type 2019 & 2032
- Table 100: Global Capacitive Sensors Industry Volume K Unit Forecast, by Type 2019 & 2032
- Table 101: Global Capacitive Sensors Industry Revenue Million Forecast, by End-user Industry 2019 & 2032
- Table 102: Global Capacitive Sensors Industry Volume K Unit Forecast, by End-user Industry 2019 & 2032
- Table 103: Global Capacitive Sensors Industry Revenue Million Forecast, by Country 2019 & 2032
- Table 104: Global Capacitive Sensors Industry Volume K Unit Forecast, by Country 2019 & 2032
- Table 105: United States Capacitive Sensors Industry Revenue (Million) Forecast, by Application 2019 & 2032
- Table 106: United States Capacitive Sensors Industry Volume (K Unit) Forecast, by Application 2019 & 2032
- Table 107: Canada Capacitive Sensors Industry Revenue (Million) Forecast, by Application 2019 & 2032
- Table 108: Canada Capacitive Sensors Industry Volume (K Unit) Forecast, by Application 2019 & 2032
- Table 109: Global Capacitive Sensors Industry Revenue Million Forecast, by Type 2019 & 2032
- Table 110: Global Capacitive Sensors Industry Volume K Unit Forecast, by Type 2019 & 2032
- Table 111: Global Capacitive Sensors Industry Revenue Million Forecast, by End-user Industry 2019 & 2032
- Table 112: Global Capacitive Sensors Industry Volume K Unit Forecast, by End-user Industry 2019 & 2032
- Table 113: Global Capacitive Sensors Industry Revenue Million Forecast, by Country 2019 & 2032
- Table 114: Global Capacitive Sensors Industry Volume K Unit Forecast, by Country 2019 & 2032
- Table 115: United Kingdom Capacitive Sensors Industry Revenue (Million) Forecast, by Application 2019 & 2032
- Table 116: United Kingdom Capacitive Sensors Industry Volume (K Unit) Forecast, by Application 2019 & 2032
- Table 117: Germany Capacitive Sensors Industry Revenue (Million) Forecast, by Application 2019 & 2032
- Table 118: Germany Capacitive Sensors Industry Volume (K Unit) Forecast, by Application 2019 & 2032
- Table 119: France Capacitive Sensors Industry Revenue (Million) Forecast, by Application 2019 & 2032
- Table 120: France Capacitive Sensors Industry Volume (K Unit) Forecast, by Application 2019 & 2032
- Table 121: Italy Capacitive Sensors Industry Revenue (Million) Forecast, by Application 2019 & 2032
- Table 122: Italy Capacitive Sensors Industry Volume (K Unit) Forecast, by Application 2019 & 2032
- Table 123: Global Capacitive Sensors Industry Revenue Million Forecast, by Type 2019 & 2032
- Table 124: Global Capacitive Sensors Industry Volume K Unit Forecast, by Type 2019 & 2032
- Table 125: Global Capacitive Sensors Industry Revenue Million Forecast, by End-user Industry 2019 & 2032
- Table 126: Global Capacitive Sensors Industry Volume K Unit Forecast, by End-user Industry 2019 & 2032
- Table 127: Global Capacitive Sensors Industry Revenue Million Forecast, by Country 2019 & 2032
- Table 128: Global Capacitive Sensors Industry Volume K Unit Forecast, by Country 2019 & 2032
- Table 129: China Capacitive Sensors Industry Revenue (Million) Forecast, by Application 2019 & 2032
- Table 130: China Capacitive Sensors Industry Volume (K Unit) Forecast, by Application 2019 & 2032
- Table 131: Japan Capacitive Sensors Industry Revenue (Million) Forecast, by Application 2019 & 2032
- Table 132: Japan Capacitive Sensors Industry Volume (K Unit) Forecast, by Application 2019 & 2032
- Table 133: India Capacitive Sensors Industry Revenue (Million) Forecast, by Application 2019 & 2032
- Table 134: India Capacitive Sensors Industry Volume (K Unit) Forecast, by Application 2019 & 2032
- Table 135: South Korea Capacitive Sensors Industry Revenue (Million) Forecast, by Application 2019 & 2032
- Table 136: South Korea Capacitive Sensors Industry Volume (K Unit) Forecast, by Application 2019 & 2032
- Table 137: Global Capacitive Sensors Industry Revenue Million Forecast, by Type 2019 & 2032
- Table 138: Global Capacitive Sensors Industry Volume K Unit Forecast, by Type 2019 & 2032
- Table 139: Global Capacitive Sensors Industry Revenue Million Forecast, by End-user Industry 2019 & 2032
- Table 140: Global Capacitive Sensors Industry Volume K Unit Forecast, by End-user Industry 2019 & 2032
- Table 141: Global Capacitive Sensors Industry Revenue Million Forecast, by Country 2019 & 2032
- Table 142: Global Capacitive Sensors Industry Volume K Unit Forecast, by Country 2019 & 2032
- Table 143: Mexico Capacitive Sensors Industry Revenue (Million) Forecast, by Application 2019 & 2032
- Table 144: Mexico Capacitive Sensors Industry Volume (K Unit) Forecast, by Application 2019 & 2032
- Table 145: Brazil Capacitive Sensors Industry Revenue (Million) Forecast, by Application 2019 & 2032
- Table 146: Brazil Capacitive Sensors Industry Volume (K Unit) Forecast, by Application 2019 & 2032
- Table 147: Global Capacitive Sensors Industry Revenue Million Forecast, by Type 2019 & 2032
- Table 148: Global Capacitive Sensors Industry Volume K Unit Forecast, by Type 2019 & 2032
- Table 149: Global Capacitive Sensors Industry Revenue Million Forecast, by End-user Industry 2019 & 2032
- Table 150: Global Capacitive Sensors Industry Volume K Unit Forecast, by End-user Industry 2019 & 2032
- Table 151: Global Capacitive Sensors Industry Revenue Million Forecast, by Country 2019 & 2032
- Table 152: Global Capacitive Sensors Industry Volume K Unit Forecast, by Country 2019 & 2032
Frequently Asked Questions
1. What is the projected Compound Annual Growth Rate (CAGR) of the Capacitive Sensors Industry?
The projected CAGR is approximately 4.92%.
2. Which companies are prominent players in the Capacitive Sensors Industry?
Key companies in the market include Infineon Technologies AG, Microchip Technology Inc, NXP Semiconductors NV, Texas Instruments Inc, Siemens AG, 3M Company, Omron Corporation, STMicroelectronics NV, Fujitsu Limited, Sony Corporation, TDK Corporation, Analog Devices Inc.
3. What are the main segments of the Capacitive Sensors Industry?
The market segments include Type, End-user Industry.
4. Can you provide details about the market size?
The market size is estimated to be USD 31.33 Million as of 2022.
5. What are some drivers contributing to market growth?
Increasing Implementation of Touch Screen Displays as Human Machine Interaction Systems; Rising Usage of Scratch-resistant Non-glass Surfaces.
6. What are the notable trends driving market growth?
The Automotive End-user Industry is Expected to Hold Significant Market Share.
7. Are there any restraints impacting market growth?
Supply Shortage of Indium Tin Oxide.
8. Can you provide examples of recent developments in the market?
February 2022 - The FPC1552 curved Fingerprint Cards AB's second-generation compact and curved capacitive touch sensor has been fitted into Xiaomi's recently unveiled Redmi K50. The fingerprint sensor is located on the phone's side and has a curved surface to ensure more seamless integration.
9. What pricing options are available for accessing the report?
Pricing options include single-user, multi-user, and enterprise licenses priced at USD 4750, USD 5250, and USD 8750 respectively.
10. Is the market size provided in terms of value or volume?
The market size is provided in terms of value, measured in Million and volume, measured in K Unit.
11. Are there any specific market keywords associated with the report?
Yes, the market keyword associated with the report is "Capacitive Sensors Industry," which aids in identifying and referencing the specific market segment covered.
12. How do I determine which pricing option suits my needs best?
The pricing options vary based on user requirements and access needs. Individual users may opt for single-user licenses, while businesses requiring broader access may choose multi-user or enterprise licenses for cost-effective access to the report.
13. Are there any additional resources or data provided in the Capacitive Sensors Industry report?
While the report offers comprehensive insights, it's advisable to review the specific contents or supplementary materials provided to ascertain if additional resources or data are available.
14. How can I stay updated on further developments or reports in the Capacitive Sensors Industry?
To stay informed about further developments, trends, and reports in the Capacitive Sensors Industry, consider subscribing to industry newsletters, following relevant companies and organizations, or regularly checking reputable industry news sources and publications.
Methodology
Step 1 - Identification of Relevant Samples Size from Population Database


Step 2 - Approaches for Defining Global Market Size (Value, Volume* & Price*)

Note*: In applicable scenarios
Step 3 - Data Sources
Primary Research
- Web Analytics
- Survey Reports
- Research Institute
- Latest Research Reports
- Opinion Leaders
Secondary Research
- Annual Reports
- White Paper
- Latest Press Release
- Industry Association
- Paid Database
- Investor Presentations

Step 4 - Data Triangulation
Involves using different sources of information in order to increase the validity of a study
These sources are likely to be stakeholders in a program - participants, other researchers, program staff, other community members, and so on.
Then we put all data in single framework & apply various statistical tools to find out the dynamic on the market.
During the analysis stage, feedback from the stakeholder groups would be compared to determine areas of agreement as well as areas of divergence


