

Key Insights
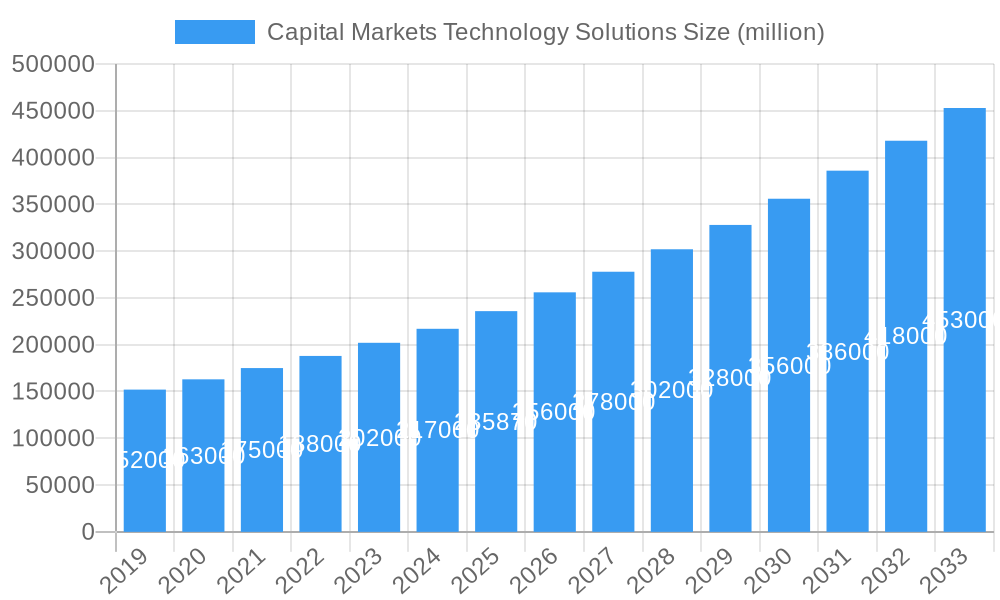
The global Capital Markets Technology Solutions market is poised for substantial growth, projected to reach USD 235,870 million by 2025 with a robust Compound Annual Growth Rate (CAGR) of 7.9% from 2019 to 2033. This expansion is fueled by several key drivers, including the increasing demand for advanced analytics, automation, and cloud-based solutions to enhance operational efficiency, risk management, and regulatory compliance within financial institutions. The industry is witnessing a significant trend towards digital transformation, with firms investing heavily in AI, machine learning, blockchain, and data analytics to gain a competitive edge, improve client experiences, and streamline complex trading and post-trade processes. The BFSI sector, in particular, is a dominant consumer of these solutions, leveraging technology to navigate evolving market dynamics and stringent regulatory landscapes. Furthermore, the growing adoption of Big Data and Artificial Intelligence is enabling sophisticated fraud detection and predictive modeling, further propelling market growth.
Capital Markets Technology Solutions Market Size (In Billion)
The market is segmented into Hardware, Software, and Services, with the Software and Services segments expected to experience the most significant growth owing to the increasing complexity of financial operations and the need for specialized expertise. Key applications span across BFSI, Government & Defense, Healthcare, IT & Telecom, and Retail & E-commerce, underscoring the pervasive influence of capital markets technology. While growth is robust, the market faces certain restraints, such as the high cost of implementation and integration of advanced technologies, cybersecurity concerns, and a shortage of skilled professionals. However, ongoing technological advancements, strategic collaborations among key players like Microsoft, Fenergo, Cognizant, Accenture, and Intel, and the continuous drive for innovation are expected to mitigate these challenges. Emerging economies, particularly in the Asia Pacific region, present significant untapped potential, driven by a burgeoning financial services sector and increasing digital adoption.
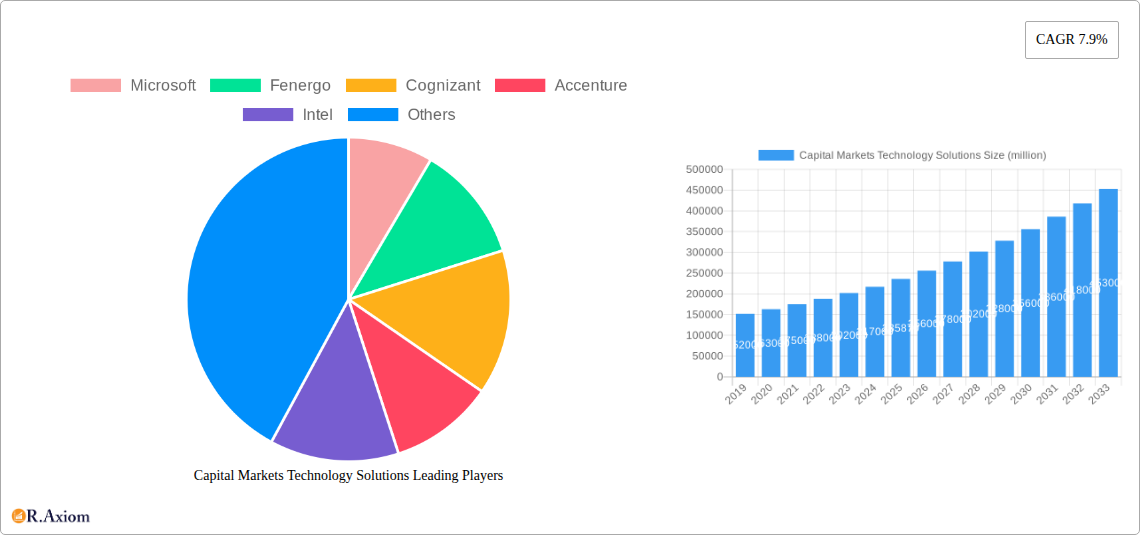
Capital Markets Technology Solutions Company Market Share
Capital Markets Technology Solutions Market Concentration & Innovation
The capital markets technology solutions landscape is characterized by a moderate to high level of market concentration, with a few dominant players holding significant market share. Innovation is a primary driver, fueled by the relentless pursuit of efficiency, security, and enhanced trading capabilities. Regulatory frameworks, such as MiFID II and GDPR, continue to shape technology adoption, compelling firms to invest in compliance-oriented solutions. Product substitutes, while present, are increasingly specialized, with cloud-native platforms and AI-powered analytics emerging as key differentiators rather than direct replacements for core trading and post-trade systems. End-user trends indicate a strong demand for digital transformation, real-time data processing, and advanced risk management tools across the BFSI sector. Mergers and acquisitions (M&A) remain a significant strategy for growth and consolidation. Notable M&A activities have seen deal values reaching hundreds of millions, facilitating the integration of specialized technologies and expanding market reach. Companies like Microsoft and Intel are instrumental in providing foundational hardware and software, while service providers like Accenture, Cognizant, and Infosys are crucial for implementation and custom solutions.
- Market Share Dynamics: Leading companies are estimated to hold a combined market share exceeding 60% of the total addressable market.
- M&A Deal Values: Recent M&A transactions in the past 24 months have averaged between $50 million and $200 million, demonstrating a robust appetite for strategic consolidation.
- Innovation Focus: Key areas of innovation include AI/ML for fraud detection and algorithmic trading, blockchain for settlement and clearing, and cloud computing for scalability and cost optimization.
Capital Markets Technology Solutions Industry Trends & Insights
The capital markets technology solutions market is experiencing robust growth, driven by a confluence of factors that are reshaping the financial services industry. The projected Compound Annual Growth Rate (CAGR) for the forecast period (2025–2033) is estimated to be around 12.5%, indicating a dynamic and expanding market. This growth is propelled by the increasing need for sophisticated trading platforms, risk management systems, and regulatory compliance solutions. Technological disruptions are at the forefront, with the rapid adoption of artificial intelligence (AI), machine learning (ML), and distributed ledger technology (DLT) fundamentally altering how capital markets operate. AI and ML are being leveraged for advanced analytics, predictive modeling, algorithmic trading, and personalized client services, leading to improved efficiency and decision-making. DLT, particularly blockchain, shows significant promise in revolutionizing areas like trade settlement, clearing, and asset tokenization, aiming to reduce costs, enhance transparency, and accelerate transaction times.
Consumer preferences are shifting towards digital-first experiences, demanding seamless, intuitive, and secure platforms. Investors, both retail and institutional, expect real-time access to market data, advanced trading tools, and personalized insights. This has led to a surge in demand for user-friendly interfaces, mobile trading applications, and robust customer support powered by AI-driven chatbots. Competitive dynamics are intensifying, with established technology providers and agile FinTech startups vying for market share. Companies are investing heavily in R&D to stay ahead of the curve, and strategic partnerships are becoming increasingly common to leverage complementary strengths. The BFSI segment, in particular, is a major adopter of these technologies, as it faces immense pressure to innovate and remain competitive in a rapidly evolving financial landscape. Market penetration for advanced analytics and cloud-based solutions within BFSI is expected to exceed 70% by 2028. Other segments, such as Government & Defense and Healthcare, are also showing increasing interest, driven by the need for secure data management and efficient financial operations. The integration of these technologies is no longer just about operational efficiency but also about creating new revenue streams and enhancing customer engagement. The industry is witnessing a significant trend towards data democratization, enabling wider access to market insights and facilitating more informed investment decisions. This data-driven approach is a cornerstone of modern capital markets operations.
Dominant Markets & Segments in Capital Markets Technology Solutions
The capital markets technology solutions market is experiencing significant dominance from specific regions and application segments, driven by economic policies, robust financial infrastructure, and a strong regulatory push for modernization.
Leading Region: North America
North America, particularly the United States, stands out as the dominant region. Its dominance is attributed to several key drivers:
- Advanced Financial Infrastructure: The presence of major stock exchanges (NYSE, Nasdaq), a high concentration of global investment banks, asset managers, and hedge funds provides a fertile ground for cutting-edge technology adoption.
- Innovation Hub: The region is a global hub for FinTech innovation, attracting significant venture capital funding and fostering a culture of rapid technological development.
- Regulatory Landscape: While stringent, the regulatory environment in North America has also driven significant investment in compliance technology, cybersecurity, and data analytics solutions.
- Economic Policies: Favorable economic policies and a deep pool of skilled talent further solidify its leading position.
Dominant Application Segment: BFSI
Within the application segments, the Banking, Financial Services, and Insurance (BFSI) sector overwhelmingly dominates the capital markets technology solutions market. This is driven by:
- Core Industry Demand: Capital markets are intrinsically linked to the BFSI sector, making it the primary consumer of technology solutions for trading, clearing, settlement, risk management, compliance, and customer relationship management.
- Digital Transformation Imperative: BFSI institutions are under immense pressure to digitally transform their operations to enhance efficiency, reduce costs, improve customer experience, and comply with evolving regulations.
- Investment in Advanced Technologies: BFSI firms are the largest investors in AI/ML for algorithmic trading and fraud detection, blockchain for streamlining post-trade processes, and cloud computing for scalability and agility.
- Data-Intensive Operations: The sheer volume of data generated and processed daily in capital markets necessitates sophisticated technology solutions for storage, analysis, and security.
Dominant Type Segment: Services
In terms of technology types, Services emerge as the dominant segment. This is due to the complex nature of capital markets operations and the need for specialized expertise.
- System Integration and Implementation: The integration of new technologies with legacy systems requires extensive implementation and customization services, often provided by specialized IT services firms.
- Consulting and Advisory Services: Regulatory compliance, digital transformation strategy, and cybersecurity require expert consulting and advisory services, a significant portion of which is delivered by global IT consultancies.
- Managed Services: Outsourcing IT operations and infrastructure management to specialized service providers allows financial institutions to focus on core competencies, driving the demand for managed services.
- Custom Software Development: While off-the-shelf solutions exist, many capital markets firms require bespoke software development to meet unique operational needs and competitive advantages.
The BFSI sector, driven by the need for advanced Services to implement and manage complex Software and Hardware solutions, forms the bedrock of this market. Companies like Microsoft (Software/Hardware) and Fenergo (Software/Services) play crucial roles, but the lion's share of market expenditure is on the expertise and ongoing support provided by service giants like Accenture, Cognizant, and Infosys. The interplay between these segments ensures continuous innovation and operational excellence within the capital markets.
Capital Markets Technology Solutions Product Developments
Product development in capital markets technology is intensely focused on enhancing speed, accuracy, and security. Innovations in AI/ML are powering predictive analytics for trading strategies and sophisticated fraud detection. Cloud-native architectures are enabling unprecedented scalability and flexibility for trading platforms and data management. Blockchain technology is being explored for faster, more transparent settlement and clearing processes. Competitive advantages are being carved out through the seamless integration of these technologies, offering real-time data insights, automated compliance, and robust cybersecurity measures.
Report Scope & Segmentation Analysis
This report provides a comprehensive analysis of the capital markets technology solutions market from 2019 to 2033. It segments the market by Application, Type, and region.
- Application Segments: The report details market dynamics for BFSI, Government & Defense, Healthcare, IT & Telecom, Retail & E-commerce, and Others. BFSI is expected to continue its dominance with a projected market size of over $50 billion by 2033.
- Type Segments: Analysis covers Hardware, Software, and Services. The Services segment is anticipated to lead growth, driven by the increasing complexity of implementations and ongoing support requirements, with projections exceeding $70 billion by 2033.
Key Drivers of Capital Markets Technology Solutions Growth
The growth of the capital markets technology solutions market is propelled by several interconnected factors:
- Digital Transformation Initiatives: Financial institutions are aggressively pursuing digital transformation to enhance operational efficiency, reduce costs, and improve customer experiences.
- Technological Advancements: The rapid evolution of AI/ML, blockchain, cloud computing, and big data analytics offers new capabilities for trading, risk management, and regulatory compliance.
- Stringent Regulatory Compliance: Evolving global regulations necessitate significant investment in technology solutions for reporting, surveillance, and data security.
- Demand for Real-time Data and Analytics: Investors and traders require instant access to market data and sophisticated analytical tools for informed decision-making.
Challenges in the Capital Markets Technology Solutions Sector
Despite robust growth, the capital markets technology solutions sector faces significant challenges:
- Legacy System Integration: Integrating new technologies with existing, often outdated, legacy systems can be complex, costly, and time-consuming.
- Cybersecurity Threats: The increasing sophistication of cyberattacks poses a constant threat to sensitive financial data and critical infrastructure.
- Regulatory Burden: Navigating a complex and ever-changing regulatory landscape requires continuous adaptation and significant investment in compliance solutions.
- Talent Shortage: A lack of skilled professionals in areas like AI, blockchain, and cybersecurity can hinder adoption and implementation.
Emerging Opportunities in Capital Markets Technology Solutions
Emerging opportunities in the capital markets technology solutions sector are ripe for innovation and expansion:
- AI-Powered Trading and Risk Management: Further development and adoption of AI for predictive analytics, algorithmic trading, and real-time risk assessment.
- Blockchain for Post-Trade Efficiency: Exploring and implementing blockchain for faster, more transparent, and cost-effective trade settlement and clearing.
- ESG Data and Analytics: Growing demand for technology solutions that support Environmental, Social, and Governance (ESG) investing by providing robust data aggregation and analysis capabilities.
- Democratization of Finance: Developing accessible and user-friendly platforms for retail investors and expanding the reach of sophisticated investment tools.
Leading Players in the Capital Markets Technology Solutions Market
Microsoft, Fenergo, Cognizant, Accenture, Intel, Tech Mahindra, Wipro, DXC Technology, Capgemini, Infosys, Mphasis, Zensar, Virtusa, EPAM, Birlasoft, NSEIT, Coforge, Apexon, SoftServe, Accolite Digital, Kyndryl, HCLTech, LTIMindtree, Nous Infosystems, Hitachi, Stefanini Group, Ness Digital Engineering, Xoriant, Exadel, OpenGamma,
Key Developments in Capital Markets Technology Solutions Industry
- 2023/05: Microsoft announces major expansion of its Azure cloud services for financial institutions, enhancing scalability and AI capabilities for capital markets.
- 2023/09: Fenergo launches new AI-driven client lifecycle management platform to streamline onboarding and regulatory compliance for financial firms.
- 2024/01: Accenture and Intel partner to accelerate the adoption of AI and edge computing in capital markets for real-time trading insights.
- 2024/03: Infosys introduces its next-generation digital trading platform leveraging cloud-native architecture and advanced analytics.
- 2024/06: OpenGamma releases a new risk management solution with enhanced real-time analytics for derivatives trading.
Strategic Outlook for Capital Markets Technology Solutions Market
The strategic outlook for the capital markets technology solutions market remains exceptionally positive. Continued investment in AI and blockchain will drive significant operational efficiencies and unlock new revenue streams. The ongoing digital transformation imperative across the BFSI sector, coupled with stringent regulatory demands, ensures sustained demand for specialized technology services and software. Opportunities lie in providing integrated solutions that address the entire trade lifecycle, from front-office analytics to back-office settlement and compliance, with a strong emphasis on cybersecurity and data governance. The market is poised for further consolidation and innovation, particularly in areas like sustainable finance technology and personalized investor experiences.
Capital Markets Technology Solutions Segmentation
-
1. Application
- 1.1. BFSI
- 1.2. Government & Defense
- 1.3. Healthcare
- 1.4. IT & Telecom
- 1.5. Retail & E-commerce
- 1.6. Others
-
2. Type
- 2.1. Hardware
- 2.2. Software
- 2.3. Services
Capital Markets Technology Solutions Segmentation By Geography
-
1. North America
- 1.1. United States
- 1.2. Canada
- 1.3. Mexico
-
2. South America
- 2.1. Brazil
- 2.2. Argentina
- 2.3. Rest of South America
-
3. Europe
- 3.1. United Kingdom
- 3.2. Germany
- 3.3. France
- 3.4. Italy
- 3.5. Spain
- 3.6. Russia
- 3.7. Benelux
- 3.8. Nordics
- 3.9. Rest of Europe
-
4. Middle East & Africa
- 4.1. Turkey
- 4.2. Israel
- 4.3. GCC
- 4.4. North Africa
- 4.5. South Africa
- 4.6. Rest of Middle East & Africa
-
5. Asia Pacific
- 5.1. China
- 5.2. India
- 5.3. Japan
- 5.4. South Korea
- 5.5. ASEAN
- 5.6. Oceania
- 5.7. Rest of Asia Pacific
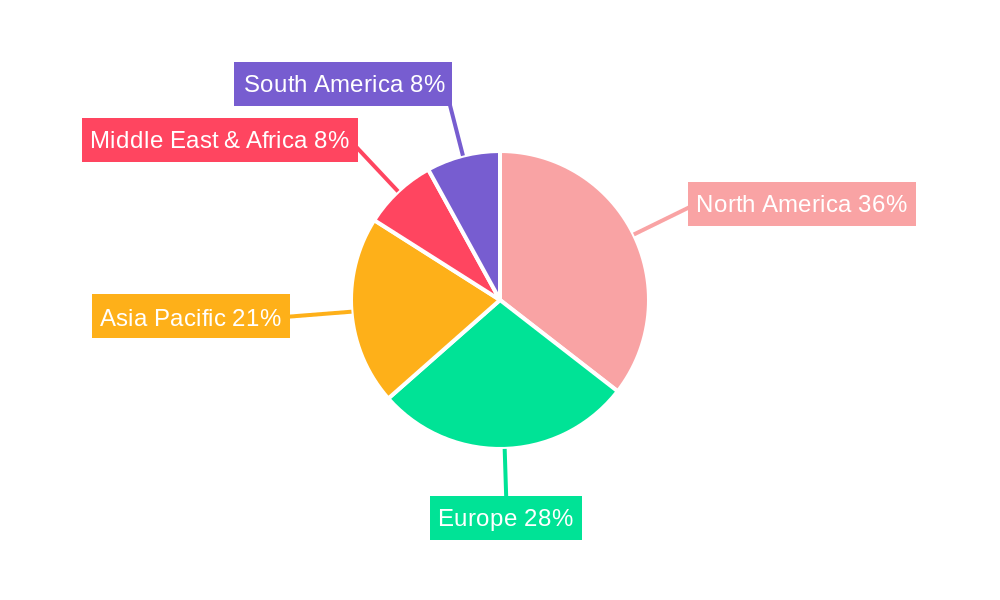
Capital Markets Technology Solutions Regional Market Share
Geographic Coverage of Capital Markets Technology Solutions
Capital Markets Technology Solutions REPORT HIGHLIGHTS
| Aspects | Details |
|---|---|
| Study Period | 2020-2034 |
| Base Year | 2025 |
| Estimated Year | 2026 |
| Forecast Period | 2026-2034 |
| Historical Period | 2020-2025 |
| Growth Rate | CAGR of 7.9% from 2020-2034 |
| Segmentation |
|
Table of Contents
- 1. Introduction
- 1.1. Research Scope
- 1.2. Market Segmentation
- 1.3. Research Objective
- 1.4. Definitions and Assumptions
- 2. Executive Summary
- 2.1. Market Snapshot
- 3. Market Dynamics
- 3.1. Market Drivers
- 3.2. Market Restrains
- 3.3. Market Trends
- 3.4. Market Opportunities
- 4. Market Factor Analysis
- 4.1. Porters Five Forces
- 4.1.1. Bargaining Power of Suppliers
- 4.1.2. Bargaining Power of Buyers
- 4.1.3. Threat of New Entrants
- 4.1.4. Threat of Substitutes
- 4.1.5. Competitive Rivalry
- 4.2. PESTEL analysis
- 4.3. BCG Analysis
- 4.3.1. Stars (High Growth, High Market Share)
- 4.3.2. Cash Cows (Low Growth, High Market Share)
- 4.3.3. Question Mark (High Growth, Low Market Share)
- 4.3.4. Dogs (Low Growth, Low Market Share)
- 4.4. Ansoff Matrix Analysis
- 4.5. Supply Chain Analysis
- 4.6. Regulatory Landscape
- 4.7. Current Market Potential and Opportunity Assessment (TAM–SAM–SOM Framework)
- 4.8. RAX Analyst Note
- 4.1. Porters Five Forces
- 5. Market Analysis, Insights and Forecast 2021-2033
- 5.1. Market Analysis, Insights and Forecast - by Application
- 5.1.1. BFSI
- 5.1.2. Government & Defense
- 5.1.3. Healthcare
- 5.1.4. IT & Telecom
- 5.1.5. Retail & E-commerce
- 5.1.6. Others
- 5.2. Market Analysis, Insights and Forecast - by Type
- 5.2.1. Hardware
- 5.2.2. Software
- 5.2.3. Services
- 5.3. Market Analysis, Insights and Forecast - by Region
- 5.3.1. North America
- 5.3.2. South America
- 5.3.3. Europe
- 5.3.4. Middle East & Africa
- 5.3.5. Asia Pacific
- 5.1. Market Analysis, Insights and Forecast - by Application
- 6. Global Capital Markets Technology Solutions Analysis, Insights and Forecast, 2021-2033
- 6.1. Market Analysis, Insights and Forecast - by Application
- 6.1.1. BFSI
- 6.1.2. Government & Defense
- 6.1.3. Healthcare
- 6.1.4. IT & Telecom
- 6.1.5. Retail & E-commerce
- 6.1.6. Others
- 6.2. Market Analysis, Insights and Forecast - by Type
- 6.2.1. Hardware
- 6.2.2. Software
- 6.2.3. Services
- 6.1. Market Analysis, Insights and Forecast - by Application
- 7. North America Capital Markets Technology Solutions Analysis, Insights and Forecast, 2020-2032
- 7.1. Market Analysis, Insights and Forecast - by Application
- 7.1.1. BFSI
- 7.1.2. Government & Defense
- 7.1.3. Healthcare
- 7.1.4. IT & Telecom
- 7.1.5. Retail & E-commerce
- 7.1.6. Others
- 7.2. Market Analysis, Insights and Forecast - by Type
- 7.2.1. Hardware
- 7.2.2. Software
- 7.2.3. Services
- 7.1. Market Analysis, Insights and Forecast - by Application
- 8. South America Capital Markets Technology Solutions Analysis, Insights and Forecast, 2020-2032
- 8.1. Market Analysis, Insights and Forecast - by Application
- 8.1.1. BFSI
- 8.1.2. Government & Defense
- 8.1.3. Healthcare
- 8.1.4. IT & Telecom
- 8.1.5. Retail & E-commerce
- 8.1.6. Others
- 8.2. Market Analysis, Insights and Forecast - by Type
- 8.2.1. Hardware
- 8.2.2. Software
- 8.2.3. Services
- 8.1. Market Analysis, Insights and Forecast - by Application
- 9. Europe Capital Markets Technology Solutions Analysis, Insights and Forecast, 2020-2032
- 9.1. Market Analysis, Insights and Forecast - by Application
- 9.1.1. BFSI
- 9.1.2. Government & Defense
- 9.1.3. Healthcare
- 9.1.4. IT & Telecom
- 9.1.5. Retail & E-commerce
- 9.1.6. Others
- 9.2. Market Analysis, Insights and Forecast - by Type
- 9.2.1. Hardware
- 9.2.2. Software
- 9.2.3. Services
- 9.1. Market Analysis, Insights and Forecast - by Application
- 10. Middle East & Africa Capital Markets Technology Solutions Analysis, Insights and Forecast, 2020-2032
- 10.1. Market Analysis, Insights and Forecast - by Application
- 10.1.1. BFSI
- 10.1.2. Government & Defense
- 10.1.3. Healthcare
- 10.1.4. IT & Telecom
- 10.1.5. Retail & E-commerce
- 10.1.6. Others
- 10.2. Market Analysis, Insights and Forecast - by Type
- 10.2.1. Hardware
- 10.2.2. Software
- 10.2.3. Services
- 10.1. Market Analysis, Insights and Forecast - by Application
- 11. Asia Pacific Capital Markets Technology Solutions Analysis, Insights and Forecast, 2020-2032
- 11.1. Market Analysis, Insights and Forecast - by Application
- 11.1.1. BFSI
- 11.1.2. Government & Defense
- 11.1.3. Healthcare
- 11.1.4. IT & Telecom
- 11.1.5. Retail & E-commerce
- 11.1.6. Others
- 11.2. Market Analysis, Insights and Forecast - by Type
- 11.2.1. Hardware
- 11.2.2. Software
- 11.2.3. Services
- 11.1. Market Analysis, Insights and Forecast - by Application
- 12. Competitive Analysis
- 12.1. Company Profiles
- 12.1.1 Microsoft
- 12.1.1.1. Company Overview
- 12.1.1.2. Products
- 12.1.1.3. Company Financials
- 12.1.1.4. SWOT Analysis
- 12.1.2 Fenergo
- 12.1.2.1. Company Overview
- 12.1.2.2. Products
- 12.1.2.3. Company Financials
- 12.1.2.4. SWOT Analysis
- 12.1.3 Cognizant
- 12.1.3.1. Company Overview
- 12.1.3.2. Products
- 12.1.3.3. Company Financials
- 12.1.3.4. SWOT Analysis
- 12.1.4 Accenture
- 12.1.4.1. Company Overview
- 12.1.4.2. Products
- 12.1.4.3. Company Financials
- 12.1.4.4. SWOT Analysis
- 12.1.5 Intel
- 12.1.5.1. Company Overview
- 12.1.5.2. Products
- 12.1.5.3. Company Financials
- 12.1.5.4. SWOT Analysis
- 12.1.6 Tech Mahindra
- 12.1.6.1. Company Overview
- 12.1.6.2. Products
- 12.1.6.3. Company Financials
- 12.1.6.4. SWOT Analysis
- 12.1.7 Wipro
- 12.1.7.1. Company Overview
- 12.1.7.2. Products
- 12.1.7.3. Company Financials
- 12.1.7.4. SWOT Analysis
- 12.1.8 DXC Technology
- 12.1.8.1. Company Overview
- 12.1.8.2. Products
- 12.1.8.3. Company Financials
- 12.1.8.4. SWOT Analysis
- 12.1.9 Capgemini
- 12.1.9.1. Company Overview
- 12.1.9.2. Products
- 12.1.9.3. Company Financials
- 12.1.9.4. SWOT Analysis
- 12.1.10 Infosys
- 12.1.10.1. Company Overview
- 12.1.10.2. Products
- 12.1.10.3. Company Financials
- 12.1.10.4. SWOT Analysis
- 12.1.11 Mphasis
- 12.1.11.1. Company Overview
- 12.1.11.2. Products
- 12.1.11.3. Company Financials
- 12.1.11.4. SWOT Analysis
- 12.1.12 Zensar
- 12.1.12.1. Company Overview
- 12.1.12.2. Products
- 12.1.12.3. Company Financials
- 12.1.12.4. SWOT Analysis
- 12.1.13 Virtusa
- 12.1.13.1. Company Overview
- 12.1.13.2. Products
- 12.1.13.3. Company Financials
- 12.1.13.4. SWOT Analysis
- 12.1.14 EPAM
- 12.1.14.1. Company Overview
- 12.1.14.2. Products
- 12.1.14.3. Company Financials
- 12.1.14.4. SWOT Analysis
- 12.1.15 Birlasoft
- 12.1.15.1. Company Overview
- 12.1.15.2. Products
- 12.1.15.3. Company Financials
- 12.1.15.4. SWOT Analysis
- 12.1.16 NSEIT
- 12.1.16.1. Company Overview
- 12.1.16.2. Products
- 12.1.16.3. Company Financials
- 12.1.16.4. SWOT Analysis
- 12.1.17 Coforge
- 12.1.17.1. Company Overview
- 12.1.17.2. Products
- 12.1.17.3. Company Financials
- 12.1.17.4. SWOT Analysis
- 12.1.18 Apexon
- 12.1.18.1. Company Overview
- 12.1.18.2. Products
- 12.1.18.3. Company Financials
- 12.1.18.4. SWOT Analysis
- 12.1.19 SoftServe
- 12.1.19.1. Company Overview
- 12.1.19.2. Products
- 12.1.19.3. Company Financials
- 12.1.19.4. SWOT Analysis
- 12.1.20 Accolite Digital
- 12.1.20.1. Company Overview
- 12.1.20.2. Products
- 12.1.20.3. Company Financials
- 12.1.20.4. SWOT Analysis
- 12.1.21 Kyndryl
- 12.1.21.1. Company Overview
- 12.1.21.2. Products
- 12.1.21.3. Company Financials
- 12.1.21.4. SWOT Analysis
- 12.1.22 HCLTech
- 12.1.22.1. Company Overview
- 12.1.22.2. Products
- 12.1.22.3. Company Financials
- 12.1.22.4. SWOT Analysis
- 12.1.23 LTIMindtree
- 12.1.23.1. Company Overview
- 12.1.23.2. Products
- 12.1.23.3. Company Financials
- 12.1.23.4. SWOT Analysis
- 12.1.24 Nous Infosystems
- 12.1.24.1. Company Overview
- 12.1.24.2. Products
- 12.1.24.3. Company Financials
- 12.1.24.4. SWOT Analysis
- 12.1.25 Hitachi
- 12.1.25.1. Company Overview
- 12.1.25.2. Products
- 12.1.25.3. Company Financials
- 12.1.25.4. SWOT Analysis
- 12.1.26 Stefanini Group
- 12.1.26.1. Company Overview
- 12.1.26.2. Products
- 12.1.26.3. Company Financials
- 12.1.26.4. SWOT Analysis
- 12.1.27 Ness Digital Engineering
- 12.1.27.1. Company Overview
- 12.1.27.2. Products
- 12.1.27.3. Company Financials
- 12.1.27.4. SWOT Analysis
- 12.1.28 Xoriant
- 12.1.28.1. Company Overview
- 12.1.28.2. Products
- 12.1.28.3. Company Financials
- 12.1.28.4. SWOT Analysis
- 12.1.29 Exadel
- 12.1.29.1. Company Overview
- 12.1.29.2. Products
- 12.1.29.3. Company Financials
- 12.1.29.4. SWOT Analysis
- 12.1.30 OpenGamma
- 12.1.30.1. Company Overview
- 12.1.30.2. Products
- 12.1.30.3. Company Financials
- 12.1.30.4. SWOT Analysis
- 12.1.1 Microsoft
- 12.2. Market Entropy
- 12.2.1 Company's Key Areas Served
- 12.2.2 Recent Developments
- 12.3. Company Market Share Analysis 2025
- 12.3.1 Top 5 Companies Market Share Analysis
- 12.3.2 Top 3 Companies Market Share Analysis
- 12.4. List of Potential Customers
- 13. Research Methodology
List of Figures
- Figure 1: Global Capital Markets Technology Solutions Revenue Breakdown (million, %) by Region 2025 & 2033
- Figure 2: North America Capital Markets Technology Solutions Revenue (million), by Application 2025 & 2033
- Figure 3: North America Capital Markets Technology Solutions Revenue Share (%), by Application 2025 & 2033
- Figure 4: North America Capital Markets Technology Solutions Revenue (million), by Type 2025 & 2033
- Figure 5: North America Capital Markets Technology Solutions Revenue Share (%), by Type 2025 & 2033
- Figure 6: North America Capital Markets Technology Solutions Revenue (million), by Country 2025 & 2033
- Figure 7: North America Capital Markets Technology Solutions Revenue Share (%), by Country 2025 & 2033
- Figure 8: South America Capital Markets Technology Solutions Revenue (million), by Application 2025 & 2033
- Figure 9: South America Capital Markets Technology Solutions Revenue Share (%), by Application 2025 & 2033
- Figure 10: South America Capital Markets Technology Solutions Revenue (million), by Type 2025 & 2033
- Figure 11: South America Capital Markets Technology Solutions Revenue Share (%), by Type 2025 & 2033
- Figure 12: South America Capital Markets Technology Solutions Revenue (million), by Country 2025 & 2033
- Figure 13: South America Capital Markets Technology Solutions Revenue Share (%), by Country 2025 & 2033
- Figure 14: Europe Capital Markets Technology Solutions Revenue (million), by Application 2025 & 2033
- Figure 15: Europe Capital Markets Technology Solutions Revenue Share (%), by Application 2025 & 2033
- Figure 16: Europe Capital Markets Technology Solutions Revenue (million), by Type 2025 & 2033
- Figure 17: Europe Capital Markets Technology Solutions Revenue Share (%), by Type 2025 & 2033
- Figure 18: Europe Capital Markets Technology Solutions Revenue (million), by Country 2025 & 2033
- Figure 19: Europe Capital Markets Technology Solutions Revenue Share (%), by Country 2025 & 2033
- Figure 20: Middle East & Africa Capital Markets Technology Solutions Revenue (million), by Application 2025 & 2033
- Figure 21: Middle East & Africa Capital Markets Technology Solutions Revenue Share (%), by Application 2025 & 2033
- Figure 22: Middle East & Africa Capital Markets Technology Solutions Revenue (million), by Type 2025 & 2033
- Figure 23: Middle East & Africa Capital Markets Technology Solutions Revenue Share (%), by Type 2025 & 2033
- Figure 24: Middle East & Africa Capital Markets Technology Solutions Revenue (million), by Country 2025 & 2033
- Figure 25: Middle East & Africa Capital Markets Technology Solutions Revenue Share (%), by Country 2025 & 2033
- Figure 26: Asia Pacific Capital Markets Technology Solutions Revenue (million), by Application 2025 & 2033
- Figure 27: Asia Pacific Capital Markets Technology Solutions Revenue Share (%), by Application 2025 & 2033
- Figure 28: Asia Pacific Capital Markets Technology Solutions Revenue (million), by Type 2025 & 2033
- Figure 29: Asia Pacific Capital Markets Technology Solutions Revenue Share (%), by Type 2025 & 2033
- Figure 30: Asia Pacific Capital Markets Technology Solutions Revenue (million), by Country 2025 & 2033
- Figure 31: Asia Pacific Capital Markets Technology Solutions Revenue Share (%), by Country 2025 & 2033
List of Tables
- Table 1: Global Capital Markets Technology Solutions Revenue million Forecast, by Application 2020 & 2033
- Table 2: Global Capital Markets Technology Solutions Revenue million Forecast, by Type 2020 & 2033
- Table 3: Global Capital Markets Technology Solutions Revenue million Forecast, by Region 2020 & 2033
- Table 4: Global Capital Markets Technology Solutions Revenue million Forecast, by Application 2020 & 2033
- Table 5: Global Capital Markets Technology Solutions Revenue million Forecast, by Type 2020 & 2033
- Table 6: Global Capital Markets Technology Solutions Revenue million Forecast, by Country 2020 & 2033
- Table 7: United States Capital Markets Technology Solutions Revenue (million) Forecast, by Application 2020 & 2033
- Table 8: Canada Capital Markets Technology Solutions Revenue (million) Forecast, by Application 2020 & 2033
- Table 9: Mexico Capital Markets Technology Solutions Revenue (million) Forecast, by Application 2020 & 2033
- Table 10: Global Capital Markets Technology Solutions Revenue million Forecast, by Application 2020 & 2033
- Table 11: Global Capital Markets Technology Solutions Revenue million Forecast, by Type 2020 & 2033
- Table 12: Global Capital Markets Technology Solutions Revenue million Forecast, by Country 2020 & 2033
- Table 13: Brazil Capital Markets Technology Solutions Revenue (million) Forecast, by Application 2020 & 2033
- Table 14: Argentina Capital Markets Technology Solutions Revenue (million) Forecast, by Application 2020 & 2033
- Table 15: Rest of South America Capital Markets Technology Solutions Revenue (million) Forecast, by Application 2020 & 2033
- Table 16: Global Capital Markets Technology Solutions Revenue million Forecast, by Application 2020 & 2033
- Table 17: Global Capital Markets Technology Solutions Revenue million Forecast, by Type 2020 & 2033
- Table 18: Global Capital Markets Technology Solutions Revenue million Forecast, by Country 2020 & 2033
- Table 19: United Kingdom Capital Markets Technology Solutions Revenue (million) Forecast, by Application 2020 & 2033
- Table 20: Germany Capital Markets Technology Solutions Revenue (million) Forecast, by Application 2020 & 2033
- Table 21: France Capital Markets Technology Solutions Revenue (million) Forecast, by Application 2020 & 2033
- Table 22: Italy Capital Markets Technology Solutions Revenue (million) Forecast, by Application 2020 & 2033
- Table 23: Spain Capital Markets Technology Solutions Revenue (million) Forecast, by Application 2020 & 2033
- Table 24: Russia Capital Markets Technology Solutions Revenue (million) Forecast, by Application 2020 & 2033
- Table 25: Benelux Capital Markets Technology Solutions Revenue (million) Forecast, by Application 2020 & 2033
- Table 26: Nordics Capital Markets Technology Solutions Revenue (million) Forecast, by Application 2020 & 2033
- Table 27: Rest of Europe Capital Markets Technology Solutions Revenue (million) Forecast, by Application 2020 & 2033
- Table 28: Global Capital Markets Technology Solutions Revenue million Forecast, by Application 2020 & 2033
- Table 29: Global Capital Markets Technology Solutions Revenue million Forecast, by Type 2020 & 2033
- Table 30: Global Capital Markets Technology Solutions Revenue million Forecast, by Country 2020 & 2033
- Table 31: Turkey Capital Markets Technology Solutions Revenue (million) Forecast, by Application 2020 & 2033
- Table 32: Israel Capital Markets Technology Solutions Revenue (million) Forecast, by Application 2020 & 2033
- Table 33: GCC Capital Markets Technology Solutions Revenue (million) Forecast, by Application 2020 & 2033
- Table 34: North Africa Capital Markets Technology Solutions Revenue (million) Forecast, by Application 2020 & 2033
- Table 35: South Africa Capital Markets Technology Solutions Revenue (million) Forecast, by Application 2020 & 2033
- Table 36: Rest of Middle East & Africa Capital Markets Technology Solutions Revenue (million) Forecast, by Application 2020 & 2033
- Table 37: Global Capital Markets Technology Solutions Revenue million Forecast, by Application 2020 & 2033
- Table 38: Global Capital Markets Technology Solutions Revenue million Forecast, by Type 2020 & 2033
- Table 39: Global Capital Markets Technology Solutions Revenue million Forecast, by Country 2020 & 2033
- Table 40: China Capital Markets Technology Solutions Revenue (million) Forecast, by Application 2020 & 2033
- Table 41: India Capital Markets Technology Solutions Revenue (million) Forecast, by Application 2020 & 2033
- Table 42: Japan Capital Markets Technology Solutions Revenue (million) Forecast, by Application 2020 & 2033
- Table 43: South Korea Capital Markets Technology Solutions Revenue (million) Forecast, by Application 2020 & 2033
- Table 44: ASEAN Capital Markets Technology Solutions Revenue (million) Forecast, by Application 2020 & 2033
- Table 45: Oceania Capital Markets Technology Solutions Revenue (million) Forecast, by Application 2020 & 2033
- Table 46: Rest of Asia Pacific Capital Markets Technology Solutions Revenue (million) Forecast, by Application 2020 & 2033
Frequently Asked Questions
1. What is the projected Compound Annual Growth Rate (CAGR) of the Capital Markets Technology Solutions?
The projected CAGR is approximately 7.9%.
2. Which companies are prominent players in the Capital Markets Technology Solutions?
Key companies in the market include Microsoft, Fenergo, Cognizant, Accenture, Intel, Tech Mahindra, Wipro, DXC Technology, Capgemini, Infosys, Mphasis, Zensar, Virtusa, EPAM, Birlasoft, NSEIT, Coforge, Apexon, SoftServe, Accolite Digital, Kyndryl, HCLTech, LTIMindtree, Nous Infosystems, Hitachi, Stefanini Group, Ness Digital Engineering, Xoriant, Exadel, OpenGamma.
3. What are the main segments of the Capital Markets Technology Solutions?
The market segments include Application, Type.
4. Can you provide details about the market size?
The market size is estimated to be USD 235870 million as of 2022.
5. What are some drivers contributing to market growth?
N/A
6. What are the notable trends driving market growth?
N/A
7. Are there any restraints impacting market growth?
N/A
8. Can you provide examples of recent developments in the market?
N/A
9. What pricing options are available for accessing the report?
Pricing options include single-user, multi-user, and enterprise licenses priced at USD 4250.00, USD 6375.00, and USD 8500.00 respectively.
10. Is the market size provided in terms of value or volume?
The market size is provided in terms of value, measured in million.
11. Are there any specific market keywords associated with the report?
Yes, the market keyword associated with the report is "Capital Markets Technology Solutions," which aids in identifying and referencing the specific market segment covered.
12. How do I determine which pricing option suits my needs best?
The pricing options vary based on user requirements and access needs. Individual users may opt for single-user licenses, while businesses requiring broader access may choose multi-user or enterprise licenses for cost-effective access to the report.
13. Are there any additional resources or data provided in the Capital Markets Technology Solutions report?
While the report offers comprehensive insights, it's advisable to review the specific contents or supplementary materials provided to ascertain if additional resources or data are available.
14. How can I stay updated on further developments or reports in the Capital Markets Technology Solutions?
To stay informed about further developments, trends, and reports in the Capital Markets Technology Solutions, consider subscribing to industry newsletters, following relevant companies and organizations, or regularly checking reputable industry news sources and publications.
Methodology
Step 1 - Identification of Relevant Samples Size from Population Database


Step 2 - Approaches for Defining Global Market Size (Value, Volume* & Price*)

Note*: In applicable scenarios
Step 3 - Data Sources
Primary Research
- Web Analytics
- Survey Reports
- Research Institute
- Latest Research Reports
- Opinion Leaders
Secondary Research
- Annual Reports
- White Paper
- Latest Press Release
- Industry Association
- Paid Database
- Investor Presentations

Step 4 - Data Triangulation
Involves using different sources of information in order to increase the validity of a study
These sources are likely to be stakeholders in a program - participants, other researchers, program staff, other community members, and so on.
Then we put all data in single framework & apply various statistical tools to find out the dynamic on the market.
During the analysis stage, feedback from the stakeholder groups would be compared to determine areas of agreement as well as areas of divergence