

Key Insights
The global car rental market, a vital component of the tourism industry, is poised for significant expansion. Projections indicate a robust Compound Annual Growth Rate (CAGR) of 9.77% from 2024 to 2033. This upward trajectory is propelled by several influential factors, including the widespread adoption of online booking platforms that enhance accessibility and user convenience. A surge in both international and domestic travel, particularly leisure tourism, is a primary demand driver. The availability of a diverse vehicle fleet, spanning from cost-effective economy options to premium luxury choices, further stimulates market growth. Additionally, the increasing preference for self-drive rentals, offering unparalleled flexibility and personalized exploration, significantly contributes to the market's expansion. While external factors like fuel price volatility and economic fluctuations may present transient challenges, the overarching positive trends in global tourism and ongoing technological advancements are expected to ensure sustained market growth.
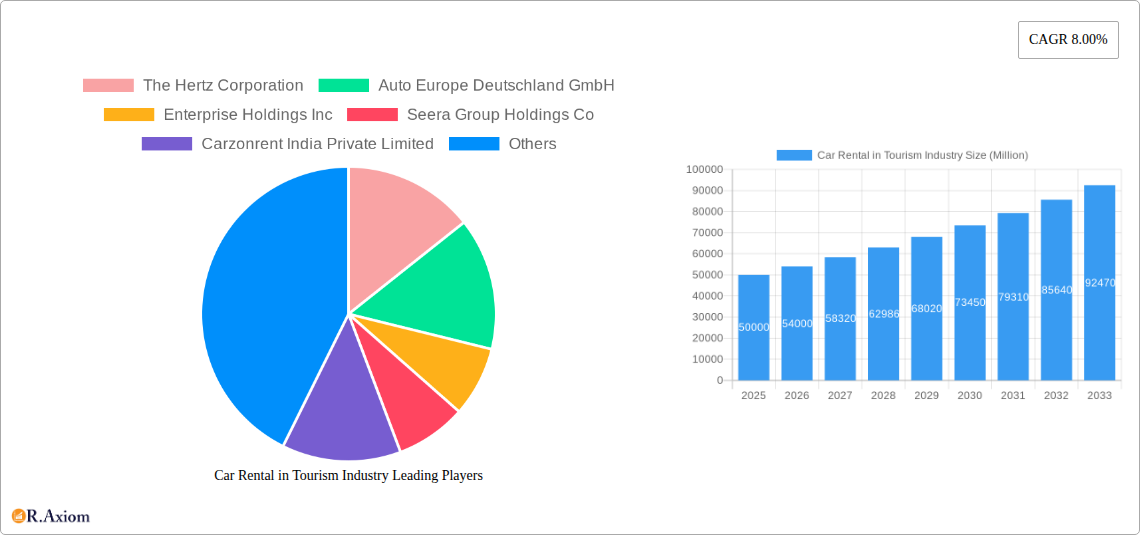
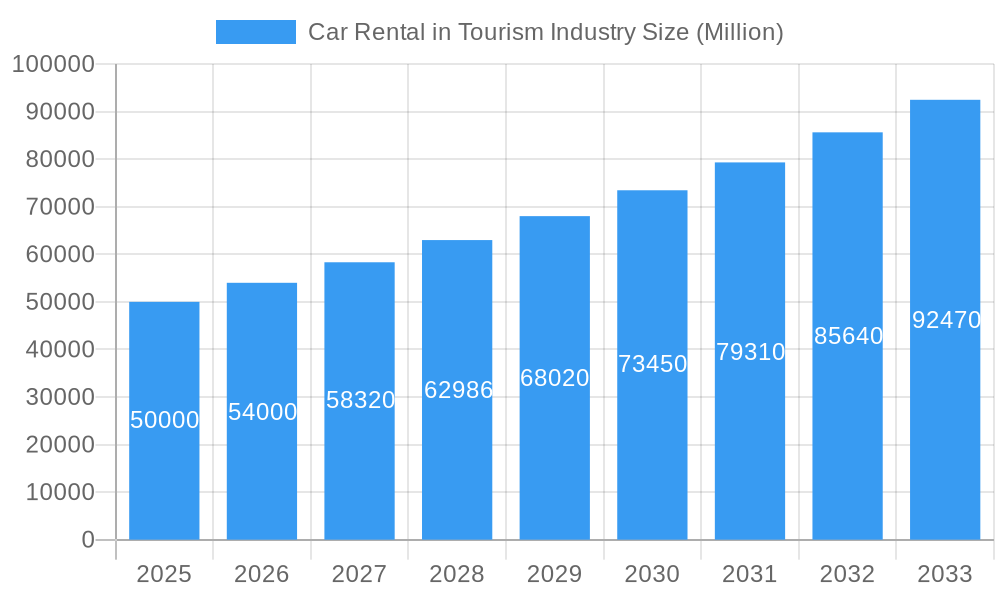
Car Rental in Tourism Industry Market Size (In Billion)
Market segmentation analysis highlights substantial opportunities across various vehicle categories and booking channels, with online reservations leading due to evolving consumer preferences for digital solutions. The self-drive segment commands a considerable market share, driven by travelers' desire for independence and bespoke travel experiences. Geographically, North America and Europe exhibit strong growth, while the Asia-Pacific region is rapidly emerging as a key market with immense future potential. Leading industry players, including Hertz, Enterprise, Avis, and Sixt, are strategically engaged in market expansion, technological innovation, and service enhancement to capture these opportunities. The market's evolution is characterized by a continuous focus on improving customer experience through features such as mobile applications, loyalty programs, and personalized service offerings. The forecast period anticipates sustained growth, underpinned by the enduring appeal of self-drive tourism and continuous service refinements. The projected market size is 129.66 billion for the base year 2024, with an anticipated expansion to reach approximately 129.66 billion by 2033, reflecting the calculated CAGR.
Car Rental in Tourism Industry Company Market Share
Car Rental in Tourism Industry: A Comprehensive Market Report (2019-2033)
This comprehensive report provides an in-depth analysis of the global car rental market within the tourism industry, covering the period from 2019 to 2033. The report offers invaluable insights for industry stakeholders, investors, and businesses seeking to understand the market dynamics, growth opportunities, and competitive landscape. With a focus on key players like The Hertz Corporation, Enterprise Holdings Inc., and Sixt SE, the report uses data-driven analysis to project a market exceeding $XX million by 2033. This report is crucial for strategic decision-making and navigating the evolving car rental landscape within the tourism sector.
Car Rental in Tourism Industry Market Concentration & Innovation
The global car rental market within the tourism industry exhibits a moderately concentrated structure, with a few major players commanding significant market share. The Hertz Corporation, Enterprise Holdings Inc., Avis Budget Group Inc., and Sixt SE are among the leading players, each possessing a substantial global footprint. However, regional players and specialized niche providers also play a crucial role, contributing to a dynamic competitive environment. Market share fluctuations are driven by factors such as M&A activity, technological innovation, and economic conditions. For instance, Volkswagen's USD 3.4 billion acquisition of Europcar in 2021 significantly reshaped the competitive landscape.
- Market Concentration: The top 5 players hold an estimated XX% market share in 2025, with a projected increase to XX% by 2033.
- Innovation Drivers: Technological advancements such as mobile booking apps, automated check-in/check-out kiosks, and the integration of AI-powered chatbots are driving significant innovation. The rise of car subscription services, exemplified by ekar's launch in Thailand, represents a paradigm shift in the industry.
- Regulatory Frameworks: Varying regulations across different countries significantly impact market access and operations. Compliance requirements and licensing procedures influence operational costs and market entry barriers.
- Product Substitutes: The emergence of ride-sharing services (Uber, Lyft) and public transportation systems pose significant competition, particularly in urban areas.
- End-User Trends: The increasing preference for online booking, self-driven rentals, and the demand for luxury/premium vehicles are influencing market segmentation and service offerings.
- M&A Activities: The Volkswagen-Europcar acquisition, along with other strategic mergers and acquisitions, demonstrates the consolidation trend within the industry, creating larger, more integrated players. The total value of M&A deals in the observed period was approximately $XX million.
Car Rental in Tourism Industry Industry Trends & Insights
The car rental market in the tourism sector is experiencing robust growth, driven by several key factors. The rising global tourism industry is a primary driver, fueling demand for car rental services worldwide. Technological advancements, such as mobile-first booking platforms and streamlined rental processes, have enhanced customer experience and operational efficiency. Changing consumer preferences, such as a growing preference for self-drive rentals and the increasing popularity of luxury vehicles for leisure travel, are significantly influencing market segmentation and product offerings. The industry’s CAGR during 2019-2024 was XX%, with a projected CAGR of XX% from 2025-2033. Market penetration in key tourism destinations continues to rise, with online bookings accounting for a significant portion of transactions. Competitive dynamics are characterized by intense rivalry, with key players investing heavily in technological advancements and brand building. Increased competition from ride-hailing companies and alternative mobility solutions also shapes market strategies.
Dominant Markets & Segments in Car Rental in Tourism Industry
The North American and European markets dominate the global car rental market within the tourism industry. These regions benefit from robust tourism infrastructure, high disposable incomes, and a well-established car rental sector. However, emerging markets in Asia-Pacific and the Middle East are experiencing rapid growth, fueled by rising tourism numbers and increasing vehicle ownership. The economy segment remains the largest by volume, driven by budget-conscious travelers. However, the luxury/premium segment is exhibiting faster growth rates, reflecting the increasing demand for high-end travel experiences. Online booking dominates the booking mode, while self-driven rentals comprise the majority of end-user preference.
- Key Drivers for Dominant Regions:
- North America: Strong domestic tourism, high vehicle ownership rates, well-developed infrastructure.
- Europe: High inbound tourism, diverse travel destinations, efficient transportation networks.
- Asia-Pacific: Rapidly growing tourism sector, rising disposable incomes, increasing vehicle ownership.
- Dominant Segments:
- Vehicle Type: Economy (largest volume), Luxury/Premium (fastest growth).
- Booking Mode: Online (highest market share).
- End User: Self-Driven (dominant segment).
Car Rental in Tourism Industry Product Developments
The car rental industry is witnessing rapid product innovation, driven by technological advancements and changing consumer expectations. This includes the development of mobile-first booking platforms offering seamless user experiences, the integration of AI-powered chatbots for customer service, and the implementation of automated check-in/check-out systems. The introduction of car subscription services is also a notable development, offering flexible and cost-effective alternatives to traditional rentals. These innovations enhance customer convenience, improve operational efficiency, and cater to the evolving needs of the modern traveler.
Report Scope & Segmentation Analysis
This report segments the car rental market in the tourism industry across several key parameters:
- Vehicle Type: Economy, Luxury/Premium (Growth projections and market size are detailed within the full report).
- Booking Mode: Online, Offline (Market size and competitive dynamics are analyzed within the full report).
- End User: Self-Driven, Rental Agencies (Growth projections and competitive landscapes are described in the full report).
Each segment's market size, growth projections, and competitive dynamics are thoroughly analyzed within the complete report.
Key Drivers of Car Rental in Tourism Industry Growth
The growth of the car rental market in the tourism industry is propelled by several factors: the booming tourism sector, rising disposable incomes in emerging economies, technological advancements enabling seamless booking and enhanced customer experiences, and the increasing preference for self-drive rentals, offering travelers greater flexibility and control over their itineraries. Government initiatives promoting tourism infrastructure further stimulate market expansion.
Challenges in the Car Rental in Tourism Industry Sector
The car rental industry faces challenges such as intense competition from ride-hailing services and public transport, fluctuating fuel prices impacting operational costs, stringent regulatory environments varying across different jurisdictions, and the complexities of managing a large fleet of vehicles and maintaining their upkeep, These factors can influence profitability and market share.
Emerging Opportunities in Car Rental in Tourism Industry
The industry presents opportunities such as expansion into emerging markets with growing tourism sectors, integrating sustainable practices in fleet management to appeal to environmentally conscious travelers, leveraging data analytics for personalized customer service and optimizing pricing strategies, and introducing innovative subscription models to cater to the evolving needs of travelers seeking flexible and affordable transportation solutions.
Leading Players in the Car Rental in Tourism Industry Market
- The Hertz Corporation
- Auto Europe Deutschland GmbH
- Enterprise Holdings Inc
- Seera Group Holdings Co
- Carzonrent India Private Limited
- Sixt SE
- ZoomCar Inc
- Europcar Mobility Group
- Avis Budget Group Inc
Key Developments in Car Rental in Tourism Industry Industry
- February 2021: Theeb Rent a Car expands its fleet in Saudi Arabia, adding over 1,700 vehicles, including luxury and economy models. This indicates growth in the Middle Eastern market and a focus on catering to diverse customer preferences.
- July 2021: Europcar Mobility Group's Key'n Go launches a fully digital car rental solution in 35 Southern European airports, enhancing convenience and speed for customers. This highlights the impact of digitalization on the industry.
- November 2021: Hertz partners with Tesla, acquiring 100,000 Model 3s, with half slated for Uber drivers. This showcases the adoption of electric vehicles and the collaboration with ride-sharing platforms.
- December 2021: Volkswagen acquires Europcar for USD 3.4 billion, a major consolidation move impacting market dynamics.
- January 2022: ekar launches car subscription services in Thailand, introducing a new business model to the car rental landscape.
Strategic Outlook for Car Rental in Tourism Industry Market
The car rental market within the tourism industry is poised for continued growth, driven by increasing global travel, technological advancements, and evolving consumer preferences. Opportunities lie in expanding into emerging markets, adopting sustainable practices, and innovating service models to meet the diverse needs of modern travelers. Strategic investments in technology, fleet modernization, and customer-centric services will be key to achieving sustainable growth and maintaining a competitive edge in this dynamic sector.
Car Rental in Tourism Industry Segmentation
-
1. Vehicle Type
- 1.1. Economy
- 1.2. Luxury/Premium
-
2. Booking Mode
- 2.1. Online
- 2.2. Offline
-
3. End User
- 3.1. Self Driven
- 3.2. Rental Agencies
Car Rental in Tourism Industry Segmentation By Geography
-
1. North America
- 1.1. United states
- 1.2. Canada
- 1.3. Rest of North america
-
2. Europe
- 2.1. Germany
- 2.2. United Kingdom
- 2.3. France
- 2.4. Italy
- 2.5. Norway
- 2.6. Netherlands
- 2.7. Rest of Europe
-
3. Asia Pacific
- 3.1. China
- 3.2. India
- 3.3. Japan
- 3.4. South Korea
- 3.5. Rest of Asia Pacific
-
4. Rest of the World
- 4.1. South America
- 4.2. Middle East and Africa
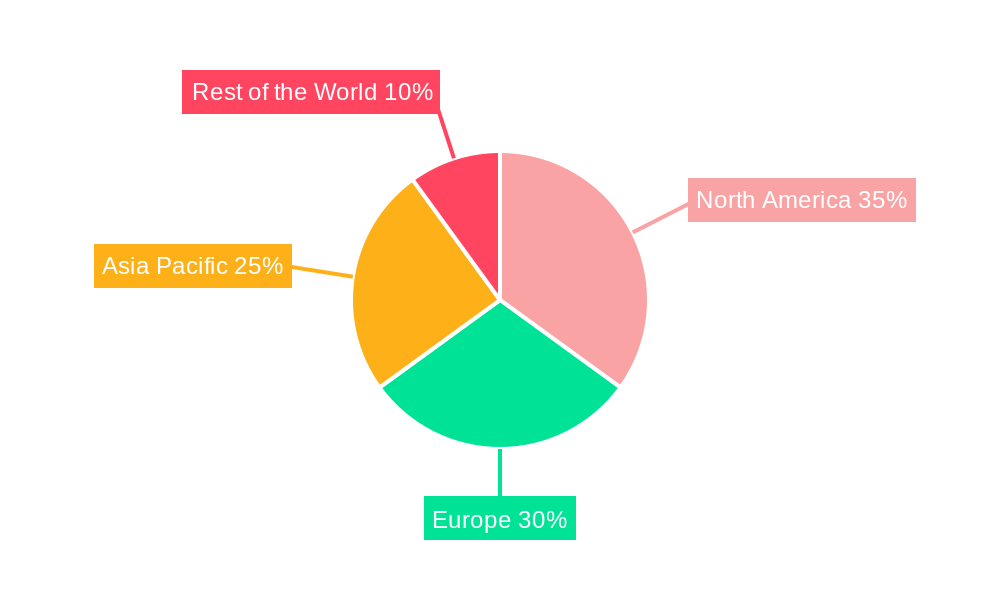
Car Rental in Tourism Industry Regional Market Share
Geographic Coverage of Car Rental in Tourism Industry
Car Rental in Tourism Industry REPORT HIGHLIGHTS
| Aspects | Details |
|---|---|
| Study Period | 2020-2034 |
| Base Year | 2025 |
| Estimated Year | 2026 |
| Forecast Period | 2026-2034 |
| Historical Period | 2020-2025 |
| Growth Rate | CAGR of 9.77% from 2020-2034 |
| Segmentation |
|
Table of Contents
- 1. Introduction
- 1.1. Research Scope
- 1.2. Market Segmentation
- 1.3. Research Objective
- 1.4. Definitions and Assumptions
- 2. Executive Summary
- 2.1. Market Snapshot
- 3. Market Dynamics
- 3.1. Market Drivers
- 3.2. Market Restrains
- 3.3. Market Trends
- 3.4. Market Opportunities
- 4. Market Factor Analysis
- 4.1. Porters Five Forces
- 4.1.1. Bargaining Power of Suppliers
- 4.1.2. Bargaining Power of Buyers
- 4.1.3. Threat of New Entrants
- 4.1.4. Threat of Substitutes
- 4.1.5. Competitive Rivalry
- 4.2. PESTEL analysis
- 4.3. BCG Analysis
- 4.3.1. Stars (High Growth, High Market Share)
- 4.3.2. Cash Cows (Low Growth, High Market Share)
- 4.3.3. Question Mark (High Growth, Low Market Share)
- 4.3.4. Dogs (Low Growth, Low Market Share)
- 4.4. Ansoff Matrix Analysis
- 4.5. Supply Chain Analysis
- 4.6. Regulatory Landscape
- 4.7. Current Market Potential and Opportunity Assessment (TAM–SAM–SOM Framework)
- 4.8. RAX Analyst Note
- 4.1. Porters Five Forces
- 5. Market Analysis, Insights and Forecast 2021-2033
- 5.1. Market Analysis, Insights and Forecast - by Vehicle Type
- 5.1.1. Economy
- 5.1.2. Luxury/Premium
- 5.2. Market Analysis, Insights and Forecast - by Booking Mode
- 5.2.1. Online
- 5.2.2. Offline
- 5.3. Market Analysis, Insights and Forecast - by End User
- 5.3.1. Self Driven
- 5.3.2. Rental Agencies
- 5.4. Market Analysis, Insights and Forecast - by Region
- 5.4.1. North America
- 5.4.2. Europe
- 5.4.3. Asia Pacific
- 5.4.4. Rest of the World
- 5.1. Market Analysis, Insights and Forecast - by Vehicle Type
- 6. Global Car Rental in Tourism Industry Analysis, Insights and Forecast, 2021-2033
- 6.1. Market Analysis, Insights and Forecast - by Vehicle Type
- 6.1.1. Economy
- 6.1.2. Luxury/Premium
- 6.2. Market Analysis, Insights and Forecast - by Booking Mode
- 6.2.1. Online
- 6.2.2. Offline
- 6.3. Market Analysis, Insights and Forecast - by End User
- 6.3.1. Self Driven
- 6.3.2. Rental Agencies
- 6.1. Market Analysis, Insights and Forecast - by Vehicle Type
- 7. North America Car Rental in Tourism Industry Analysis, Insights and Forecast, 2020-2032
- 7.1. Market Analysis, Insights and Forecast - by Vehicle Type
- 7.1.1. Economy
- 7.1.2. Luxury/Premium
- 7.2. Market Analysis, Insights and Forecast - by Booking Mode
- 7.2.1. Online
- 7.2.2. Offline
- 7.3. Market Analysis, Insights and Forecast - by End User
- 7.3.1. Self Driven
- 7.3.2. Rental Agencies
- 7.1. Market Analysis, Insights and Forecast - by Vehicle Type
- 8. Europe Car Rental in Tourism Industry Analysis, Insights and Forecast, 2020-2032
- 8.1. Market Analysis, Insights and Forecast - by Vehicle Type
- 8.1.1. Economy
- 8.1.2. Luxury/Premium
- 8.2. Market Analysis, Insights and Forecast - by Booking Mode
- 8.2.1. Online
- 8.2.2. Offline
- 8.3. Market Analysis, Insights and Forecast - by End User
- 8.3.1. Self Driven
- 8.3.2. Rental Agencies
- 8.1. Market Analysis, Insights and Forecast - by Vehicle Type
- 9. Asia Pacific Car Rental in Tourism Industry Analysis, Insights and Forecast, 2020-2032
- 9.1. Market Analysis, Insights and Forecast - by Vehicle Type
- 9.1.1. Economy
- 9.1.2. Luxury/Premium
- 9.2. Market Analysis, Insights and Forecast - by Booking Mode
- 9.2.1. Online
- 9.2.2. Offline
- 9.3. Market Analysis, Insights and Forecast - by End User
- 9.3.1. Self Driven
- 9.3.2. Rental Agencies
- 9.1. Market Analysis, Insights and Forecast - by Vehicle Type
- 10. Rest of the World Car Rental in Tourism Industry Analysis, Insights and Forecast, 2020-2032
- 10.1. Market Analysis, Insights and Forecast - by Vehicle Type
- 10.1.1. Economy
- 10.1.2. Luxury/Premium
- 10.2. Market Analysis, Insights and Forecast - by Booking Mode
- 10.2.1. Online
- 10.2.2. Offline
- 10.3. Market Analysis, Insights and Forecast - by End User
- 10.3.1. Self Driven
- 10.3.2. Rental Agencies
- 10.1. Market Analysis, Insights and Forecast - by Vehicle Type
- 11. Competitive Analysis
- 11.1. Company Profiles
- 11.1.1 The Hertz Corporation
- 11.1.1.1. Company Overview
- 11.1.1.2. Products
- 11.1.1.3. Company Financials
- 11.1.1.4. SWOT Analysis
- 11.1.2 Auto Europe Deutschland GmbH
- 11.1.2.1. Company Overview
- 11.1.2.2. Products
- 11.1.2.3. Company Financials
- 11.1.2.4. SWOT Analysis
- 11.1.3 Enterprise Holdings Inc
- 11.1.3.1. Company Overview
- 11.1.3.2. Products
- 11.1.3.3. Company Financials
- 11.1.3.4. SWOT Analysis
- 11.1.4 Seera Group Holdings Co
- 11.1.4.1. Company Overview
- 11.1.4.2. Products
- 11.1.4.3. Company Financials
- 11.1.4.4. SWOT Analysis
- 11.1.5 Carzonrent India Private Limited
- 11.1.5.1. Company Overview
- 11.1.5.2. Products
- 11.1.5.3. Company Financials
- 11.1.5.4. SWOT Analysis
- 11.1.6 Sixt SE
- 11.1.6.1. Company Overview
- 11.1.6.2. Products
- 11.1.6.3. Company Financials
- 11.1.6.4. SWOT Analysis
- 11.1.7 ZoomCar Inc
- 11.1.7.1. Company Overview
- 11.1.7.2. Products
- 11.1.7.3. Company Financials
- 11.1.7.4. SWOT Analysis
- 11.1.8 Europcar Mobility Group
- 11.1.8.1. Company Overview
- 11.1.8.2. Products
- 11.1.8.3. Company Financials
- 11.1.8.4. SWOT Analysis
- 11.1.9 Avis Budget Group Inc
- 11.1.9.1. Company Overview
- 11.1.9.2. Products
- 11.1.9.3. Company Financials
- 11.1.9.4. SWOT Analysis
- 11.1.1 The Hertz Corporation
- 11.2. Market Entropy
- 11.2.1 Company's Key Areas Served
- 11.2.2 Recent Developments
- 11.3. Company Market Share Analysis 2025
- 11.3.1 Top 5 Companies Market Share Analysis
- 11.3.2 Top 3 Companies Market Share Analysis
- 11.4. List of Potential Customers
- 12. Research Methodology
List of Figures
- Figure 1: Global Car Rental in Tourism Industry Revenue Breakdown (billion, %) by Region 2025 & 2033
- Figure 2: North America Car Rental in Tourism Industry Revenue (billion), by Vehicle Type 2025 & 2033
- Figure 3: North America Car Rental in Tourism Industry Revenue Share (%), by Vehicle Type 2025 & 2033
- Figure 4: North America Car Rental in Tourism Industry Revenue (billion), by Booking Mode 2025 & 2033
- Figure 5: North America Car Rental in Tourism Industry Revenue Share (%), by Booking Mode 2025 & 2033
- Figure 6: North America Car Rental in Tourism Industry Revenue (billion), by End User 2025 & 2033
- Figure 7: North America Car Rental in Tourism Industry Revenue Share (%), by End User 2025 & 2033
- Figure 8: North America Car Rental in Tourism Industry Revenue (billion), by Country 2025 & 2033
- Figure 9: North America Car Rental in Tourism Industry Revenue Share (%), by Country 2025 & 2033
- Figure 10: Europe Car Rental in Tourism Industry Revenue (billion), by Vehicle Type 2025 & 2033
- Figure 11: Europe Car Rental in Tourism Industry Revenue Share (%), by Vehicle Type 2025 & 2033
- Figure 12: Europe Car Rental in Tourism Industry Revenue (billion), by Booking Mode 2025 & 2033
- Figure 13: Europe Car Rental in Tourism Industry Revenue Share (%), by Booking Mode 2025 & 2033
- Figure 14: Europe Car Rental in Tourism Industry Revenue (billion), by End User 2025 & 2033
- Figure 15: Europe Car Rental in Tourism Industry Revenue Share (%), by End User 2025 & 2033
- Figure 16: Europe Car Rental in Tourism Industry Revenue (billion), by Country 2025 & 2033
- Figure 17: Europe Car Rental in Tourism Industry Revenue Share (%), by Country 2025 & 2033
- Figure 18: Asia Pacific Car Rental in Tourism Industry Revenue (billion), by Vehicle Type 2025 & 2033
- Figure 19: Asia Pacific Car Rental in Tourism Industry Revenue Share (%), by Vehicle Type 2025 & 2033
- Figure 20: Asia Pacific Car Rental in Tourism Industry Revenue (billion), by Booking Mode 2025 & 2033
- Figure 21: Asia Pacific Car Rental in Tourism Industry Revenue Share (%), by Booking Mode 2025 & 2033
- Figure 22: Asia Pacific Car Rental in Tourism Industry Revenue (billion), by End User 2025 & 2033
- Figure 23: Asia Pacific Car Rental in Tourism Industry Revenue Share (%), by End User 2025 & 2033
- Figure 24: Asia Pacific Car Rental in Tourism Industry Revenue (billion), by Country 2025 & 2033
- Figure 25: Asia Pacific Car Rental in Tourism Industry Revenue Share (%), by Country 2025 & 2033
- Figure 26: Rest of the World Car Rental in Tourism Industry Revenue (billion), by Vehicle Type 2025 & 2033
- Figure 27: Rest of the World Car Rental in Tourism Industry Revenue Share (%), by Vehicle Type 2025 & 2033
- Figure 28: Rest of the World Car Rental in Tourism Industry Revenue (billion), by Booking Mode 2025 & 2033
- Figure 29: Rest of the World Car Rental in Tourism Industry Revenue Share (%), by Booking Mode 2025 & 2033
- Figure 30: Rest of the World Car Rental in Tourism Industry Revenue (billion), by End User 2025 & 2033
- Figure 31: Rest of the World Car Rental in Tourism Industry Revenue Share (%), by End User 2025 & 2033
- Figure 32: Rest of the World Car Rental in Tourism Industry Revenue (billion), by Country 2025 & 2033
- Figure 33: Rest of the World Car Rental in Tourism Industry Revenue Share (%), by Country 2025 & 2033
List of Tables
- Table 1: Global Car Rental in Tourism Industry Revenue billion Forecast, by Vehicle Type 2020 & 2033
- Table 2: Global Car Rental in Tourism Industry Revenue billion Forecast, by Booking Mode 2020 & 2033
- Table 3: Global Car Rental in Tourism Industry Revenue billion Forecast, by End User 2020 & 2033
- Table 4: Global Car Rental in Tourism Industry Revenue billion Forecast, by Region 2020 & 2033
- Table 5: Global Car Rental in Tourism Industry Revenue billion Forecast, by Vehicle Type 2020 & 2033
- Table 6: Global Car Rental in Tourism Industry Revenue billion Forecast, by Booking Mode 2020 & 2033
- Table 7: Global Car Rental in Tourism Industry Revenue billion Forecast, by End User 2020 & 2033
- Table 8: Global Car Rental in Tourism Industry Revenue billion Forecast, by Country 2020 & 2033
- Table 9: United states Car Rental in Tourism Industry Revenue (billion) Forecast, by Application 2020 & 2033
- Table 10: Canada Car Rental in Tourism Industry Revenue (billion) Forecast, by Application 2020 & 2033
- Table 11: Rest of North america Car Rental in Tourism Industry Revenue (billion) Forecast, by Application 2020 & 2033
- Table 12: Global Car Rental in Tourism Industry Revenue billion Forecast, by Vehicle Type 2020 & 2033
- Table 13: Global Car Rental in Tourism Industry Revenue billion Forecast, by Booking Mode 2020 & 2033
- Table 14: Global Car Rental in Tourism Industry Revenue billion Forecast, by End User 2020 & 2033
- Table 15: Global Car Rental in Tourism Industry Revenue billion Forecast, by Country 2020 & 2033
- Table 16: Germany Car Rental in Tourism Industry Revenue (billion) Forecast, by Application 2020 & 2033
- Table 17: United Kingdom Car Rental in Tourism Industry Revenue (billion) Forecast, by Application 2020 & 2033
- Table 18: France Car Rental in Tourism Industry Revenue (billion) Forecast, by Application 2020 & 2033
- Table 19: Italy Car Rental in Tourism Industry Revenue (billion) Forecast, by Application 2020 & 2033
- Table 20: Norway Car Rental in Tourism Industry Revenue (billion) Forecast, by Application 2020 & 2033
- Table 21: Netherlands Car Rental in Tourism Industry Revenue (billion) Forecast, by Application 2020 & 2033
- Table 22: Rest of Europe Car Rental in Tourism Industry Revenue (billion) Forecast, by Application 2020 & 2033
- Table 23: Global Car Rental in Tourism Industry Revenue billion Forecast, by Vehicle Type 2020 & 2033
- Table 24: Global Car Rental in Tourism Industry Revenue billion Forecast, by Booking Mode 2020 & 2033
- Table 25: Global Car Rental in Tourism Industry Revenue billion Forecast, by End User 2020 & 2033
- Table 26: Global Car Rental in Tourism Industry Revenue billion Forecast, by Country 2020 & 2033
- Table 27: China Car Rental in Tourism Industry Revenue (billion) Forecast, by Application 2020 & 2033
- Table 28: India Car Rental in Tourism Industry Revenue (billion) Forecast, by Application 2020 & 2033
- Table 29: Japan Car Rental in Tourism Industry Revenue (billion) Forecast, by Application 2020 & 2033
- Table 30: South Korea Car Rental in Tourism Industry Revenue (billion) Forecast, by Application 2020 & 2033
- Table 31: Rest of Asia Pacific Car Rental in Tourism Industry Revenue (billion) Forecast, by Application 2020 & 2033
- Table 32: Global Car Rental in Tourism Industry Revenue billion Forecast, by Vehicle Type 2020 & 2033
- Table 33: Global Car Rental in Tourism Industry Revenue billion Forecast, by Booking Mode 2020 & 2033
- Table 34: Global Car Rental in Tourism Industry Revenue billion Forecast, by End User 2020 & 2033
- Table 35: Global Car Rental in Tourism Industry Revenue billion Forecast, by Country 2020 & 2033
- Table 36: South America Car Rental in Tourism Industry Revenue (billion) Forecast, by Application 2020 & 2033
- Table 37: Middle East and Africa Car Rental in Tourism Industry Revenue (billion) Forecast, by Application 2020 & 2033
Frequently Asked Questions
1. What is the projected Compound Annual Growth Rate (CAGR) of the Car Rental in Tourism Industry?
The projected CAGR is approximately 9.77%.
2. Which companies are prominent players in the Car Rental in Tourism Industry?
Key companies in the market include The Hertz Corporation, Auto Europe Deutschland GmbH, Enterprise Holdings Inc, Seera Group Holdings Co, Carzonrent India Private Limited, Sixt SE, ZoomCar Inc, Europcar Mobility Group, Avis Budget Group Inc.
3. What are the main segments of the Car Rental in Tourism Industry?
The market segments include Vehicle Type, Booking Mode, End User.
4. Can you provide details about the market size?
The market size is estimated to be USD 129.66 billion as of 2022.
5. What are some drivers contributing to market growth?
Growing Use of Aluminum in Die Casting Equipment to Increase Market Demand.
6. What are the notable trends driving market growth?
Online Booking Expected to Witness Significant Growth during the Forecast Period.
7. Are there any restraints impacting market growth?
Fluctuations in Raw Material Prices.
8. Can you provide examples of recent developments in the market?
In January 2022, ekar, the Middle East's mobility company, launched its operations in Thailand starting with Bangkok and with plans to expand into other countries. ekar is launching its proprietary car subscription service which offers cars from one to nine-month terms for a single monthly subscription cost with no down payments or long-term commitments via the ekar app.
9. What pricing options are available for accessing the report?
Pricing options include single-user, multi-user, and enterprise licenses priced at USD 4750, USD 5250, and USD 8750 respectively.
10. Is the market size provided in terms of value or volume?
The market size is provided in terms of value, measured in billion.
11. Are there any specific market keywords associated with the report?
Yes, the market keyword associated with the report is "Car Rental in Tourism Industry," which aids in identifying and referencing the specific market segment covered.
12. How do I determine which pricing option suits my needs best?
The pricing options vary based on user requirements and access needs. Individual users may opt for single-user licenses, while businesses requiring broader access may choose multi-user or enterprise licenses for cost-effective access to the report.
13. Are there any additional resources or data provided in the Car Rental in Tourism Industry report?
While the report offers comprehensive insights, it's advisable to review the specific contents or supplementary materials provided to ascertain if additional resources or data are available.
14. How can I stay updated on further developments or reports in the Car Rental in Tourism Industry?
To stay informed about further developments, trends, and reports in the Car Rental in Tourism Industry, consider subscribing to industry newsletters, following relevant companies and organizations, or regularly checking reputable industry news sources and publications.
Methodology
Step 1 - Identification of Relevant Samples Size from Population Database


Step 2 - Approaches for Defining Global Market Size (Value, Volume* & Price*)

Note*: In applicable scenarios
Step 3 - Data Sources
Primary Research
- Web Analytics
- Survey Reports
- Research Institute
- Latest Research Reports
- Opinion Leaders
Secondary Research
- Annual Reports
- White Paper
- Latest Press Release
- Industry Association
- Paid Database
- Investor Presentations

Step 4 - Data Triangulation
Involves using different sources of information in order to increase the validity of a study
These sources are likely to be stakeholders in a program - participants, other researchers, program staff, other community members, and so on.
Then we put all data in single framework & apply various statistical tools to find out the dynamic on the market.
During the analysis stage, feedback from the stakeholder groups would be compared to determine areas of agreement as well as areas of divergence