Key Insights
The global cell culture market is experiencing substantial growth, propelled by escalating demand for biopharmaceuticals, advancements in gene and regenerative therapies, and the rising incidence of chronic diseases. With a projected compound annual growth rate (CAGR) of 12.94%, the market is anticipated to reach 19.13 billion by 2025. Key growth catalysts include increased R&D investments in the pharmaceutical and biotechnology sectors, alongside the broader adoption of cell-based assays and screening technologies in drug discovery. The market is segmented by product type (products and consumables) and application (biopharmaceuticals, drug development, gene therapy, tissue culture, vaccine production). The biopharmaceuticals segment leads, driven by the demand for biologics and complex drug development requiring advanced cell culture. Consumables, such as media, sera, and reagents, form a significant market segment due to their consistent necessity. Geographically, North America and Europe lead due to established research institutions and regulatory frameworks. However, the Asia-Pacific region is poised for the fastest growth, fueled by expanding biotech infrastructure and demand for accessible healthcare.
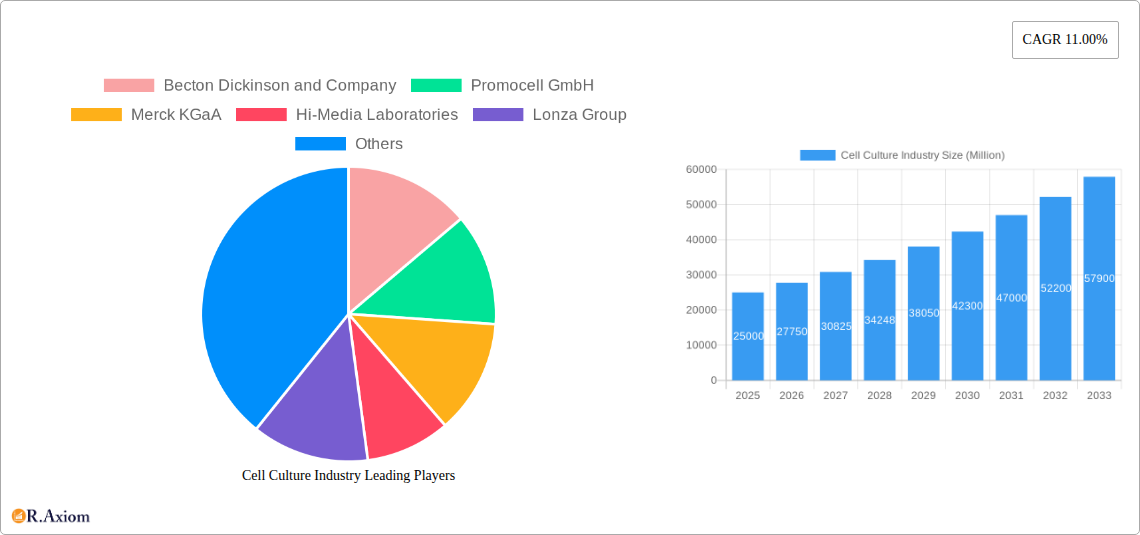
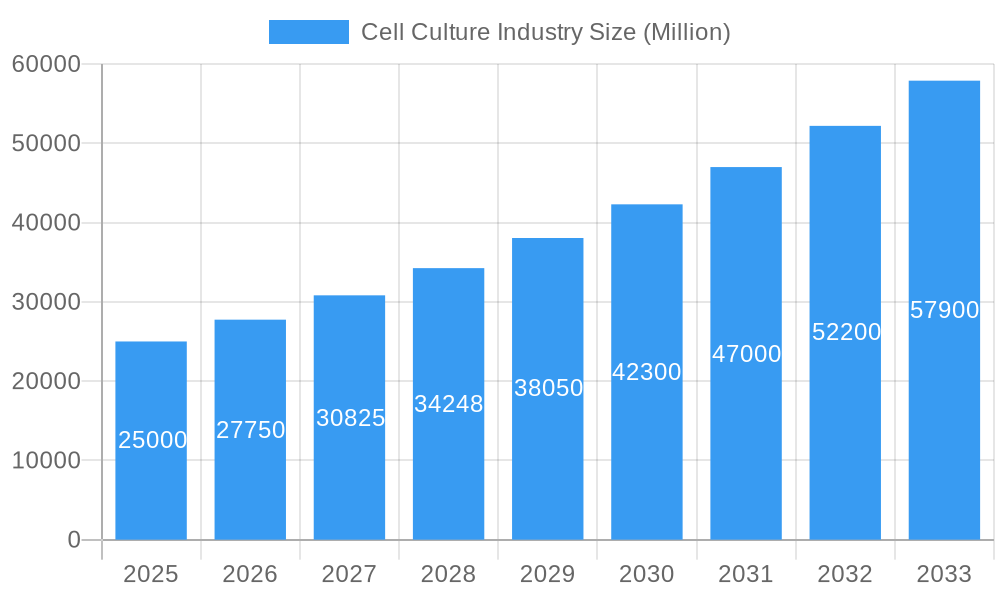
Cell Culture Industry Market Size (In Billion)
The cell culture market is highly competitive, with leading companies like Becton Dickinson, Merck KGaA, Lonza Group, and Thermo Fisher Scientific driving innovation through strategic partnerships and acquisitions. This dynamic landscape features both established players and emerging biotech firms. While the market outlook is positive, challenges include high equipment and reagent costs, stringent regulations, and the need for skilled professionals. To address these, companies are prioritizing automated, cost-effective cell culture technologies, user-friendly systems, and global expansion via collaborations. Continued advancements in cell culture techniques, alongside research in personalized medicine and stem cell therapy, will ensure the sustained expansion of this critical market segment.
Cell Culture Industry Company Market Share
Cell Culture Industry Market Report: 2019-2033
This comprehensive report provides an in-depth analysis of the global cell culture industry, offering valuable insights for stakeholders including manufacturers, researchers, investors, and regulatory bodies. The study period spans from 2019 to 2033, with 2025 serving as both the base and estimated year. The report meticulously analyzes market trends, growth drivers, challenges, and opportunities, forecasting market size and growth from 2025 to 2033. Key industry players like Becton Dickinson and Company, Promocell GmbH, Merck KGaA, Hi-Media Laboratories, Lonza Group, Cytiva, Sartorius AG, Danaher Corporation, Corning Incorporated, Sekisui XenoTech LLC, Agilent Technologies Inc, Thermo Fisher Scientific, and Biospherix are profiled, offering a comprehensive understanding of the competitive landscape. The report segments the market by product and consumables (products and others), and by application (biopharmaceuticals, drug development, gene therapy, tissue culture and engineering, vaccine production, and other applications).
Cell Culture Industry Market Concentration & Innovation
The cell culture industry exhibits a moderately concentrated market structure, with a few large multinational companies holding significant market share. While exact figures are proprietary, estimates suggest that the top 10 companies control approximately xx% of the global market in 2025. This concentration is driven by substantial investments in R&D, strong intellectual property portfolios, and established global distribution networks. Innovation within the sector is rapid, fueled by advancements in cell line engineering, bioreactor technology, and automation. Regulatory frameworks, particularly those concerning GMP compliance and biosecurity, significantly influence market dynamics. Product substitutes are limited, mostly confined to alternative cell-based assays or non-cell-based approaches for specific applications. End-user trends favor automation, personalized medicine, and increased throughput, driving demand for sophisticated equipment and services. Mergers and acquisitions (M&A) are frequent, with deal values in the past five years exceeding xx Million, reflecting the industry’s consolidation and strategic growth ambitions.
- Market Share: Top 10 companies hold approximately xx% of the market (2025 estimate).
- M&A Activity: Deal values exceeding xx Million in the last 5 years.
- Innovation Drivers: Advancements in cell line engineering, bioreactor technology, and automation.
Cell Culture Industry Industry Trends & Insights
The cell culture industry is experiencing robust growth, driven by factors such as the expanding biopharmaceutical market, rising demand for advanced therapies (gene therapy and cell therapy), and increasing adoption of cell-based assays in drug discovery and development. The market is projected to grow at a CAGR of xx% from 2025 to 2033, reaching a market value of xx Million by 2033. Technological disruptions, including the emergence of continuous cell culture technologies and improved bioreactor designs, are enhancing productivity and reducing production costs. Consumer preferences are shifting towards automation, scalability, and ease of use, leading to a strong demand for integrated solutions and customized services. Intense competition among established players and emerging start-ups shapes the market landscape. Market penetration of advanced technologies like single-use bioreactors and automated cell culture systems is increasing steadily.
Dominant Markets & Segments in Cell Culture Industry
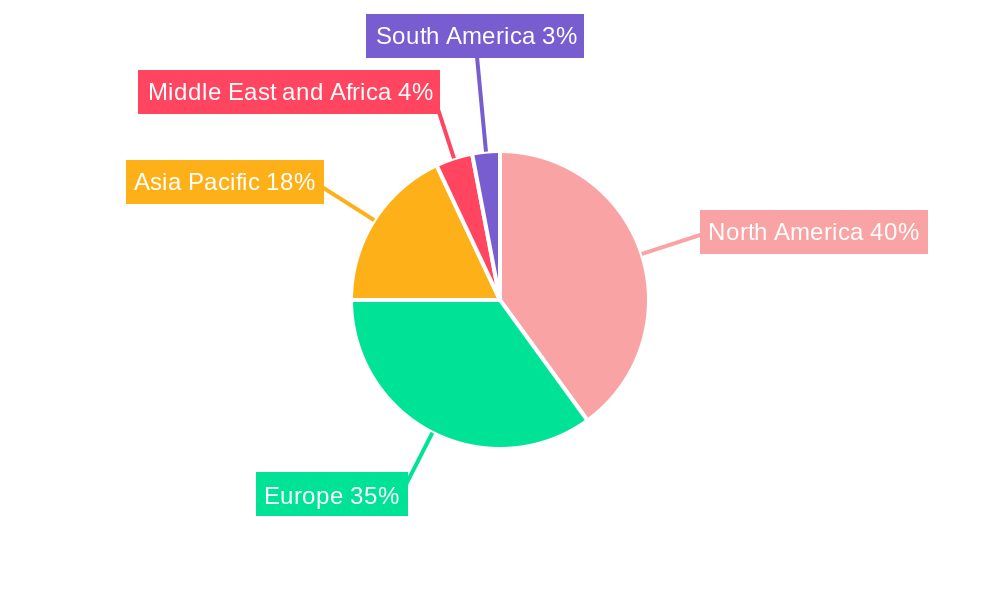
North America currently holds the largest market share in the cell culture industry, driven by robust R&D spending, a well-established biopharmaceutical industry, and supportive regulatory frameworks. Within this region, the United States is the dominant market. Europe follows closely, benefiting from a strong presence of pharmaceutical companies and significant investments in life sciences research.
Key Drivers (North America):
- Strong R&D investments.
- Well-established biopharmaceutical industry.
- Supportive regulatory frameworks.
By Product and Consumables: The "Products" segment dominates the market, driven by high demand for sophisticated bioreactors, cell culture media, and other critical equipment. The "Others" segment, encompassing consumables and reagents, represents a significant and growing segment.
By Application: The biopharmaceuticals sector accounts for the largest share of the market due to the extensive use of cell culture technologies in the production of monoclonal antibodies and recombinant proteins. The growth of gene therapy and cell therapy is further bolstering demand for specialized cell culture solutions.
Cell Culture Industry Product Developments
Recent product innovations focus on enhancing cell culture efficiency, scalability, and automation. Advances in bioreactor design, media formulations, and automated systems are key areas of development. Companies are also developing customized solutions to meet the specific needs of different cell types and applications. These advancements are creating a more efficient and cost-effective cell culture process, improving the viability of cell-based therapies and driving market growth. The competitive advantage lies in developing superior performance, improved ease of use, and cost-effectiveness of products while ensuring robust regulatory compliance.
Report Scope & Segmentation Analysis
This report segments the cell culture market by product and consumables (Products and Others) and by application (Biopharmaceuticals, Drug Development, Gene Therapy, Tissue Culture and Engineering, Vaccine Production, and Other Applications).
By Product and Consumables: The "Products" segment is projected to exhibit significant growth, driven by increasing demand for advanced bioreactors and automation solutions. The "Others" segment shows substantial growth potential due to the continuous need for consumables and reagents in cell culture processes.
By Application: The Biopharmaceuticals segment holds the dominant market share, while the Gene Therapy and Cell Therapy segments are experiencing rapid growth driven by high market demand and substantial research investments. Each segment demonstrates unique competitive dynamics influenced by technological advancements, regulatory landscape, and specific end-user requirements. Market size projections for each segment, along with growth rate predictions, are included in the full report.
Key Drivers of Cell Culture Industry Growth
The cell culture industry is propelled by several key drivers. The rise of biopharmaceuticals and advanced therapies, particularly cell and gene therapies, is a primary driver. Technological advancements, such as the development of automated systems and improved cell culture media, further enhance productivity and efficiency. Favorable regulatory frameworks and government funding for biomedical research create a positive market environment. Increasing research and development activities across diverse areas fuel demand for cell culture technologies. The expansion of contract research organizations (CROs) adds to the industry's growth trajectory.
Challenges in the Cell Culture Industry Sector
The cell culture industry faces several challenges, including stringent regulatory requirements, which increase the cost and complexity of product development and approval. Supply chain disruptions can significantly impact the availability of critical raw materials and consumables. Intense competition among established players and new entrants can create pricing pressures and affect profitability. Maintaining consistent cell culture quality, mitigating the risk of contamination, and ensuring reproducibility are ongoing challenges. These factors can influence the overall growth trajectory of the industry, necessitating innovative and effective solutions.
Emerging Opportunities in Cell Culture Industry
Emerging opportunities within the cell culture industry are abundant. The expansion of personalized medicine and the growing demand for advanced therapeutic modalities, such as CAR T-cell therapy, present significant growth opportunities. The development of innovative bioreactor technologies, such as perfusion and continuous cell culture systems, promises improved efficiency and reduced costs. The use of artificial intelligence (AI) and machine learning (ML) is rapidly growing, paving the way for automated cell culture optimization and process control. These trends are transforming the cell culture industry, opening up new avenues for growth and innovation.
Leading Players in the Cell Culture Industry Market
Key Developments in Cell Culture Industry Industry
- June 2022: Evonik launched the cQrex portfolio of cell culture ingredients to increase efficiency and productivity in bioprocesses for producing monoclonal antibodies, vaccines, viral vectors, and therapeutic cells.
- February 2022: CellulaREvolution raised GBP 1.75 Million to accelerate the launch of its continuous cell culture technology.
Strategic Outlook for Cell Culture Industry Market
The cell culture industry is poised for sustained growth, fueled by continuous technological advancements, expanding applications in biopharmaceuticals and advanced therapies, and increasing global investments in life sciences research. The ongoing development of novel cell lines, sophisticated bioreactors, and automated systems will further drive market expansion. The emergence of new therapeutic modalities, such as cell and gene therapies, and personalized medicine will create significant opportunities. Companies focused on innovation, efficiency, and regulatory compliance are expected to maintain a competitive edge in this dynamic and rapidly evolving market.
Cell Culture Industry Segmentation
-
1. Product and Consumables
- 1.1. Biosafety Equipment
- 1.2. Centrifuges
- 1.3. Cryostorage Equipment
- 1.4. Culture Systems/Bioreactors
- 1.5. Incubators
- 1.6. Pipetting Instruments
- 1.7. Others
- 1.8. Media
- 1.9. Sera
- 1.10. Reagents
-
2. Application
- 2.1. Biopharmaceuticals
- 2.2. Drug Development
- 2.3. Gene Therapy
- 2.4. Tissue Culture and Engineering
- 2.5. Vaccine Production
- 2.6. Other Applications
Cell Culture Industry Segmentation By Geography
-
1. North America
- 1.1. United States
- 1.2. Canada
- 1.3. Mexico
-
2. Europe
- 2.1. Germany
- 2.2. United Kingdom
- 2.3. France
- 2.4. Italy
- 2.5. Spain
- 2.6. Rest of Europe
-
3. Asia Pacific
- 3.1. China
- 3.2. Japan
- 3.3. India
- 3.4. Australia
- 3.5. South Korea
- 3.6. Rest of Asia Pacific
-
4. Middle East and Africa
- 4.1. GCC
- 4.2. South Africa
- 4.3. Rest of Middle East and Africa
-
5. South America
- 5.1. Brazil
- 5.2. Argentina
- 5.3. Rest of South America
Cell Culture Industry Regional Market Share
Geographic Coverage of Cell Culture Industry
Cell Culture Industry REPORT HIGHLIGHTS
| Aspects | Details |
|---|---|
| Study Period | 2020-2034 |
| Base Year | 2025 |
| Estimated Year | 2026 |
| Forecast Period | 2026-2034 |
| Historical Period | 2020-2025 |
| Growth Rate | CAGR of 12.94% from 2020-2034 |
| Segmentation |
|
Table of Contents
- 1. Introduction
- 1.1. Research Scope
- 1.2. Market Segmentation
- 1.3. Research Objective
- 1.4. Definitions and Assumptions
- 2. Executive Summary
- 2.1. Market Snapshot
- 3. Market Dynamics
- 3.1. Market Drivers
- 3.2. Market Restrains
- 3.3. Market Trends
- 3.4. Market Opportunities
- 4. Market Factor Analysis
- 4.1. Porters Five Forces
- 4.1.1. Bargaining Power of Suppliers
- 4.1.2. Bargaining Power of Buyers
- 4.1.3. Threat of New Entrants
- 4.1.4. Threat of Substitutes
- 4.1.5. Competitive Rivalry
- 4.2. PESTEL analysis
- 4.3. BCG Analysis
- 4.3.1. Stars (High Growth, High Market Share)
- 4.3.2. Cash Cows (Low Growth, High Market Share)
- 4.3.3. Question Mark (High Growth, Low Market Share)
- 4.3.4. Dogs (Low Growth, Low Market Share)
- 4.4. Ansoff Matrix Analysis
- 4.5. Supply Chain Analysis
- 4.6. Regulatory Landscape
- 4.7. Current Market Potential and Opportunity Assessment (TAM–SAM–SOM Framework)
- 4.8. RAX Analyst Note
- 4.1. Porters Five Forces
- 5. Market Analysis, Insights and Forecast 2021-2033
- 5.1. Market Analysis, Insights and Forecast - by Product and Consumables
- 5.1.1. Biosafety Equipment
- 5.1.2. Centrifuges
- 5.1.3. Cryostorage Equipment
- 5.1.4. Culture Systems/Bioreactors
- 5.1.5. Incubators
- 5.1.6. Pipetting Instruments
- 5.1.7. Others
- 5.1.8. Media
- 5.1.9. Sera
- 5.1.10. Reagents
- 5.2. Market Analysis, Insights and Forecast - by Application
- 5.2.1. Biopharmaceuticals
- 5.2.2. Drug Development
- 5.2.3. Gene Therapy
- 5.2.4. Tissue Culture and Engineering
- 5.2.5. Vaccine Production
- 5.2.6. Other Applications
- 5.3. Market Analysis, Insights and Forecast - by Region
- 5.3.1. North America
- 5.3.2. Europe
- 5.3.3. Asia Pacific
- 5.3.4. Middle East and Africa
- 5.3.5. South America
- 5.1. Market Analysis, Insights and Forecast - by Product and Consumables
- 6. Global Cell Culture Industry Analysis, Insights and Forecast, 2021-2033
- 6.1. Market Analysis, Insights and Forecast - by Product and Consumables
- 6.1.1. Biosafety Equipment
- 6.1.2. Centrifuges
- 6.1.3. Cryostorage Equipment
- 6.1.4. Culture Systems/Bioreactors
- 6.1.5. Incubators
- 6.1.6. Pipetting Instruments
- 6.1.7. Others
- 6.1.8. Media
- 6.1.9. Sera
- 6.1.10. Reagents
- 6.2. Market Analysis, Insights and Forecast - by Application
- 6.2.1. Biopharmaceuticals
- 6.2.2. Drug Development
- 6.2.3. Gene Therapy
- 6.2.4. Tissue Culture and Engineering
- 6.2.5. Vaccine Production
- 6.2.6. Other Applications
- 6.1. Market Analysis, Insights and Forecast - by Product and Consumables
- 7. North America Cell Culture Industry Analysis, Insights and Forecast, 2020-2032
- 7.1. Market Analysis, Insights and Forecast - by Product and Consumables
- 7.1.1. Biosafety Equipment
- 7.1.2. Centrifuges
- 7.1.3. Cryostorage Equipment
- 7.1.4. Culture Systems/Bioreactors
- 7.1.5. Incubators
- 7.1.6. Pipetting Instruments
- 7.1.7. Others
- 7.1.8. Media
- 7.1.9. Sera
- 7.1.10. Reagents
- 7.2. Market Analysis, Insights and Forecast - by Application
- 7.2.1. Biopharmaceuticals
- 7.2.2. Drug Development
- 7.2.3. Gene Therapy
- 7.2.4. Tissue Culture and Engineering
- 7.2.5. Vaccine Production
- 7.2.6. Other Applications
- 7.1. Market Analysis, Insights and Forecast - by Product and Consumables
- 8. Europe Cell Culture Industry Analysis, Insights and Forecast, 2020-2032
- 8.1. Market Analysis, Insights and Forecast - by Product and Consumables
- 8.1.1. Biosafety Equipment
- 8.1.2. Centrifuges
- 8.1.3. Cryostorage Equipment
- 8.1.4. Culture Systems/Bioreactors
- 8.1.5. Incubators
- 8.1.6. Pipetting Instruments
- 8.1.7. Others
- 8.1.8. Media
- 8.1.9. Sera
- 8.1.10. Reagents
- 8.2. Market Analysis, Insights and Forecast - by Application
- 8.2.1. Biopharmaceuticals
- 8.2.2. Drug Development
- 8.2.3. Gene Therapy
- 8.2.4. Tissue Culture and Engineering
- 8.2.5. Vaccine Production
- 8.2.6. Other Applications
- 8.1. Market Analysis, Insights and Forecast - by Product and Consumables
- 9. Asia Pacific Cell Culture Industry Analysis, Insights and Forecast, 2020-2032
- 9.1. Market Analysis, Insights and Forecast - by Product and Consumables
- 9.1.1. Biosafety Equipment
- 9.1.2. Centrifuges
- 9.1.3. Cryostorage Equipment
- 9.1.4. Culture Systems/Bioreactors
- 9.1.5. Incubators
- 9.1.6. Pipetting Instruments
- 9.1.7. Others
- 9.1.8. Media
- 9.1.9. Sera
- 9.1.10. Reagents
- 9.2. Market Analysis, Insights and Forecast - by Application
- 9.2.1. Biopharmaceuticals
- 9.2.2. Drug Development
- 9.2.3. Gene Therapy
- 9.2.4. Tissue Culture and Engineering
- 9.2.5. Vaccine Production
- 9.2.6. Other Applications
- 9.1. Market Analysis, Insights and Forecast - by Product and Consumables
- 10. Middle East and Africa Cell Culture Industry Analysis, Insights and Forecast, 2020-2032
- 10.1. Market Analysis, Insights and Forecast - by Product and Consumables
- 10.1.1. Biosafety Equipment
- 10.1.2. Centrifuges
- 10.1.3. Cryostorage Equipment
- 10.1.4. Culture Systems/Bioreactors
- 10.1.5. Incubators
- 10.1.6. Pipetting Instruments
- 10.1.7. Others
- 10.1.8. Media
- 10.1.9. Sera
- 10.1.10. Reagents
- 10.2. Market Analysis, Insights and Forecast - by Application
- 10.2.1. Biopharmaceuticals
- 10.2.2. Drug Development
- 10.2.3. Gene Therapy
- 10.2.4. Tissue Culture and Engineering
- 10.2.5. Vaccine Production
- 10.2.6. Other Applications
- 10.1. Market Analysis, Insights and Forecast - by Product and Consumables
- 11. South America Cell Culture Industry Analysis, Insights and Forecast, 2020-2032
- 11.1. Market Analysis, Insights and Forecast - by Product and Consumables
- 11.1.1. Biosafety Equipment
- 11.1.2. Centrifuges
- 11.1.3. Cryostorage Equipment
- 11.1.4. Culture Systems/Bioreactors
- 11.1.5. Incubators
- 11.1.6. Pipetting Instruments
- 11.1.7. Others
- 11.1.8. Media
- 11.1.9. Sera
- 11.1.10. Reagents
- 11.2. Market Analysis, Insights and Forecast - by Application
- 11.2.1. Biopharmaceuticals
- 11.2.2. Drug Development
- 11.2.3. Gene Therapy
- 11.2.4. Tissue Culture and Engineering
- 11.2.5. Vaccine Production
- 11.2.6. Other Applications
- 11.1. Market Analysis, Insights and Forecast - by Product and Consumables
- 12. Competitive Analysis
- 12.1. Company Profiles
- 12.1.1 Becton Dickinson and Company
- 12.1.1.1. Company Overview
- 12.1.1.2. Products
- 12.1.1.3. Company Financials
- 12.1.1.4. SWOT Analysis
- 12.1.2 Promocell GmbH
- 12.1.2.1. Company Overview
- 12.1.2.2. Products
- 12.1.2.3. Company Financials
- 12.1.2.4. SWOT Analysis
- 12.1.3 Merck KGaA
- 12.1.3.1. Company Overview
- 12.1.3.2. Products
- 12.1.3.3. Company Financials
- 12.1.3.4. SWOT Analysis
- 12.1.4 Hi-Media Laboratories
- 12.1.4.1. Company Overview
- 12.1.4.2. Products
- 12.1.4.3. Company Financials
- 12.1.4.4. SWOT Analysis
- 12.1.5 Lonza Group
- 12.1.5.1. Company Overview
- 12.1.5.2. Products
- 12.1.5.3. Company Financials
- 12.1.5.4. SWOT Analysis
- 12.1.6 Cytiva
- 12.1.6.1. Company Overview
- 12.1.6.2. Products
- 12.1.6.3. Company Financials
- 12.1.6.4. SWOT Analysis
- 12.1.7 Sartorius AG
- 12.1.7.1. Company Overview
- 12.1.7.2. Products
- 12.1.7.3. Company Financials
- 12.1.7.4. SWOT Analysis
- 12.1.8 Danaher Corporation
- 12.1.8.1. Company Overview
- 12.1.8.2. Products
- 12.1.8.3. Company Financials
- 12.1.8.4. SWOT Analysis
- 12.1.9 Corning Incorporated*List Not Exhaustive
- 12.1.9.1. Company Overview
- 12.1.9.2. Products
- 12.1.9.3. Company Financials
- 12.1.9.4. SWOT Analysis
- 12.1.10 Sekisui XenoTech LLC
- 12.1.10.1. Company Overview
- 12.1.10.2. Products
- 12.1.10.3. Company Financials
- 12.1.10.4. SWOT Analysis
- 12.1.11 Agilent Technologies Inc
- 12.1.11.1. Company Overview
- 12.1.11.2. Products
- 12.1.11.3. Company Financials
- 12.1.11.4. SWOT Analysis
- 12.1.12 Thermo Fisher Scientific
- 12.1.12.1. Company Overview
- 12.1.12.2. Products
- 12.1.12.3. Company Financials
- 12.1.12.4. SWOT Analysis
- 12.1.13 Biospherix
- 12.1.13.1. Company Overview
- 12.1.13.2. Products
- 12.1.13.3. Company Financials
- 12.1.13.4. SWOT Analysis
- 12.1.1 Becton Dickinson and Company
- 12.2. Market Entropy
- 12.2.1 Company's Key Areas Served
- 12.2.2 Recent Developments
- 12.3. Company Market Share Analysis 2025
- 12.3.1 Top 5 Companies Market Share Analysis
- 12.3.2 Top 3 Companies Market Share Analysis
- 12.4. List of Potential Customers
- 13. Research Methodology
List of Figures
- Figure 1: Global Cell Culture Industry Revenue Breakdown (billion, %) by Region 2025 & 2033
- Figure 2: North America Cell Culture Industry Revenue (billion), by Product and Consumables 2025 & 2033
- Figure 3: North America Cell Culture Industry Revenue Share (%), by Product and Consumables 2025 & 2033
- Figure 4: North America Cell Culture Industry Revenue (billion), by Application 2025 & 2033
- Figure 5: North America Cell Culture Industry Revenue Share (%), by Application 2025 & 2033
- Figure 6: North America Cell Culture Industry Revenue (billion), by Country 2025 & 2033
- Figure 7: North America Cell Culture Industry Revenue Share (%), by Country 2025 & 2033
- Figure 8: Europe Cell Culture Industry Revenue (billion), by Product and Consumables 2025 & 2033
- Figure 9: Europe Cell Culture Industry Revenue Share (%), by Product and Consumables 2025 & 2033
- Figure 10: Europe Cell Culture Industry Revenue (billion), by Application 2025 & 2033
- Figure 11: Europe Cell Culture Industry Revenue Share (%), by Application 2025 & 2033
- Figure 12: Europe Cell Culture Industry Revenue (billion), by Country 2025 & 2033
- Figure 13: Europe Cell Culture Industry Revenue Share (%), by Country 2025 & 2033
- Figure 14: Asia Pacific Cell Culture Industry Revenue (billion), by Product and Consumables 2025 & 2033
- Figure 15: Asia Pacific Cell Culture Industry Revenue Share (%), by Product and Consumables 2025 & 2033
- Figure 16: Asia Pacific Cell Culture Industry Revenue (billion), by Application 2025 & 2033
- Figure 17: Asia Pacific Cell Culture Industry Revenue Share (%), by Application 2025 & 2033
- Figure 18: Asia Pacific Cell Culture Industry Revenue (billion), by Country 2025 & 2033
- Figure 19: Asia Pacific Cell Culture Industry Revenue Share (%), by Country 2025 & 2033
- Figure 20: Middle East and Africa Cell Culture Industry Revenue (billion), by Product and Consumables 2025 & 2033
- Figure 21: Middle East and Africa Cell Culture Industry Revenue Share (%), by Product and Consumables 2025 & 2033
- Figure 22: Middle East and Africa Cell Culture Industry Revenue (billion), by Application 2025 & 2033
- Figure 23: Middle East and Africa Cell Culture Industry Revenue Share (%), by Application 2025 & 2033
- Figure 24: Middle East and Africa Cell Culture Industry Revenue (billion), by Country 2025 & 2033
- Figure 25: Middle East and Africa Cell Culture Industry Revenue Share (%), by Country 2025 & 2033
- Figure 26: South America Cell Culture Industry Revenue (billion), by Product and Consumables 2025 & 2033
- Figure 27: South America Cell Culture Industry Revenue Share (%), by Product and Consumables 2025 & 2033
- Figure 28: South America Cell Culture Industry Revenue (billion), by Application 2025 & 2033
- Figure 29: South America Cell Culture Industry Revenue Share (%), by Application 2025 & 2033
- Figure 30: South America Cell Culture Industry Revenue (billion), by Country 2025 & 2033
- Figure 31: South America Cell Culture Industry Revenue Share (%), by Country 2025 & 2033
List of Tables
- Table 1: Global Cell Culture Industry Revenue billion Forecast, by Product and Consumables 2020 & 2033
- Table 2: Global Cell Culture Industry Revenue billion Forecast, by Application 2020 & 2033
- Table 3: Global Cell Culture Industry Revenue billion Forecast, by Region 2020 & 2033
- Table 4: Global Cell Culture Industry Revenue billion Forecast, by Product and Consumables 2020 & 2033
- Table 5: Global Cell Culture Industry Revenue billion Forecast, by Application 2020 & 2033
- Table 6: Global Cell Culture Industry Revenue billion Forecast, by Country 2020 & 2033
- Table 7: United States Cell Culture Industry Revenue (billion) Forecast, by Application 2020 & 2033
- Table 8: Canada Cell Culture Industry Revenue (billion) Forecast, by Application 2020 & 2033
- Table 9: Mexico Cell Culture Industry Revenue (billion) Forecast, by Application 2020 & 2033
- Table 10: Global Cell Culture Industry Revenue billion Forecast, by Product and Consumables 2020 & 2033
- Table 11: Global Cell Culture Industry Revenue billion Forecast, by Application 2020 & 2033
- Table 12: Global Cell Culture Industry Revenue billion Forecast, by Country 2020 & 2033
- Table 13: Germany Cell Culture Industry Revenue (billion) Forecast, by Application 2020 & 2033
- Table 14: United Kingdom Cell Culture Industry Revenue (billion) Forecast, by Application 2020 & 2033
- Table 15: France Cell Culture Industry Revenue (billion) Forecast, by Application 2020 & 2033
- Table 16: Italy Cell Culture Industry Revenue (billion) Forecast, by Application 2020 & 2033
- Table 17: Spain Cell Culture Industry Revenue (billion) Forecast, by Application 2020 & 2033
- Table 18: Rest of Europe Cell Culture Industry Revenue (billion) Forecast, by Application 2020 & 2033
- Table 19: Global Cell Culture Industry Revenue billion Forecast, by Product and Consumables 2020 & 2033
- Table 20: Global Cell Culture Industry Revenue billion Forecast, by Application 2020 & 2033
- Table 21: Global Cell Culture Industry Revenue billion Forecast, by Country 2020 & 2033
- Table 22: China Cell Culture Industry Revenue (billion) Forecast, by Application 2020 & 2033
- Table 23: Japan Cell Culture Industry Revenue (billion) Forecast, by Application 2020 & 2033
- Table 24: India Cell Culture Industry Revenue (billion) Forecast, by Application 2020 & 2033
- Table 25: Australia Cell Culture Industry Revenue (billion) Forecast, by Application 2020 & 2033
- Table 26: South Korea Cell Culture Industry Revenue (billion) Forecast, by Application 2020 & 2033
- Table 27: Rest of Asia Pacific Cell Culture Industry Revenue (billion) Forecast, by Application 2020 & 2033
- Table 28: Global Cell Culture Industry Revenue billion Forecast, by Product and Consumables 2020 & 2033
- Table 29: Global Cell Culture Industry Revenue billion Forecast, by Application 2020 & 2033
- Table 30: Global Cell Culture Industry Revenue billion Forecast, by Country 2020 & 2033
- Table 31: GCC Cell Culture Industry Revenue (billion) Forecast, by Application 2020 & 2033
- Table 32: South Africa Cell Culture Industry Revenue (billion) Forecast, by Application 2020 & 2033
- Table 33: Rest of Middle East and Africa Cell Culture Industry Revenue (billion) Forecast, by Application 2020 & 2033
- Table 34: Global Cell Culture Industry Revenue billion Forecast, by Product and Consumables 2020 & 2033
- Table 35: Global Cell Culture Industry Revenue billion Forecast, by Application 2020 & 2033
- Table 36: Global Cell Culture Industry Revenue billion Forecast, by Country 2020 & 2033
- Table 37: Brazil Cell Culture Industry Revenue (billion) Forecast, by Application 2020 & 2033
- Table 38: Argentina Cell Culture Industry Revenue (billion) Forecast, by Application 2020 & 2033
- Table 39: Rest of South America Cell Culture Industry Revenue (billion) Forecast, by Application 2020 & 2033
Frequently Asked Questions
1. What is the projected Compound Annual Growth Rate (CAGR) of the Cell Culture Industry?
The projected CAGR is approximately 12.94%.
2. Which companies are prominent players in the Cell Culture Industry?
Key companies in the market include Becton Dickinson and Company, Promocell GmbH, Merck KGaA, Hi-Media Laboratories, Lonza Group, Cytiva, Sartorius AG, Danaher Corporation, Corning Incorporated*List Not Exhaustive, Sekisui XenoTech LLC, Agilent Technologies Inc, Thermo Fisher Scientific, Biospherix.
3. What are the main segments of the Cell Culture Industry?
The market segments include Product and Consumables, Application.
4. Can you provide details about the market size?
The market size is estimated to be USD 19.13 billion as of 2022.
5. What are some drivers contributing to market growth?
Rise in the Demand for Vaccines. Biopharmaceuticals and Artificial Organs; Growing Focus on Personalized Medicine.
6. What are the notable trends driving market growth?
Drug Development Segment is Expected to Witness Rapid Growth Over the Forecast Period..
7. Are there any restraints impacting market growth?
High Cost Associated with Cell Based Research; Lack of Infrastructure for Cell-based Research in Emerging Economies.
8. Can you provide examples of recent developments in the market?
In June 2022, Evonik launched the cQrex portfolio of cell culture ingredients to increase efficiency and productivity in bioprocesses for producing monoclonal antibodies, vaccines, viral vectors, and therapeutic cells.
9. What pricing options are available for accessing the report?
Pricing options include single-user, multi-user, and enterprise licenses priced at USD 4750, USD 5250, and USD 8750 respectively.
10. Is the market size provided in terms of value or volume?
The market size is provided in terms of value, measured in billion.
11. Are there any specific market keywords associated with the report?
Yes, the market keyword associated with the report is "Cell Culture Industry," which aids in identifying and referencing the specific market segment covered.
12. How do I determine which pricing option suits my needs best?
The pricing options vary based on user requirements and access needs. Individual users may opt for single-user licenses, while businesses requiring broader access may choose multi-user or enterprise licenses for cost-effective access to the report.
13. Are there any additional resources or data provided in the Cell Culture Industry report?
While the report offers comprehensive insights, it's advisable to review the specific contents or supplementary materials provided to ascertain if additional resources or data are available.
14. How can I stay updated on further developments or reports in the Cell Culture Industry?
To stay informed about further developments, trends, and reports in the Cell Culture Industry, consider subscribing to industry newsletters, following relevant companies and organizations, or regularly checking reputable industry news sources and publications.
Methodology
Step 1 - Identification of Relevant Samples Size from Population Database


Step 2 - Approaches for Defining Global Market Size (Value, Volume* & Price*)

Note*: In applicable scenarios
Step 3 - Data Sources
Primary Research
- Web Analytics
- Survey Reports
- Research Institute
- Latest Research Reports
- Opinion Leaders
Secondary Research
- Annual Reports
- White Paper
- Latest Press Release
- Industry Association
- Paid Database
- Investor Presentations

Step 4 - Data Triangulation
Involves using different sources of information in order to increase the validity of a study
These sources are likely to be stakeholders in a program - participants, other researchers, program staff, other community members, and so on.
Then we put all data in single framework & apply various statistical tools to find out the dynamic on the market.
During the analysis stage, feedback from the stakeholder groups would be compared to determine areas of agreement as well as areas of divergence

