Key Insights
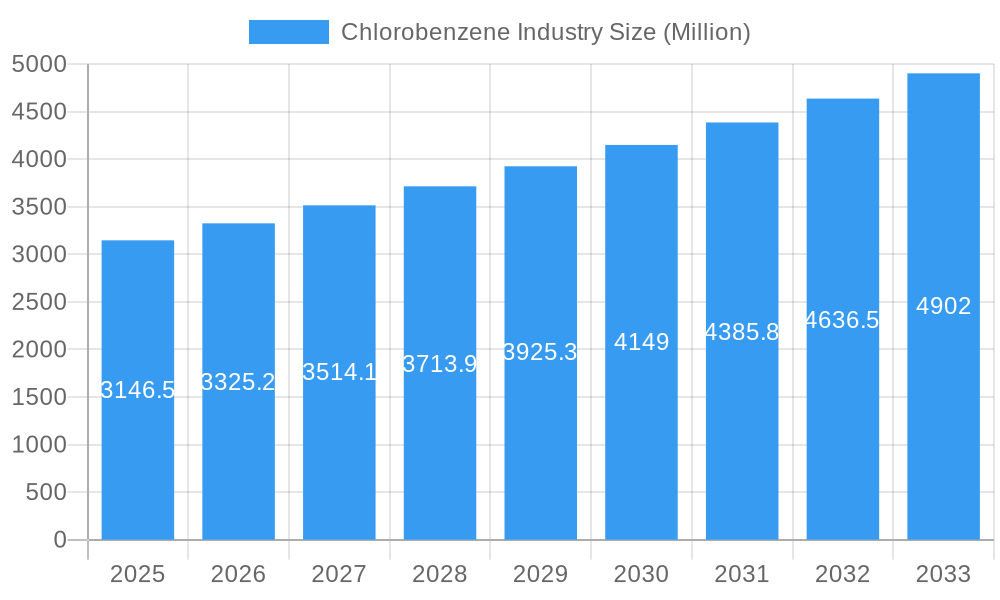
The global Chlorobenzene market is projected for substantial growth, expanding from a base of $3,146.5 million in 2025. The market is anticipated to witness a Compound Annual Growth Rate (CAGR) of 5.7% through 2033. This expansion is propelled by robust demand for nitrochlorobenzenes, essential intermediates for dyes, pigments, and agrochemicals. Additionally, the increasing use of chlorobenzene derivatives in advanced polymers such as polyphenylene sulfide (PPS) and polysulfone, valued for their exceptional thermal and chemical resistance, is a significant growth driver. Chlorobenzene's effectiveness as a solvent in industrial cleaning and degreasing applications also sustains its market relevance.
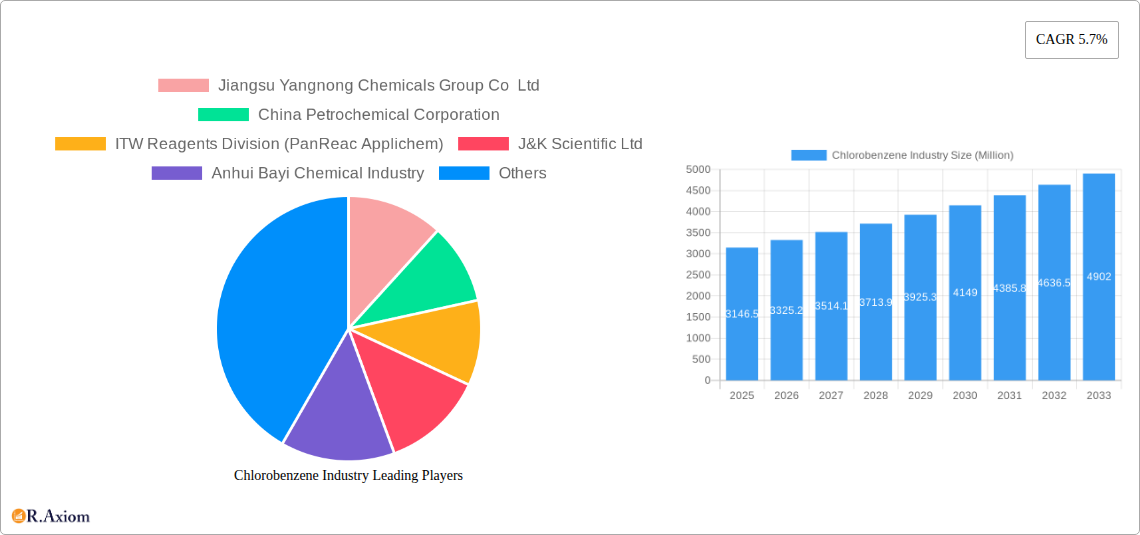
Chlorobenzene Industry Market Size (In Billion)
Key trends influencing the Chlorobenzene market include strong growth in the Asia Pacific region, particularly China and India, driven by rapid industrialization and manufacturing sector expansion. Innovations in production technologies enhancing purity and efficiency will also be crucial. Potential market restraints include stringent environmental regulations for chlorinated compounds and volatility in raw material prices (benzene and chlorine). Despite these challenges, the diverse applications of chlorobenzene, ranging from consumer products to critical chemical intermediates and advanced materials, ensure a resilient and expanding global market.
Chlorobenzene Industry Company Market Share
This comprehensive report offers an SEO-optimized analysis of the Chlorobenzene industry, detailing market size, growth, and future forecasts.
Chlorobenzene Industry Market Concentration & Innovation
The global Chlorobenzene industry demonstrates a moderate market concentration, with a few key players like China Petrochemical Corporation and Jiangsu Yangnong Chemicals Group Co Ltd holding significant market share, estimated at over 25% and 18% respectively. Innovation in this sector is primarily driven by the demand for specialized chlorobenzene derivatives for high-performance polymers such as Polyphenylene Sulfide (PPS) and Polysulfone Polymers, and advancements in greener synthesis methods to mitigate environmental impact. Regulatory frameworks, particularly concerning emissions and hazardous waste disposal, are increasingly shaping manufacturing processes and product development. The emergence of advanced solvents and niche applications in electronics and pharmaceuticals presents a growing area for innovation, while the continued, albeit declining, use in moth control applications contributes to the overall market landscape. Mergers and acquisitions (M&A) activity is moderate, with strategic consolidations to enhance production capacity or acquire proprietary technologies. Deal values in recent years have ranged from tens of millions to hundreds of millions of US Dollars, focused on strengthening competitive positions and expanding geographical reach. The development of more efficient purification techniques and the exploration of bio-based alternatives, though still nascent, represent significant future innovation drivers.
Chlorobenzene Industry Industry Trends & Insights
The Chlorobenzene industry is poised for steady growth, with a projected Compound Annual Growth Rate (CAGR) of approximately 4.5% between 2025 and 2033. This growth is fundamentally propelled by the escalating demand for high-performance engineering plastics like Polyphenylene Sulfide (PPS) and Polysulfone Polymers, which find extensive applications in the automotive, aerospace, and electronics sectors due to their exceptional thermal stability, chemical resistance, and mechanical strength. The automotive industry, in particular, is a significant driver, with increasing adoption of lightweight and durable materials to improve fuel efficiency and performance, directly boosting the consumption of chlorobenzene derivatives used in PPS and polysulfone manufacturing. Furthermore, the sustained demand for nitrochlorobenzenes as key intermediates in the production of dyes, pigments, pharmaceuticals, and agrochemicals continues to underpin market expansion. Technological disruptions, such as the development of more energy-efficient and environmentally friendly chlorination processes, are gaining traction, aiming to reduce the carbon footprint of production and comply with stringent environmental regulations. Consumer preferences are also subtly influencing the market, with a growing emphasis on sustainability and safer alternatives, prompting research into less hazardous synthesis routes and biodegradable derivatives. Competitive dynamics within the industry are characterized by strategic alliances, capacity expansions by major players, and a keen focus on cost optimization and supply chain resilience. Market penetration in emerging economies, particularly in Asia-Pacific, is accelerating due to rapid industrialization and infrastructure development. The market is also witnessing a trend towards higher purity chlorobenzene grades catering to specialized applications in the pharmaceutical and electronic industries. The overall market size is estimated to reach over $12,000 million by 2033.
Dominant Markets & Segments in Chlorobenzene Industry
The Monochlorobenzene segment is the dominant force within the Chlorobenzene industry, accounting for an estimated 40% of the total market value. Its widespread use as a versatile solvent in chemical synthesis, a precursor for phenol and aniline, and its application in the production of nitrochlorobenzenes, which are vital for dyes and agrochemicals, solidify its leading position. The market’s dominance is bolstered by robust industrial activity in regions with strong chemical manufacturing bases, such as China and India. Economic policies that favor the growth of the chemical and manufacturing sectors in these countries, coupled with significant investments in infrastructure, directly translate to higher demand for monochlorobenzene.
Nitrochlorobenzenes represent another critical segment, driven by their indispensable role in the production of a vast array of downstream products. This includes dyestuffs for textiles and paints, agricultural chemicals like herbicides and insecticides, and pharmaceuticals. The growth in the textile and agriculture industries, particularly in developing nations, directly fuels the demand for nitrochlorobenzenes.
The Polyphenylene Sulfide (PPS) and Polysulfone Polymers segments, while smaller in current market share, are exhibiting the highest growth rates. The increasing demand for high-performance polymers in sectors like automotive (for lightweighting and engine components), electronics (for insulation and connectors), and aerospace (for structural parts) is a primary driver. Technological advancements leading to improved properties of these polymers further enhance their adoption, making them a key growth area.
The Solvents application, encompassing its use in paints, coatings, adhesives, and cleaning agents, continues to be a significant contributor. Its effectiveness as a solvent for various organic compounds ensures its sustained demand across diverse industrial applications.
o-dichlorobenzene, p-dichlorobenzene, and m-Dichlorobenzene hold specialized niches. o-dichlorobenzene finds application in the production of dyes and pharmaceuticals, while p-dichlorobenzene is historically known for its use in moth control and as a deodorant, though regulatory pressures are impacting this segment. m-Dichlorobenzene has niche applications in the synthesis of herbicides and other fine chemicals.
Moth Control and Room and Sanitary Deodorants are segments experiencing a decline due to the development of safer, more environmentally friendly alternatives and increasing regulatory scrutiny on traditional chemicals. However, some markets still retain demand for these products.
The Other Applications segment encompasses a range of emerging and specialized uses, including intermediates for specialty chemicals, research chemicals, and applications in the electronics industry for etching and cleaning processes.
Chlorobenzene Industry Product Developments
Product developments in the Chlorobenzene industry are largely focused on enhancing process efficiency and expanding applications in high-value sectors. Innovations are centered on developing cleaner, more sustainable synthesis routes for monochlorobenzene and its derivatives, reducing by-product formation and energy consumption. The refinement of purification technologies is leading to higher purity grades of chlorobenzenes, critical for their use as advanced solvents and intermediates in the pharmaceutical and electronics industries. Furthermore, significant R&D efforts are directed towards optimizing the production of chlorobenzene-based monomers for high-performance polymers like Polyphenylene Sulfide (PPS) and Polysulfone Polymers, thereby enhancing their mechanical and thermal properties for demanding applications in automotive and aerospace. These developments aim to provide competitive advantages through improved product performance, cost-effectiveness, and a reduced environmental footprint.
Report Scope & Segmentation Analysis
This report meticulously analyzes the global Chlorobenzene industry, segmenting the market by Type and Application. The Type segmentation includes Monochlorobenzene, o-dichlorobenzene, p-dichlorobenzene, m-Dichlorobenzene, and Other Types. Monochlorobenzene is projected to maintain its leading market share due to its broad industrial utility. o-dichlorobenzene, p-dichlorobenzene, and m-dichlorobenzene cater to niche applications and are subject to specific market dynamics influenced by regulatory landscapes and alternative product developments. The Application segmentation covers Moth Control, Nitrochlorobenzenes, Polyphenylene Sulfide, Polysulfone Polymers, Solvents, Room and Sanitary Deodorants, and Other Applications. The Nitrochlorobenzenes and high-performance polymer segments (Polyphenylene Sulfide, Polysulfone Polymers) are expected to witness substantial growth, driven by expanding end-user industries. While Solvents remain a consistent demand driver, Moth Control and Room and Sanitary Deodorants segments are anticipated to face a decline. The market size for each segment, along with their respective growth projections and competitive landscapes, are thoroughly detailed within the report, offering a comprehensive understanding of the industry's structure and future trajectory.
Key Drivers of Chlorobenzene Industry Growth
The Chlorobenzene industry's growth is propelled by several key drivers. The escalating demand for high-performance polymers like Polyphenylene Sulfide (PPS) and Polysulfone Polymers, driven by the automotive and electronics sectors' need for lightweight, durable, and heat-resistant materials, is a primary growth catalyst. The sustained importance of nitrochlorobenzenes as essential intermediates in the manufacturing of dyes, pigments, pharmaceuticals, and agrochemicals, particularly in burgeoning economies, provides a consistent demand base. Furthermore, the versatility of monochlorobenzene as a solvent and precursor in numerous chemical synthesis processes underpins its broad industrial application. Supportive government policies promoting industrial development and chemical manufacturing in key regions, coupled with increasing investments in infrastructure, further stimulate market expansion.
Challenges in the Chlorobenzene Industry Sector
The Chlorobenzene industry faces several significant challenges. Stringent environmental regulations concerning emissions, waste disposal, and the use of hazardous chemicals pose a considerable hurdle, necessitating significant investments in greener technologies and compliance measures. Fluctuations in the prices of raw materials, such as benzene and chlorine, can impact profit margins and market competitiveness. The declining demand in traditional applications like moth control due to the availability of safer alternatives and increasing regulatory restrictions presents a challenge for specific market segments. Moreover, the inherent toxicity of some chlorobenzene compounds and their by-products requires careful handling and stringent safety protocols throughout the supply chain, adding to operational costs and complexities.
Emerging Opportunities in Chlorobenzene Industry
Emerging opportunities in the Chlorobenzene industry lie in the development of sustainable and eco-friendly production processes, catering to the growing global demand for green chemicals. The expanding applications of chlorobenzene-based monomers in the production of advanced engineering plastics for electric vehicles and renewable energy infrastructure present significant growth potential. Furthermore, advancements in purification technologies are opening doors for higher-purity chlorobenzene grades, crucial for the burgeoning pharmaceutical and advanced electronics sectors. The exploration of new niche applications in specialty chemicals, coatings, and pharmaceuticals, driven by continuous research and development, also offers promising avenues for market expansion.
Leading Players in the Chlorobenzene Industry Market
- Jiangsu Yangnong Chemicals Group Co Ltd
- China Petrochemical Corporation
- ITW Reagents Division (PanReac Applichem)
- J&K Scientific Ltd
- Anhui Bayi Chemical Industry
- Chemada Fine Chemicals
- Kureha Corporation
- Tianjin Bohai Chemical Industry Co Ltd
- Meryer (Shanghai) Chemical Technology Co Ltd
- Lanxess
Key Developments in Chlorobenzene Industry Industry
- 2022: Kureha Corporation announced expanded production capacity for Polyphenylene Sulfide (PPS) resins to meet growing demand from the automotive and electronics sectors.
- 2023: China Petrochemical Corporation invested in new, advanced chlorination technology to improve process efficiency and reduce environmental impact in its chlorobenzene production.
- 2023: Lanxess launched a new range of high-performance solvents derived from chlorobenzene, targeting specialized industrial cleaning applications.
- 2024: Jiangsu Yangnong Chemicals Group Co Ltd focused on research and development for greener synthesis methods of monochlorobenzene, aiming for reduced waste generation.
- 2024: Meryer (Shanghai) Chemical Technology Co Ltd expanded its portfolio of high-purity chlorobenzene derivatives for research and pharmaceutical applications.
Strategic Outlook for Chlorobenzene Industry Market
The strategic outlook for the Chlorobenzene industry is characterized by a strong emphasis on innovation, sustainability, and market diversification. Growth catalysts include the increasing adoption of high-performance polymers in electric vehicles and advanced electronics, coupled with the sustained demand for nitrochlorobenzenes in essential industries. Companies are expected to focus on developing cleaner production technologies and expanding their product portfolios to cater to niche applications in pharmaceuticals and specialty chemicals. Strategic partnerships and targeted M&A activities will likely play a crucial role in consolidating market positions and acquiring advanced technologies. The industry's ability to adapt to evolving regulatory landscapes and consumer preferences for sustainable products will be paramount to achieving long-term growth and profitability.
Chlorobenzene Industry Segmentation
-
1. Type
- 1.1. Monochlorobenzene
- 1.2. o-dichlorobenzene
- 1.3. p-dichlorobenzene
- 1.4. m-Dichlorobenzene
- 1.5. Other Types
-
2. Application
- 2.1. Moth Control
- 2.2. Nitrochlorobenzenes
- 2.3. Polyphenylene Sulfide
- 2.4. Polysulfone Polymers
- 2.5. Solvents
- 2.6. Room and Sanitary Deodorants
- 2.7. Other Applications
Chlorobenzene Industry Segmentation By Geography
-
1. Asia Pacific
- 1.1. China
- 1.2. India
- 1.3. Japan
- 1.4. South Korea
- 1.5. Malaysia
- 1.6. Thailand
- 1.7. Indonesia
- 1.8. Vietnam
- 1.9. Rest of Asia Pacific
-
2. North America
- 2.1. United States
- 2.2. Canada
- 2.3. Mexico
-
3. Europe
- 3.1. Germany
- 3.2. United Kingdom
- 3.3. France
- 3.4. Italy
- 3.5. Spain
- 3.6. Nordic
- 3.7. Turkey
- 3.8. Russia
- 3.9. Rest of Europe
-
4. South America
- 4.1. Brazil
- 4.2. Argentina
- 4.3. Colombia
- 4.4. Rest of South America
- 5. Middle East
-
6. Saudi Arabia
- 6.1. South Africa
- 6.2. Nigeria
- 6.3. Qatar
- 6.4. Egypt
- 6.5. United Arab Emirates
- 6.6. Rest of Middle East
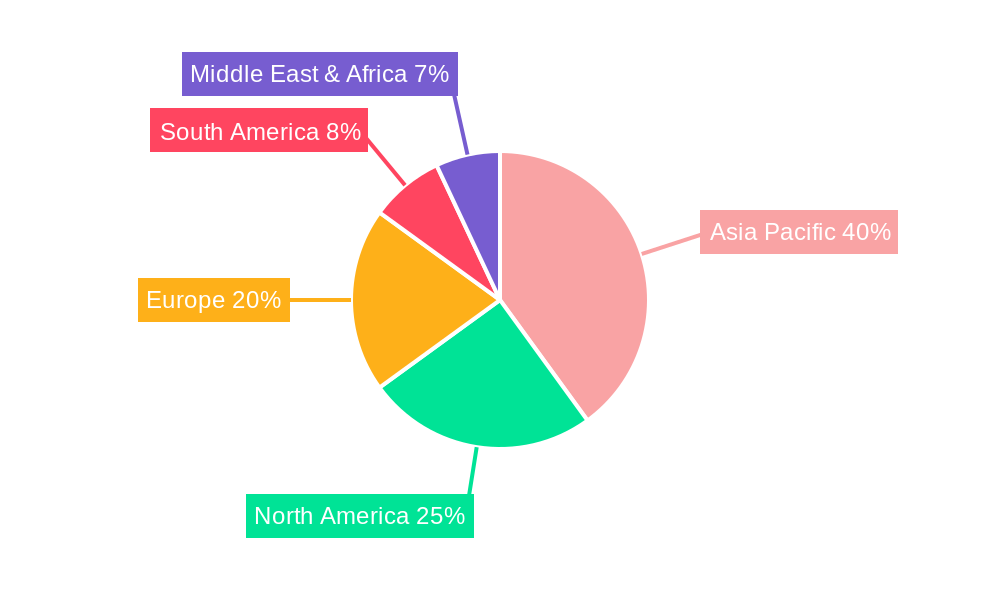
Chlorobenzene Industry Regional Market Share
Geographic Coverage of Chlorobenzene Industry
Chlorobenzene Industry REPORT HIGHLIGHTS
| Aspects | Details |
|---|---|
| Study Period | 2020-2034 |
| Base Year | 2025 |
| Estimated Year | 2026 |
| Forecast Period | 2026-2034 |
| Historical Period | 2020-2025 |
| Growth Rate | CAGR of 3.5% from 2020-2034 |
| Segmentation |
|
Table of Contents
- 1. Introduction
- 1.1. Research Scope
- 1.2. Market Segmentation
- 1.3. Research Objective
- 1.4. Definitions and Assumptions
- 2. Executive Summary
- 2.1. Market Snapshot
- 3. Market Dynamics
- 3.1. Market Drivers
- 3.2. Market Restrains
- 3.3. Market Trends
- 3.4. Market Opportunities
- 4. Market Factor Analysis
- 4.1. Porters Five Forces
- 4.1.1. Bargaining Power of Suppliers
- 4.1.2. Bargaining Power of Buyers
- 4.1.3. Threat of New Entrants
- 4.1.4. Threat of Substitutes
- 4.1.5. Competitive Rivalry
- 4.2. PESTEL analysis
- 4.3. BCG Analysis
- 4.3.1. Stars (High Growth, High Market Share)
- 4.3.2. Cash Cows (Low Growth, High Market Share)
- 4.3.3. Question Mark (High Growth, Low Market Share)
- 4.3.4. Dogs (Low Growth, Low Market Share)
- 4.4. Ansoff Matrix Analysis
- 4.5. Supply Chain Analysis
- 4.6. Regulatory Landscape
- 4.7. Current Market Potential and Opportunity Assessment (TAM–SAM–SOM Framework)
- 4.8. RAX Analyst Note
- 4.1. Porters Five Forces
- 5. Market Analysis, Insights and Forecast 2021-2033
- 5.1. Market Analysis, Insights and Forecast - by Type
- 5.1.1. Monochlorobenzene
- 5.1.2. o-dichlorobenzene
- 5.1.3. p-dichlorobenzene
- 5.1.4. m-Dichlorobenzene
- 5.1.5. Other Types
- 5.2. Market Analysis, Insights and Forecast - by Application
- 5.2.1. Moth Control
- 5.2.2. Nitrochlorobenzenes
- 5.2.3. Polyphenylene Sulfide
- 5.2.4. Polysulfone Polymers
- 5.2.5. Solvents
- 5.2.6. Room and Sanitary Deodorants
- 5.2.7. Other Applications
- 5.3. Market Analysis, Insights and Forecast - by Region
- 5.3.1. Asia Pacific
- 5.3.2. North America
- 5.3.3. Europe
- 5.3.4. South America
- 5.3.5. Middle East
- 5.3.6. Saudi Arabia
- 5.1. Market Analysis, Insights and Forecast - by Type
- 6. Global Chlorobenzene Industry Analysis, Insights and Forecast, 2021-2033
- 6.1. Market Analysis, Insights and Forecast - by Type
- 6.1.1. Monochlorobenzene
- 6.1.2. o-dichlorobenzene
- 6.1.3. p-dichlorobenzene
- 6.1.4. m-Dichlorobenzene
- 6.1.5. Other Types
- 6.2. Market Analysis, Insights and Forecast - by Application
- 6.2.1. Moth Control
- 6.2.2. Nitrochlorobenzenes
- 6.2.3. Polyphenylene Sulfide
- 6.2.4. Polysulfone Polymers
- 6.2.5. Solvents
- 6.2.6. Room and Sanitary Deodorants
- 6.2.7. Other Applications
- 6.1. Market Analysis, Insights and Forecast - by Type
- 7. Asia Pacific Chlorobenzene Industry Analysis, Insights and Forecast, 2020-2032
- 7.1. Market Analysis, Insights and Forecast - by Type
- 7.1.1. Monochlorobenzene
- 7.1.2. o-dichlorobenzene
- 7.1.3. p-dichlorobenzene
- 7.1.4. m-Dichlorobenzene
- 7.1.5. Other Types
- 7.2. Market Analysis, Insights and Forecast - by Application
- 7.2.1. Moth Control
- 7.2.2. Nitrochlorobenzenes
- 7.2.3. Polyphenylene Sulfide
- 7.2.4. Polysulfone Polymers
- 7.2.5. Solvents
- 7.2.6. Room and Sanitary Deodorants
- 7.2.7. Other Applications
- 7.1. Market Analysis, Insights and Forecast - by Type
- 8. North America Chlorobenzene Industry Analysis, Insights and Forecast, 2020-2032
- 8.1. Market Analysis, Insights and Forecast - by Type
- 8.1.1. Monochlorobenzene
- 8.1.2. o-dichlorobenzene
- 8.1.3. p-dichlorobenzene
- 8.1.4. m-Dichlorobenzene
- 8.1.5. Other Types
- 8.2. Market Analysis, Insights and Forecast - by Application
- 8.2.1. Moth Control
- 8.2.2. Nitrochlorobenzenes
- 8.2.3. Polyphenylene Sulfide
- 8.2.4. Polysulfone Polymers
- 8.2.5. Solvents
- 8.2.6. Room and Sanitary Deodorants
- 8.2.7. Other Applications
- 8.1. Market Analysis, Insights and Forecast - by Type
- 9. Europe Chlorobenzene Industry Analysis, Insights and Forecast, 2020-2032
- 9.1. Market Analysis, Insights and Forecast - by Type
- 9.1.1. Monochlorobenzene
- 9.1.2. o-dichlorobenzene
- 9.1.3. p-dichlorobenzene
- 9.1.4. m-Dichlorobenzene
- 9.1.5. Other Types
- 9.2. Market Analysis, Insights and Forecast - by Application
- 9.2.1. Moth Control
- 9.2.2. Nitrochlorobenzenes
- 9.2.3. Polyphenylene Sulfide
- 9.2.4. Polysulfone Polymers
- 9.2.5. Solvents
- 9.2.6. Room and Sanitary Deodorants
- 9.2.7. Other Applications
- 9.1. Market Analysis, Insights and Forecast - by Type
- 10. South America Chlorobenzene Industry Analysis, Insights and Forecast, 2020-2032
- 10.1. Market Analysis, Insights and Forecast - by Type
- 10.1.1. Monochlorobenzene
- 10.1.2. o-dichlorobenzene
- 10.1.3. p-dichlorobenzene
- 10.1.4. m-Dichlorobenzene
- 10.1.5. Other Types
- 10.2. Market Analysis, Insights and Forecast - by Application
- 10.2.1. Moth Control
- 10.2.2. Nitrochlorobenzenes
- 10.2.3. Polyphenylene Sulfide
- 10.2.4. Polysulfone Polymers
- 10.2.5. Solvents
- 10.2.6. Room and Sanitary Deodorants
- 10.2.7. Other Applications
- 10.1. Market Analysis, Insights and Forecast - by Type
- 11. Middle East Chlorobenzene Industry Analysis, Insights and Forecast, 2020-2032
- 11.1. Market Analysis, Insights and Forecast - by Type
- 11.1.1. Monochlorobenzene
- 11.1.2. o-dichlorobenzene
- 11.1.3. p-dichlorobenzene
- 11.1.4. m-Dichlorobenzene
- 11.1.5. Other Types
- 11.2. Market Analysis, Insights and Forecast - by Application
- 11.2.1. Moth Control
- 11.2.2. Nitrochlorobenzenes
- 11.2.3. Polyphenylene Sulfide
- 11.2.4. Polysulfone Polymers
- 11.2.5. Solvents
- 11.2.6. Room and Sanitary Deodorants
- 11.2.7. Other Applications
- 11.1. Market Analysis, Insights and Forecast - by Type
- 12. Saudi Arabia Chlorobenzene Industry Analysis, Insights and Forecast, 2020-2032
- 12.1. Market Analysis, Insights and Forecast - by Type
- 12.1.1. Monochlorobenzene
- 12.1.2. o-dichlorobenzene
- 12.1.3. p-dichlorobenzene
- 12.1.4. m-Dichlorobenzene
- 12.1.5. Other Types
- 12.2. Market Analysis, Insights and Forecast - by Application
- 12.2.1. Moth Control
- 12.2.2. Nitrochlorobenzenes
- 12.2.3. Polyphenylene Sulfide
- 12.2.4. Polysulfone Polymers
- 12.2.5. Solvents
- 12.2.6. Room and Sanitary Deodorants
- 12.2.7. Other Applications
- 12.1. Market Analysis, Insights and Forecast - by Type
- 13. Competitive Analysis
- 13.1. Company Profiles
- 13.1.1 Jiangsu Yangnong Chemicals Group Co Ltd
- 13.1.1.1. Company Overview
- 13.1.1.2. Products
- 13.1.1.3. Company Financials
- 13.1.1.4. SWOT Analysis
- 13.1.2 China Petrochemical Corporation
- 13.1.2.1. Company Overview
- 13.1.2.2. Products
- 13.1.2.3. Company Financials
- 13.1.2.4. SWOT Analysis
- 13.1.3 ITW Reagents Division (PanReac Applichem)
- 13.1.3.1. Company Overview
- 13.1.3.2. Products
- 13.1.3.3. Company Financials
- 13.1.3.4. SWOT Analysis
- 13.1.4 J&K Scientific Ltd
- 13.1.4.1. Company Overview
- 13.1.4.2. Products
- 13.1.4.3. Company Financials
- 13.1.4.4. SWOT Analysis
- 13.1.5 Anhui Bayi Chemical Industry
- 13.1.5.1. Company Overview
- 13.1.5.2. Products
- 13.1.5.3. Company Financials
- 13.1.5.4. SWOT Analysis
- 13.1.6 Chemada Fine Chemicals
- 13.1.6.1. Company Overview
- 13.1.6.2. Products
- 13.1.6.3. Company Financials
- 13.1.6.4. SWOT Analysis
- 13.1.7 Kureha Corporation
- 13.1.7.1. Company Overview
- 13.1.7.2. Products
- 13.1.7.3. Company Financials
- 13.1.7.4. SWOT Analysis
- 13.1.8 Tianjin Bohai Chemical Industry Co Ltd
- 13.1.8.1. Company Overview
- 13.1.8.2. Products
- 13.1.8.3. Company Financials
- 13.1.8.4. SWOT Analysis
- 13.1.9 Meryer (Shanghai) Chemical Technology Co Ltd
- 13.1.9.1. Company Overview
- 13.1.9.2. Products
- 13.1.9.3. Company Financials
- 13.1.9.4. SWOT Analysis
- 13.1.10 Lanxess
- 13.1.10.1. Company Overview
- 13.1.10.2. Products
- 13.1.10.3. Company Financials
- 13.1.10.4. SWOT Analysis
- 13.1.1 Jiangsu Yangnong Chemicals Group Co Ltd
- 13.2. Market Entropy
- 13.2.1 Company's Key Areas Served
- 13.2.2 Recent Developments
- 13.3. Company Market Share Analysis 2025
- 13.3.1 Top 5 Companies Market Share Analysis
- 13.3.2 Top 3 Companies Market Share Analysis
- 13.4. List of Potential Customers
- 14. Research Methodology
List of Figures
- Figure 1: Global Chlorobenzene Industry Revenue Breakdown (million, %) by Region 2025 & 2033
- Figure 2: Global Chlorobenzene Industry Volume Breakdown (K Tons, %) by Region 2025 & 2033
- Figure 3: Asia Pacific Chlorobenzene Industry Revenue (million), by Type 2025 & 2033
- Figure 4: Asia Pacific Chlorobenzene Industry Volume (K Tons), by Type 2025 & 2033
- Figure 5: Asia Pacific Chlorobenzene Industry Revenue Share (%), by Type 2025 & 2033
- Figure 6: Asia Pacific Chlorobenzene Industry Volume Share (%), by Type 2025 & 2033
- Figure 7: Asia Pacific Chlorobenzene Industry Revenue (million), by Application 2025 & 2033
- Figure 8: Asia Pacific Chlorobenzene Industry Volume (K Tons), by Application 2025 & 2033
- Figure 9: Asia Pacific Chlorobenzene Industry Revenue Share (%), by Application 2025 & 2033
- Figure 10: Asia Pacific Chlorobenzene Industry Volume Share (%), by Application 2025 & 2033
- Figure 11: Asia Pacific Chlorobenzene Industry Revenue (million), by Country 2025 & 2033
- Figure 12: Asia Pacific Chlorobenzene Industry Volume (K Tons), by Country 2025 & 2033
- Figure 13: Asia Pacific Chlorobenzene Industry Revenue Share (%), by Country 2025 & 2033
- Figure 14: Asia Pacific Chlorobenzene Industry Volume Share (%), by Country 2025 & 2033
- Figure 15: North America Chlorobenzene Industry Revenue (million), by Type 2025 & 2033
- Figure 16: North America Chlorobenzene Industry Volume (K Tons), by Type 2025 & 2033
- Figure 17: North America Chlorobenzene Industry Revenue Share (%), by Type 2025 & 2033
- Figure 18: North America Chlorobenzene Industry Volume Share (%), by Type 2025 & 2033
- Figure 19: North America Chlorobenzene Industry Revenue (million), by Application 2025 & 2033
- Figure 20: North America Chlorobenzene Industry Volume (K Tons), by Application 2025 & 2033
- Figure 21: North America Chlorobenzene Industry Revenue Share (%), by Application 2025 & 2033
- Figure 22: North America Chlorobenzene Industry Volume Share (%), by Application 2025 & 2033
- Figure 23: North America Chlorobenzene Industry Revenue (million), by Country 2025 & 2033
- Figure 24: North America Chlorobenzene Industry Volume (K Tons), by Country 2025 & 2033
- Figure 25: North America Chlorobenzene Industry Revenue Share (%), by Country 2025 & 2033
- Figure 26: North America Chlorobenzene Industry Volume Share (%), by Country 2025 & 2033
- Figure 27: Europe Chlorobenzene Industry Revenue (million), by Type 2025 & 2033
- Figure 28: Europe Chlorobenzene Industry Volume (K Tons), by Type 2025 & 2033
- Figure 29: Europe Chlorobenzene Industry Revenue Share (%), by Type 2025 & 2033
- Figure 30: Europe Chlorobenzene Industry Volume Share (%), by Type 2025 & 2033
- Figure 31: Europe Chlorobenzene Industry Revenue (million), by Application 2025 & 2033
- Figure 32: Europe Chlorobenzene Industry Volume (K Tons), by Application 2025 & 2033
- Figure 33: Europe Chlorobenzene Industry Revenue Share (%), by Application 2025 & 2033
- Figure 34: Europe Chlorobenzene Industry Volume Share (%), by Application 2025 & 2033
- Figure 35: Europe Chlorobenzene Industry Revenue (million), by Country 2025 & 2033
- Figure 36: Europe Chlorobenzene Industry Volume (K Tons), by Country 2025 & 2033
- Figure 37: Europe Chlorobenzene Industry Revenue Share (%), by Country 2025 & 2033
- Figure 38: Europe Chlorobenzene Industry Volume Share (%), by Country 2025 & 2033
- Figure 39: South America Chlorobenzene Industry Revenue (million), by Type 2025 & 2033
- Figure 40: South America Chlorobenzene Industry Volume (K Tons), by Type 2025 & 2033
- Figure 41: South America Chlorobenzene Industry Revenue Share (%), by Type 2025 & 2033
- Figure 42: South America Chlorobenzene Industry Volume Share (%), by Type 2025 & 2033
- Figure 43: South America Chlorobenzene Industry Revenue (million), by Application 2025 & 2033
- Figure 44: South America Chlorobenzene Industry Volume (K Tons), by Application 2025 & 2033
- Figure 45: South America Chlorobenzene Industry Revenue Share (%), by Application 2025 & 2033
- Figure 46: South America Chlorobenzene Industry Volume Share (%), by Application 2025 & 2033
- Figure 47: South America Chlorobenzene Industry Revenue (million), by Country 2025 & 2033
- Figure 48: South America Chlorobenzene Industry Volume (K Tons), by Country 2025 & 2033
- Figure 49: South America Chlorobenzene Industry Revenue Share (%), by Country 2025 & 2033
- Figure 50: South America Chlorobenzene Industry Volume Share (%), by Country 2025 & 2033
- Figure 51: Middle East Chlorobenzene Industry Revenue (million), by Type 2025 & 2033
- Figure 52: Middle East Chlorobenzene Industry Volume (K Tons), by Type 2025 & 2033
- Figure 53: Middle East Chlorobenzene Industry Revenue Share (%), by Type 2025 & 2033
- Figure 54: Middle East Chlorobenzene Industry Volume Share (%), by Type 2025 & 2033
- Figure 55: Middle East Chlorobenzene Industry Revenue (million), by Application 2025 & 2033
- Figure 56: Middle East Chlorobenzene Industry Volume (K Tons), by Application 2025 & 2033
- Figure 57: Middle East Chlorobenzene Industry Revenue Share (%), by Application 2025 & 2033
- Figure 58: Middle East Chlorobenzene Industry Volume Share (%), by Application 2025 & 2033
- Figure 59: Middle East Chlorobenzene Industry Revenue (million), by Country 2025 & 2033
- Figure 60: Middle East Chlorobenzene Industry Volume (K Tons), by Country 2025 & 2033
- Figure 61: Middle East Chlorobenzene Industry Revenue Share (%), by Country 2025 & 2033
- Figure 62: Middle East Chlorobenzene Industry Volume Share (%), by Country 2025 & 2033
- Figure 63: Saudi Arabia Chlorobenzene Industry Revenue (million), by Type 2025 & 2033
- Figure 64: Saudi Arabia Chlorobenzene Industry Volume (K Tons), by Type 2025 & 2033
- Figure 65: Saudi Arabia Chlorobenzene Industry Revenue Share (%), by Type 2025 & 2033
- Figure 66: Saudi Arabia Chlorobenzene Industry Volume Share (%), by Type 2025 & 2033
- Figure 67: Saudi Arabia Chlorobenzene Industry Revenue (million), by Application 2025 & 2033
- Figure 68: Saudi Arabia Chlorobenzene Industry Volume (K Tons), by Application 2025 & 2033
- Figure 69: Saudi Arabia Chlorobenzene Industry Revenue Share (%), by Application 2025 & 2033
- Figure 70: Saudi Arabia Chlorobenzene Industry Volume Share (%), by Application 2025 & 2033
- Figure 71: Saudi Arabia Chlorobenzene Industry Revenue (million), by Country 2025 & 2033
- Figure 72: Saudi Arabia Chlorobenzene Industry Volume (K Tons), by Country 2025 & 2033
- Figure 73: Saudi Arabia Chlorobenzene Industry Revenue Share (%), by Country 2025 & 2033
- Figure 74: Saudi Arabia Chlorobenzene Industry Volume Share (%), by Country 2025 & 2033
List of Tables
- Table 1: Global Chlorobenzene Industry Revenue million Forecast, by Type 2020 & 2033
- Table 2: Global Chlorobenzene Industry Volume K Tons Forecast, by Type 2020 & 2033
- Table 3: Global Chlorobenzene Industry Revenue million Forecast, by Application 2020 & 2033
- Table 4: Global Chlorobenzene Industry Volume K Tons Forecast, by Application 2020 & 2033
- Table 5: Global Chlorobenzene Industry Revenue million Forecast, by Region 2020 & 2033
- Table 6: Global Chlorobenzene Industry Volume K Tons Forecast, by Region 2020 & 2033
- Table 7: Global Chlorobenzene Industry Revenue million Forecast, by Type 2020 & 2033
- Table 8: Global Chlorobenzene Industry Volume K Tons Forecast, by Type 2020 & 2033
- Table 9: Global Chlorobenzene Industry Revenue million Forecast, by Application 2020 & 2033
- Table 10: Global Chlorobenzene Industry Volume K Tons Forecast, by Application 2020 & 2033
- Table 11: Global Chlorobenzene Industry Revenue million Forecast, by Country 2020 & 2033
- Table 12: Global Chlorobenzene Industry Volume K Tons Forecast, by Country 2020 & 2033
- Table 13: China Chlorobenzene Industry Revenue (million) Forecast, by Application 2020 & 2033
- Table 14: China Chlorobenzene Industry Volume (K Tons) Forecast, by Application 2020 & 2033
- Table 15: India Chlorobenzene Industry Revenue (million) Forecast, by Application 2020 & 2033
- Table 16: India Chlorobenzene Industry Volume (K Tons) Forecast, by Application 2020 & 2033
- Table 17: Japan Chlorobenzene Industry Revenue (million) Forecast, by Application 2020 & 2033
- Table 18: Japan Chlorobenzene Industry Volume (K Tons) Forecast, by Application 2020 & 2033
- Table 19: South Korea Chlorobenzene Industry Revenue (million) Forecast, by Application 2020 & 2033
- Table 20: South Korea Chlorobenzene Industry Volume (K Tons) Forecast, by Application 2020 & 2033
- Table 21: Malaysia Chlorobenzene Industry Revenue (million) Forecast, by Application 2020 & 2033
- Table 22: Malaysia Chlorobenzene Industry Volume (K Tons) Forecast, by Application 2020 & 2033
- Table 23: Thailand Chlorobenzene Industry Revenue (million) Forecast, by Application 2020 & 2033
- Table 24: Thailand Chlorobenzene Industry Volume (K Tons) Forecast, by Application 2020 & 2033
- Table 25: Indonesia Chlorobenzene Industry Revenue (million) Forecast, by Application 2020 & 2033
- Table 26: Indonesia Chlorobenzene Industry Volume (K Tons) Forecast, by Application 2020 & 2033
- Table 27: Vietnam Chlorobenzene Industry Revenue (million) Forecast, by Application 2020 & 2033
- Table 28: Vietnam Chlorobenzene Industry Volume (K Tons) Forecast, by Application 2020 & 2033
- Table 29: Rest of Asia Pacific Chlorobenzene Industry Revenue (million) Forecast, by Application 2020 & 2033
- Table 30: Rest of Asia Pacific Chlorobenzene Industry Volume (K Tons) Forecast, by Application 2020 & 2033
- Table 31: Global Chlorobenzene Industry Revenue million Forecast, by Type 2020 & 2033
- Table 32: Global Chlorobenzene Industry Volume K Tons Forecast, by Type 2020 & 2033
- Table 33: Global Chlorobenzene Industry Revenue million Forecast, by Application 2020 & 2033
- Table 34: Global Chlorobenzene Industry Volume K Tons Forecast, by Application 2020 & 2033
- Table 35: Global Chlorobenzene Industry Revenue million Forecast, by Country 2020 & 2033
- Table 36: Global Chlorobenzene Industry Volume K Tons Forecast, by Country 2020 & 2033
- Table 37: United States Chlorobenzene Industry Revenue (million) Forecast, by Application 2020 & 2033
- Table 38: United States Chlorobenzene Industry Volume (K Tons) Forecast, by Application 2020 & 2033
- Table 39: Canada Chlorobenzene Industry Revenue (million) Forecast, by Application 2020 & 2033
- Table 40: Canada Chlorobenzene Industry Volume (K Tons) Forecast, by Application 2020 & 2033
- Table 41: Mexico Chlorobenzene Industry Revenue (million) Forecast, by Application 2020 & 2033
- Table 42: Mexico Chlorobenzene Industry Volume (K Tons) Forecast, by Application 2020 & 2033
- Table 43: Global Chlorobenzene Industry Revenue million Forecast, by Type 2020 & 2033
- Table 44: Global Chlorobenzene Industry Volume K Tons Forecast, by Type 2020 & 2033
- Table 45: Global Chlorobenzene Industry Revenue million Forecast, by Application 2020 & 2033
- Table 46: Global Chlorobenzene Industry Volume K Tons Forecast, by Application 2020 & 2033
- Table 47: Global Chlorobenzene Industry Revenue million Forecast, by Country 2020 & 2033
- Table 48: Global Chlorobenzene Industry Volume K Tons Forecast, by Country 2020 & 2033
- Table 49: Germany Chlorobenzene Industry Revenue (million) Forecast, by Application 2020 & 2033
- Table 50: Germany Chlorobenzene Industry Volume (K Tons) Forecast, by Application 2020 & 2033
- Table 51: United Kingdom Chlorobenzene Industry Revenue (million) Forecast, by Application 2020 & 2033
- Table 52: United Kingdom Chlorobenzene Industry Volume (K Tons) Forecast, by Application 2020 & 2033
- Table 53: France Chlorobenzene Industry Revenue (million) Forecast, by Application 2020 & 2033
- Table 54: France Chlorobenzene Industry Volume (K Tons) Forecast, by Application 2020 & 2033
- Table 55: Italy Chlorobenzene Industry Revenue (million) Forecast, by Application 2020 & 2033
- Table 56: Italy Chlorobenzene Industry Volume (K Tons) Forecast, by Application 2020 & 2033
- Table 57: Spain Chlorobenzene Industry Revenue (million) Forecast, by Application 2020 & 2033
- Table 58: Spain Chlorobenzene Industry Volume (K Tons) Forecast, by Application 2020 & 2033
- Table 59: Nordic Chlorobenzene Industry Revenue (million) Forecast, by Application 2020 & 2033
- Table 60: Nordic Chlorobenzene Industry Volume (K Tons) Forecast, by Application 2020 & 2033
- Table 61: Turkey Chlorobenzene Industry Revenue (million) Forecast, by Application 2020 & 2033
- Table 62: Turkey Chlorobenzene Industry Volume (K Tons) Forecast, by Application 2020 & 2033
- Table 63: Russia Chlorobenzene Industry Revenue (million) Forecast, by Application 2020 & 2033
- Table 64: Russia Chlorobenzene Industry Volume (K Tons) Forecast, by Application 2020 & 2033
- Table 65: Rest of Europe Chlorobenzene Industry Revenue (million) Forecast, by Application 2020 & 2033
- Table 66: Rest of Europe Chlorobenzene Industry Volume (K Tons) Forecast, by Application 2020 & 2033
- Table 67: Global Chlorobenzene Industry Revenue million Forecast, by Type 2020 & 2033
- Table 68: Global Chlorobenzene Industry Volume K Tons Forecast, by Type 2020 & 2033
- Table 69: Global Chlorobenzene Industry Revenue million Forecast, by Application 2020 & 2033
- Table 70: Global Chlorobenzene Industry Volume K Tons Forecast, by Application 2020 & 2033
- Table 71: Global Chlorobenzene Industry Revenue million Forecast, by Country 2020 & 2033
- Table 72: Global Chlorobenzene Industry Volume K Tons Forecast, by Country 2020 & 2033
- Table 73: Brazil Chlorobenzene Industry Revenue (million) Forecast, by Application 2020 & 2033
- Table 74: Brazil Chlorobenzene Industry Volume (K Tons) Forecast, by Application 2020 & 2033
- Table 75: Argentina Chlorobenzene Industry Revenue (million) Forecast, by Application 2020 & 2033
- Table 76: Argentina Chlorobenzene Industry Volume (K Tons) Forecast, by Application 2020 & 2033
- Table 77: Colombia Chlorobenzene Industry Revenue (million) Forecast, by Application 2020 & 2033
- Table 78: Colombia Chlorobenzene Industry Volume (K Tons) Forecast, by Application 2020 & 2033
- Table 79: Rest of South America Chlorobenzene Industry Revenue (million) Forecast, by Application 2020 & 2033
- Table 80: Rest of South America Chlorobenzene Industry Volume (K Tons) Forecast, by Application 2020 & 2033
- Table 81: Global Chlorobenzene Industry Revenue million Forecast, by Type 2020 & 2033
- Table 82: Global Chlorobenzene Industry Volume K Tons Forecast, by Type 2020 & 2033
- Table 83: Global Chlorobenzene Industry Revenue million Forecast, by Application 2020 & 2033
- Table 84: Global Chlorobenzene Industry Volume K Tons Forecast, by Application 2020 & 2033
- Table 85: Global Chlorobenzene Industry Revenue million Forecast, by Country 2020 & 2033
- Table 86: Global Chlorobenzene Industry Volume K Tons Forecast, by Country 2020 & 2033
- Table 87: Global Chlorobenzene Industry Revenue million Forecast, by Type 2020 & 2033
- Table 88: Global Chlorobenzene Industry Volume K Tons Forecast, by Type 2020 & 2033
- Table 89: Global Chlorobenzene Industry Revenue million Forecast, by Application 2020 & 2033
- Table 90: Global Chlorobenzene Industry Volume K Tons Forecast, by Application 2020 & 2033
- Table 91: Global Chlorobenzene Industry Revenue million Forecast, by Country 2020 & 2033
- Table 92: Global Chlorobenzene Industry Volume K Tons Forecast, by Country 2020 & 2033
- Table 93: South Africa Chlorobenzene Industry Revenue (million) Forecast, by Application 2020 & 2033
- Table 94: South Africa Chlorobenzene Industry Volume (K Tons) Forecast, by Application 2020 & 2033
- Table 95: Nigeria Chlorobenzene Industry Revenue (million) Forecast, by Application 2020 & 2033
- Table 96: Nigeria Chlorobenzene Industry Volume (K Tons) Forecast, by Application 2020 & 2033
- Table 97: Qatar Chlorobenzene Industry Revenue (million) Forecast, by Application 2020 & 2033
- Table 98: Qatar Chlorobenzene Industry Volume (K Tons) Forecast, by Application 2020 & 2033
- Table 99: Egypt Chlorobenzene Industry Revenue (million) Forecast, by Application 2020 & 2033
- Table 100: Egypt Chlorobenzene Industry Volume (K Tons) Forecast, by Application 2020 & 2033
- Table 101: United Arab Emirates Chlorobenzene Industry Revenue (million) Forecast, by Application 2020 & 2033
- Table 102: United Arab Emirates Chlorobenzene Industry Volume (K Tons) Forecast, by Application 2020 & 2033
- Table 103: Rest of Middle East Chlorobenzene Industry Revenue (million) Forecast, by Application 2020 & 2033
- Table 104: Rest of Middle East Chlorobenzene Industry Volume (K Tons) Forecast, by Application 2020 & 2033
Frequently Asked Questions
1. What is the projected Compound Annual Growth Rate (CAGR) of the Chlorobenzene Industry?
The projected CAGR is approximately 3.5%.
2. Which companies are prominent players in the Chlorobenzene Industry?
Key companies in the market include Jiangsu Yangnong Chemicals Group Co Ltd, China Petrochemical Corporation, ITW Reagents Division (PanReac Applichem), J&K Scientific Ltd, Anhui Bayi Chemical Industry, Chemada Fine Chemicals, Kureha Corporation, Tianjin Bohai Chemical Industry Co Ltd , Meryer (Shanghai) Chemical Technology Co Ltd, Lanxess.
3. What are the main segments of the Chlorobenzene Industry?
The market segments include Type, Application.
4. Can you provide details about the market size?
The market size is estimated to be USD 2357 million as of 2022.
5. What are some drivers contributing to market growth?
Rising demand for Nitrochlorobenzene; Surging Application in the Chemical Industry; Other Drivers.
6. What are the notable trends driving market growth?
Nitrochlorobenzenes to Dominate the Market.
7. Are there any restraints impacting market growth?
Detrimental Effects of Chlorobenzene Exposure; Other Restraints.
8. Can you provide examples of recent developments in the market?
N/A
9. What pricing options are available for accessing the report?
Pricing options include single-user, multi-user, and enterprise licenses priced at USD 4750, USD 5250, and USD 8750 respectively.
10. Is the market size provided in terms of value or volume?
The market size is provided in terms of value, measured in million and volume, measured in K Tons.
11. Are there any specific market keywords associated with the report?
Yes, the market keyword associated with the report is "Chlorobenzene Industry," which aids in identifying and referencing the specific market segment covered.
12. How do I determine which pricing option suits my needs best?
The pricing options vary based on user requirements and access needs. Individual users may opt for single-user licenses, while businesses requiring broader access may choose multi-user or enterprise licenses for cost-effective access to the report.
13. Are there any additional resources or data provided in the Chlorobenzene Industry report?
While the report offers comprehensive insights, it's advisable to review the specific contents or supplementary materials provided to ascertain if additional resources or data are available.
14. How can I stay updated on further developments or reports in the Chlorobenzene Industry?
To stay informed about further developments, trends, and reports in the Chlorobenzene Industry, consider subscribing to industry newsletters, following relevant companies and organizations, or regularly checking reputable industry news sources and publications.
Methodology
Step 1 - Identification of Relevant Samples Size from Population Database


Step 2 - Approaches for Defining Global Market Size (Value, Volume* & Price*)

Note*: In applicable scenarios
Step 3 - Data Sources
Primary Research
- Web Analytics
- Survey Reports
- Research Institute
- Latest Research Reports
- Opinion Leaders
Secondary Research
- Annual Reports
- White Paper
- Latest Press Release
- Industry Association
- Paid Database
- Investor Presentations

Step 4 - Data Triangulation
Involves using different sources of information in order to increase the validity of a study
These sources are likely to be stakeholders in a program - participants, other researchers, program staff, other community members, and so on.
Then we put all data in single framework & apply various statistical tools to find out the dynamic on the market.
During the analysis stage, feedback from the stakeholder groups would be compared to determine areas of agreement as well as areas of divergence

