Key Insights
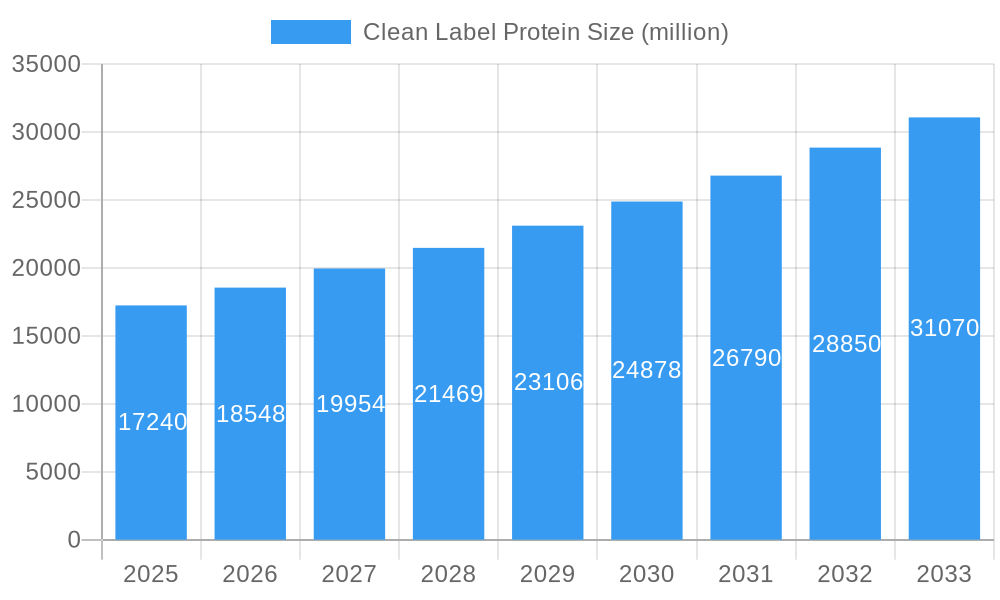
The clean label protein market, valued at $17.24 billion in 2025, is projected to experience robust growth, driven by a Compound Annual Growth Rate (CAGR) of 7.6% from 2025 to 2033. This expansion is fueled by several key factors. Increasing consumer awareness of health and wellness, coupled with a growing preference for natural and minimally processed foods, is significantly boosting demand for clean label protein ingredients. Consumers are actively seeking products with transparent and easily understandable ingredient lists, shunning artificial additives and synthetic ingredients. This trend is particularly strong among health-conscious millennials and Gen Z, who are driving the adoption of plant-based protein sources and functional foods. Furthermore, the rising prevalence of chronic diseases and the growing focus on preventative healthcare are contributing to the market’s expansion. The demand for clean label protein extends across various applications, including food and beverages, dietary supplements, and animal feed, creating diverse avenues for market growth.
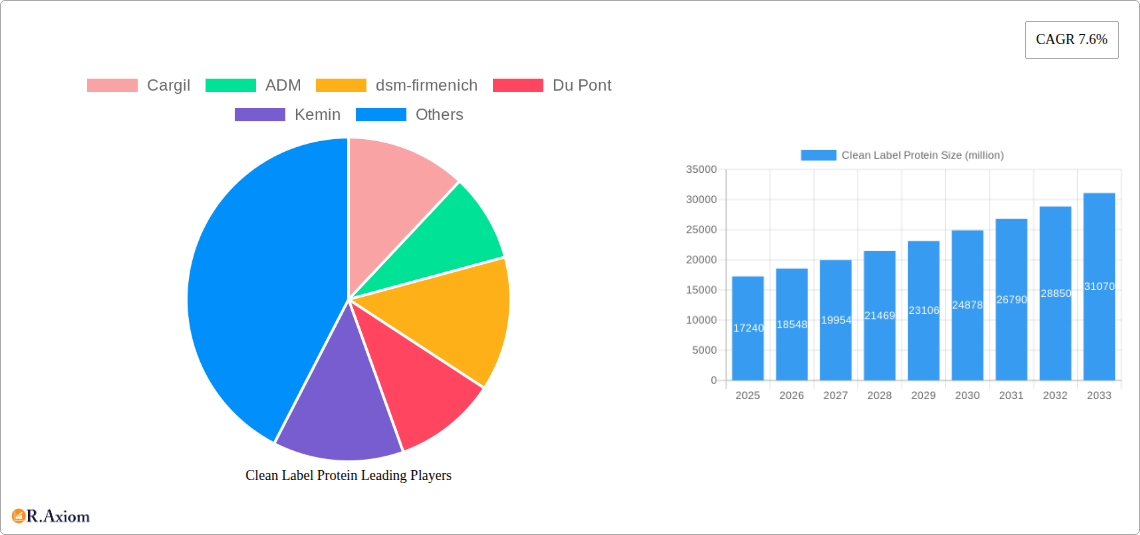
Clean Label Protein Market Size (In Billion)
Significant players like Cargill, ADM, DSM-Firmenich, and DuPont are investing heavily in research and development to produce innovative, clean-label protein solutions that meet diverse consumer needs and preferences. The market is witnessing the emergence of novel protein sources, including pea protein, brown rice protein, and various other plant-based options, alongside advancements in processing techniques that enhance the nutritional value and functionality of these ingredients. However, challenges remain, primarily in maintaining cost-effectiveness while ensuring high-quality standards and addressing potential supply chain limitations in sourcing sustainable, clean label ingredients. The ongoing emphasis on transparency and traceability throughout the supply chain will continue to shape industry dynamics, fostering innovation and competition within this rapidly expanding market segment.
Clean Label Protein Company Market Share
Clean Label Protein Market Report: 2019-2033 Forecast
This comprehensive report provides a detailed analysis of the global Clean Label Protein market, offering invaluable insights for industry stakeholders, investors, and strategic decision-makers. The study period covers 2019-2033, with 2025 serving as the base and estimated year. The report forecasts market trends from 2025-2033, analyzing historical data from 2019-2024. The report quantifies market values in millions.
Clean Label Protein Market Concentration & Innovation
This section analyzes the competitive landscape of the clean label protein market, evaluating market concentration, innovation drivers, regulatory influences, and market dynamics. The report examines the strategic activities of key players, including mergers and acquisitions (M&A), assessing their impact on market share and competitive dynamics.
Market Concentration: The global clean label protein market exhibits a moderately concentrated structure, with the top five players—Cargill, ADM, DSM-Firmenich, DuPont, and Ingredion Incorporated—holding an estimated xx% market share in 2025. Smaller players like InnovoPro and Beneo are actively pursuing niche market segments to gain traction.
Innovation Drivers: The demand for clean label protein is fueled by increasing consumer awareness of ingredient provenance and health concerns. Innovation focuses on developing sustainable, plant-based protein sources, improving product functionalities, and enhancing nutritional profiles.
Regulatory Frameworks: Government regulations concerning food labeling and ingredient safety significantly impact the market. Compliance requirements drive innovation in ingredient sourcing and processing.
Product Substitutes: Competition comes from conventional protein sources and emerging alternatives. This necessitates continuous product innovation to maintain a competitive edge.
End-User Trends: The growing popularity of plant-based diets, functional foods, and clean-label products significantly increases demand for clean-label protein ingredients.
M&A Activities: The clean label protein industry witnesses a surge in M&A activities, with deal values exceeding $xx million in the past five years. These acquisitions allow larger companies to expand their product portfolios and market reach.
Clean Label Protein Industry Trends & Insights
This section explores the key trends and insights shaping the clean label protein market. It examines market growth drivers, technological disruptions, changing consumer preferences, and competitive dynamics.
The global clean label protein market is experiencing robust growth, driven by rising consumer demand for healthier and more transparent food products. The market is expected to register a Compound Annual Growth Rate (CAGR) of xx% during the forecast period (2025-2033). This growth is primarily attributed to several factors, including the increasing prevalence of health and wellness trends and heightened awareness among consumers regarding food ingredients. The rising popularity of vegan and vegetarian lifestyles is also a significant growth catalyst. Technological advancements in protein extraction and processing techniques are paving the way for innovative, sustainable, and cost-effective solutions. However, competitive pressures among existing players and the emergence of new entrants remain significant aspects of the market landscape. Market penetration is increasing steadily across diverse food and beverage applications, exceeding xx% in key regions.
Dominant Markets & Segments in Clean Label Protein
This section pinpoints leading regions, countries, and market segments within the clean label protein sector. The analysis focuses on the factors contributing to their dominance.
Leading Region: North America dominates the global clean label protein market due to high consumer demand for healthy and functional food products, coupled with strong regulatory frameworks supporting ingredient transparency.
Key Drivers (North America):
- Strong consumer awareness of health and wellness.
- High disposable income levels.
- Well-established food processing and distribution infrastructure.
- Favorable government regulations supporting clean label products.
Dominance Analysis: North America's dominance is attributed to a confluence of factors, including high consumer spending on premium food products, the presence of major food manufacturers and ingredient suppliers, and a proactive regulatory environment promoting transparency and clean labeling practices. European and Asia-Pacific markets are exhibiting rapid growth but lag behind North America.
Clean Label Protein Product Developments
This section summarizes recent product innovations, applications, and competitive advantages in the clean label protein market, highlighting technological advancements and market fit.
Recent innovations focus on developing plant-based proteins with improved functionalities (e.g., solubility, emulsification, texture) and enhanced nutritional profiles. These new products find applications in a wide range of food and beverage items, including meat alternatives, dairy analogs, protein bars, and baked goods. The emphasis on sustainability and eco-friendly production methods drives market competitiveness.
Report Scope & Segmentation Analysis
The report segments the clean label protein market based on several key parameters, offering detailed insights into each segment's size, growth, and competitive dynamics. Segmentations include (but are not limited to) protein source (e.g., soy, pea, brown rice, etc.), application (e.g., food and beverage, animal feed), and region (e.g., North America, Europe, Asia-Pacific). Detailed growth projections and market sizes are provided for each segment.
Key Drivers of Clean Label Protein Growth
The growth of the clean label protein market is driven by several factors:
- Technological Advancements: Innovations in protein extraction and processing techniques improve yield, reduce costs, and enhance product quality.
- Economic Factors: Increasing disposable incomes, particularly in developing economies, bolster consumer spending on premium food items.
- Regulatory Support: Government policies that promote clean labeling and food transparency stimulate market growth.
Challenges in the Clean Label Protein Sector
The clean label protein market faces several challenges:
- Regulatory Hurdles: Varying regulations across different regions create complexities in product development and market entry.
- Supply Chain Issues: Ensuring consistent supply and maintaining product quality throughout the supply chain pose operational challenges.
- Competitive Pressures: Intense competition among existing players and the emergence of new entrants create pricing pressures.
Emerging Opportunities in Clean Label Protein
Emerging opportunities include:
- New Markets: Expanding into developing economies presents significant growth potential.
- New Technologies: Precision fermentation and other emerging technologies offer innovative solutions for protein production.
- Consumer Preferences: Capitalizing on evolving consumer preferences towards plant-based foods presents a key opportunity.
Leading Players in the Clean Label Protein Market
- Cargill
- ADM
- dsm-firmenich
- Du Pont
- Kemin
- Ebro Group
- Beneo
- IFF (International Flavors & Fragrances Inc)
- Ingredion Incorporated
- InnovoPro
- A&B Ingredients
- Avebe
- Coctio
- Florida Food Products
- Symega
- CSM Ingredients (HIFOOD)
- The Scoular Company
- Etprotein
Key Developments in Clean Label Protein Industry
- [Month, Year]: Company X launches a new line of pea-based protein products.
- [Month, Year]: Company Y announces a strategic partnership to expand its clean label protein portfolio.
- [Month, Year]: New regulations on food labeling are implemented in Region Z.
Strategic Outlook for Clean Label Protein Market
The clean label protein market holds immense future potential, driven by sustained consumer demand for healthy and transparent food products. Technological advancements, coupled with favorable regulatory environments, will further propel market growth. Companies focusing on innovation, sustainability, and strategic partnerships will be well-positioned to capture significant market share.
Clean Label Protein Segmentation
-
1. Application
- 1.1. Food
- 1.2. Pet Food
- 1.3. Feed
- 1.4. Other
-
2. Type
- 2.1. Plant-derived
- 2.2. Animal-derived
- 2.3. Insect-derived
Clean Label Protein Segmentation By Geography
-
1. North America
- 1.1. United States
- 1.2. Canada
- 1.3. Mexico
-
2. South America
- 2.1. Brazil
- 2.2. Argentina
- 2.3. Rest of South America
-
3. Europe
- 3.1. United Kingdom
- 3.2. Germany
- 3.3. France
- 3.4. Italy
- 3.5. Spain
- 3.6. Russia
- 3.7. Benelux
- 3.8. Nordics
- 3.9. Rest of Europe
-
4. Middle East & Africa
- 4.1. Turkey
- 4.2. Israel
- 4.3. GCC
- 4.4. North Africa
- 4.5. South Africa
- 4.6. Rest of Middle East & Africa
-
5. Asia Pacific
- 5.1. China
- 5.2. India
- 5.3. Japan
- 5.4. South Korea
- 5.5. ASEAN
- 5.6. Oceania
- 5.7. Rest of Asia Pacific
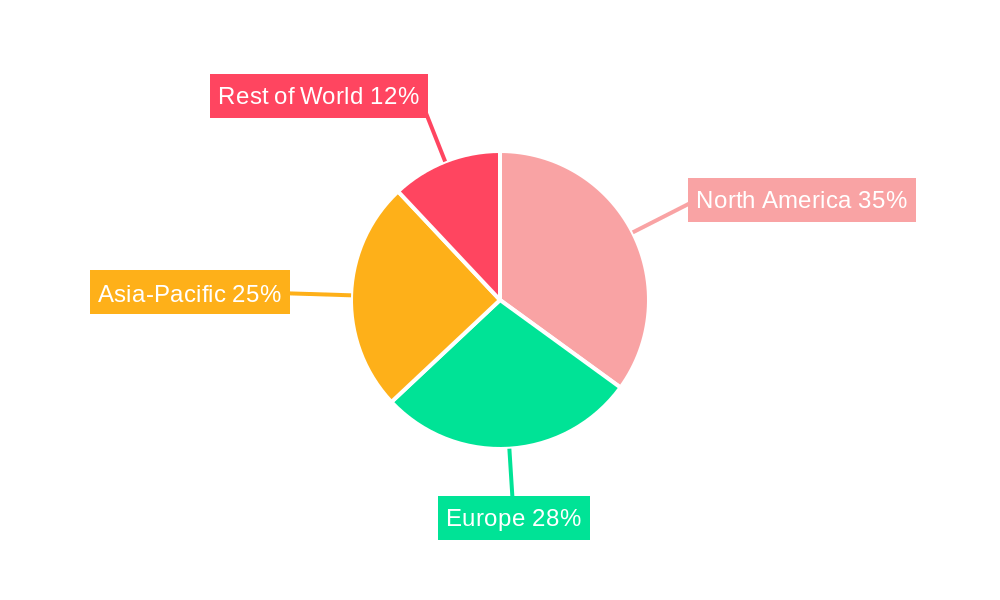
Clean Label Protein Regional Market Share
Geographic Coverage of Clean Label Protein
Clean Label Protein REPORT HIGHLIGHTS
| Aspects | Details |
|---|---|
| Study Period | 2020-2034 |
| Base Year | 2025 |
| Estimated Year | 2026 |
| Forecast Period | 2026-2034 |
| Historical Period | 2020-2025 |
| Growth Rate | CAGR of 7.6% from 2020-2034 |
| Segmentation |
|
Table of Contents
- 1. Introduction
- 1.1. Research Scope
- 1.2. Market Segmentation
- 1.3. Research Methodology
- 1.4. Definitions and Assumptions
- 2. Executive Summary
- 2.1. Introduction
- 3. Market Dynamics
- 3.1. Introduction
- 3.2. Market Drivers
- 3.3. Market Restrains
- 3.4. Market Trends
- 4. Market Factor Analysis
- 4.1. Porters Five Forces
- 4.2. Supply/Value Chain
- 4.3. PESTEL analysis
- 4.4. Market Entropy
- 4.5. Patent/Trademark Analysis
- 5. Global Clean Label Protein Analysis, Insights and Forecast, 2020-2032
- 5.1. Market Analysis, Insights and Forecast - by Application
- 5.1.1. Food
- 5.1.2. Pet Food
- 5.1.3. Feed
- 5.1.4. Other
- 5.2. Market Analysis, Insights and Forecast - by Type
- 5.2.1. Plant-derived
- 5.2.2. Animal-derived
- 5.2.3. Insect-derived
- 5.3. Market Analysis, Insights and Forecast - by Region
- 5.3.1. North America
- 5.3.2. South America
- 5.3.3. Europe
- 5.3.4. Middle East & Africa
- 5.3.5. Asia Pacific
- 5.1. Market Analysis, Insights and Forecast - by Application
- 6. North America Clean Label Protein Analysis, Insights and Forecast, 2020-2032
- 6.1. Market Analysis, Insights and Forecast - by Application
- 6.1.1. Food
- 6.1.2. Pet Food
- 6.1.3. Feed
- 6.1.4. Other
- 6.2. Market Analysis, Insights and Forecast - by Type
- 6.2.1. Plant-derived
- 6.2.2. Animal-derived
- 6.2.3. Insect-derived
- 6.1. Market Analysis, Insights and Forecast - by Application
- 7. South America Clean Label Protein Analysis, Insights and Forecast, 2020-2032
- 7.1. Market Analysis, Insights and Forecast - by Application
- 7.1.1. Food
- 7.1.2. Pet Food
- 7.1.3. Feed
- 7.1.4. Other
- 7.2. Market Analysis, Insights and Forecast - by Type
- 7.2.1. Plant-derived
- 7.2.2. Animal-derived
- 7.2.3. Insect-derived
- 7.1. Market Analysis, Insights and Forecast - by Application
- 8. Europe Clean Label Protein Analysis, Insights and Forecast, 2020-2032
- 8.1. Market Analysis, Insights and Forecast - by Application
- 8.1.1. Food
- 8.1.2. Pet Food
- 8.1.3. Feed
- 8.1.4. Other
- 8.2. Market Analysis, Insights and Forecast - by Type
- 8.2.1. Plant-derived
- 8.2.2. Animal-derived
- 8.2.3. Insect-derived
- 8.1. Market Analysis, Insights and Forecast - by Application
- 9. Middle East & Africa Clean Label Protein Analysis, Insights and Forecast, 2020-2032
- 9.1. Market Analysis, Insights and Forecast - by Application
- 9.1.1. Food
- 9.1.2. Pet Food
- 9.1.3. Feed
- 9.1.4. Other
- 9.2. Market Analysis, Insights and Forecast - by Type
- 9.2.1. Plant-derived
- 9.2.2. Animal-derived
- 9.2.3. Insect-derived
- 9.1. Market Analysis, Insights and Forecast - by Application
- 10. Asia Pacific Clean Label Protein Analysis, Insights and Forecast, 2020-2032
- 10.1. Market Analysis, Insights and Forecast - by Application
- 10.1.1. Food
- 10.1.2. Pet Food
- 10.1.3. Feed
- 10.1.4. Other
- 10.2. Market Analysis, Insights and Forecast - by Type
- 10.2.1. Plant-derived
- 10.2.2. Animal-derived
- 10.2.3. Insect-derived
- 10.1. Market Analysis, Insights and Forecast - by Application
- 11. Competitive Analysis
- 11.1. Global Market Share Analysis 2025
- 11.2. Company Profiles
- 11.2.1 Cargil
- 11.2.1.1. Overview
- 11.2.1.2. Products
- 11.2.1.3. SWOT Analysis
- 11.2.1.4. Recent Developments
- 11.2.1.5. Financials (Based on Availability)
- 11.2.2 ADM
- 11.2.2.1. Overview
- 11.2.2.2. Products
- 11.2.2.3. SWOT Analysis
- 11.2.2.4. Recent Developments
- 11.2.2.5. Financials (Based on Availability)
- 11.2.3 dsm-firmenich
- 11.2.3.1. Overview
- 11.2.3.2. Products
- 11.2.3.3. SWOT Analysis
- 11.2.3.4. Recent Developments
- 11.2.3.5. Financials (Based on Availability)
- 11.2.4 Du Pont
- 11.2.4.1. Overview
- 11.2.4.2. Products
- 11.2.4.3. SWOT Analysis
- 11.2.4.4. Recent Developments
- 11.2.4.5. Financials (Based on Availability)
- 11.2.5 Kemin
- 11.2.5.1. Overview
- 11.2.5.2. Products
- 11.2.5.3. SWOT Analysis
- 11.2.5.4. Recent Developments
- 11.2.5.5. Financials (Based on Availability)
- 11.2.6 Ebro Group
- 11.2.6.1. Overview
- 11.2.6.2. Products
- 11.2.6.3. SWOT Analysis
- 11.2.6.4. Recent Developments
- 11.2.6.5. Financials (Based on Availability)
- 11.2.7 Beneo
- 11.2.7.1. Overview
- 11.2.7.2. Products
- 11.2.7.3. SWOT Analysis
- 11.2.7.4. Recent Developments
- 11.2.7.5. Financials (Based on Availability)
- 11.2.8 IFF (International Flavors & Fragrances Inc)
- 11.2.8.1. Overview
- 11.2.8.2. Products
- 11.2.8.3. SWOT Analysis
- 11.2.8.4. Recent Developments
- 11.2.8.5. Financials (Based on Availability)
- 11.2.9 Ingredion Incorporated
- 11.2.9.1. Overview
- 11.2.9.2. Products
- 11.2.9.3. SWOT Analysis
- 11.2.9.4. Recent Developments
- 11.2.9.5. Financials (Based on Availability)
- 11.2.10 InnovoPro
- 11.2.10.1. Overview
- 11.2.10.2. Products
- 11.2.10.3. SWOT Analysis
- 11.2.10.4. Recent Developments
- 11.2.10.5. Financials (Based on Availability)
- 11.2.11 A&B Ingredients
- 11.2.11.1. Overview
- 11.2.11.2. Products
- 11.2.11.3. SWOT Analysis
- 11.2.11.4. Recent Developments
- 11.2.11.5. Financials (Based on Availability)
- 11.2.12 Avebe
- 11.2.12.1. Overview
- 11.2.12.2. Products
- 11.2.12.3. SWOT Analysis
- 11.2.12.4. Recent Developments
- 11.2.12.5. Financials (Based on Availability)
- 11.2.13 Coctio
- 11.2.13.1. Overview
- 11.2.13.2. Products
- 11.2.13.3. SWOT Analysis
- 11.2.13.4. Recent Developments
- 11.2.13.5. Financials (Based on Availability)
- 11.2.14 Florida Food Products
- 11.2.14.1. Overview
- 11.2.14.2. Products
- 11.2.14.3. SWOT Analysis
- 11.2.14.4. Recent Developments
- 11.2.14.5. Financials (Based on Availability)
- 11.2.15 Symega
- 11.2.15.1. Overview
- 11.2.15.2. Products
- 11.2.15.3. SWOT Analysis
- 11.2.15.4. Recent Developments
- 11.2.15.5. Financials (Based on Availability)
- 11.2.16 CSM Ingredients (HIFOOD)
- 11.2.16.1. Overview
- 11.2.16.2. Products
- 11.2.16.3. SWOT Analysis
- 11.2.16.4. Recent Developments
- 11.2.16.5. Financials (Based on Availability)
- 11.2.17 The Scoular Company
- 11.2.17.1. Overview
- 11.2.17.2. Products
- 11.2.17.3. SWOT Analysis
- 11.2.17.4. Recent Developments
- 11.2.17.5. Financials (Based on Availability)
- 11.2.18 Etprotein
- 11.2.18.1. Overview
- 11.2.18.2. Products
- 11.2.18.3. SWOT Analysis
- 11.2.18.4. Recent Developments
- 11.2.18.5. Financials (Based on Availability)
- 11.2.1 Cargil
List of Figures
- Figure 1: Global Clean Label Protein Revenue Breakdown (million, %) by Region 2025 & 2033
- Figure 2: North America Clean Label Protein Revenue (million), by Application 2025 & 2033
- Figure 3: North America Clean Label Protein Revenue Share (%), by Application 2025 & 2033
- Figure 4: North America Clean Label Protein Revenue (million), by Type 2025 & 2033
- Figure 5: North America Clean Label Protein Revenue Share (%), by Type 2025 & 2033
- Figure 6: North America Clean Label Protein Revenue (million), by Country 2025 & 2033
- Figure 7: North America Clean Label Protein Revenue Share (%), by Country 2025 & 2033
- Figure 8: South America Clean Label Protein Revenue (million), by Application 2025 & 2033
- Figure 9: South America Clean Label Protein Revenue Share (%), by Application 2025 & 2033
- Figure 10: South America Clean Label Protein Revenue (million), by Type 2025 & 2033
- Figure 11: South America Clean Label Protein Revenue Share (%), by Type 2025 & 2033
- Figure 12: South America Clean Label Protein Revenue (million), by Country 2025 & 2033
- Figure 13: South America Clean Label Protein Revenue Share (%), by Country 2025 & 2033
- Figure 14: Europe Clean Label Protein Revenue (million), by Application 2025 & 2033
- Figure 15: Europe Clean Label Protein Revenue Share (%), by Application 2025 & 2033
- Figure 16: Europe Clean Label Protein Revenue (million), by Type 2025 & 2033
- Figure 17: Europe Clean Label Protein Revenue Share (%), by Type 2025 & 2033
- Figure 18: Europe Clean Label Protein Revenue (million), by Country 2025 & 2033
- Figure 19: Europe Clean Label Protein Revenue Share (%), by Country 2025 & 2033
- Figure 20: Middle East & Africa Clean Label Protein Revenue (million), by Application 2025 & 2033
- Figure 21: Middle East & Africa Clean Label Protein Revenue Share (%), by Application 2025 & 2033
- Figure 22: Middle East & Africa Clean Label Protein Revenue (million), by Type 2025 & 2033
- Figure 23: Middle East & Africa Clean Label Protein Revenue Share (%), by Type 2025 & 2033
- Figure 24: Middle East & Africa Clean Label Protein Revenue (million), by Country 2025 & 2033
- Figure 25: Middle East & Africa Clean Label Protein Revenue Share (%), by Country 2025 & 2033
- Figure 26: Asia Pacific Clean Label Protein Revenue (million), by Application 2025 & 2033
- Figure 27: Asia Pacific Clean Label Protein Revenue Share (%), by Application 2025 & 2033
- Figure 28: Asia Pacific Clean Label Protein Revenue (million), by Type 2025 & 2033
- Figure 29: Asia Pacific Clean Label Protein Revenue Share (%), by Type 2025 & 2033
- Figure 30: Asia Pacific Clean Label Protein Revenue (million), by Country 2025 & 2033
- Figure 31: Asia Pacific Clean Label Protein Revenue Share (%), by Country 2025 & 2033
List of Tables
- Table 1: Global Clean Label Protein Revenue million Forecast, by Application 2020 & 2033
- Table 2: Global Clean Label Protein Revenue million Forecast, by Type 2020 & 2033
- Table 3: Global Clean Label Protein Revenue million Forecast, by Region 2020 & 2033
- Table 4: Global Clean Label Protein Revenue million Forecast, by Application 2020 & 2033
- Table 5: Global Clean Label Protein Revenue million Forecast, by Type 2020 & 2033
- Table 6: Global Clean Label Protein Revenue million Forecast, by Country 2020 & 2033
- Table 7: United States Clean Label Protein Revenue (million) Forecast, by Application 2020 & 2033
- Table 8: Canada Clean Label Protein Revenue (million) Forecast, by Application 2020 & 2033
- Table 9: Mexico Clean Label Protein Revenue (million) Forecast, by Application 2020 & 2033
- Table 10: Global Clean Label Protein Revenue million Forecast, by Application 2020 & 2033
- Table 11: Global Clean Label Protein Revenue million Forecast, by Type 2020 & 2033
- Table 12: Global Clean Label Protein Revenue million Forecast, by Country 2020 & 2033
- Table 13: Brazil Clean Label Protein Revenue (million) Forecast, by Application 2020 & 2033
- Table 14: Argentina Clean Label Protein Revenue (million) Forecast, by Application 2020 & 2033
- Table 15: Rest of South America Clean Label Protein Revenue (million) Forecast, by Application 2020 & 2033
- Table 16: Global Clean Label Protein Revenue million Forecast, by Application 2020 & 2033
- Table 17: Global Clean Label Protein Revenue million Forecast, by Type 2020 & 2033
- Table 18: Global Clean Label Protein Revenue million Forecast, by Country 2020 & 2033
- Table 19: United Kingdom Clean Label Protein Revenue (million) Forecast, by Application 2020 & 2033
- Table 20: Germany Clean Label Protein Revenue (million) Forecast, by Application 2020 & 2033
- Table 21: France Clean Label Protein Revenue (million) Forecast, by Application 2020 & 2033
- Table 22: Italy Clean Label Protein Revenue (million) Forecast, by Application 2020 & 2033
- Table 23: Spain Clean Label Protein Revenue (million) Forecast, by Application 2020 & 2033
- Table 24: Russia Clean Label Protein Revenue (million) Forecast, by Application 2020 & 2033
- Table 25: Benelux Clean Label Protein Revenue (million) Forecast, by Application 2020 & 2033
- Table 26: Nordics Clean Label Protein Revenue (million) Forecast, by Application 2020 & 2033
- Table 27: Rest of Europe Clean Label Protein Revenue (million) Forecast, by Application 2020 & 2033
- Table 28: Global Clean Label Protein Revenue million Forecast, by Application 2020 & 2033
- Table 29: Global Clean Label Protein Revenue million Forecast, by Type 2020 & 2033
- Table 30: Global Clean Label Protein Revenue million Forecast, by Country 2020 & 2033
- Table 31: Turkey Clean Label Protein Revenue (million) Forecast, by Application 2020 & 2033
- Table 32: Israel Clean Label Protein Revenue (million) Forecast, by Application 2020 & 2033
- Table 33: GCC Clean Label Protein Revenue (million) Forecast, by Application 2020 & 2033
- Table 34: North Africa Clean Label Protein Revenue (million) Forecast, by Application 2020 & 2033
- Table 35: South Africa Clean Label Protein Revenue (million) Forecast, by Application 2020 & 2033
- Table 36: Rest of Middle East & Africa Clean Label Protein Revenue (million) Forecast, by Application 2020 & 2033
- Table 37: Global Clean Label Protein Revenue million Forecast, by Application 2020 & 2033
- Table 38: Global Clean Label Protein Revenue million Forecast, by Type 2020 & 2033
- Table 39: Global Clean Label Protein Revenue million Forecast, by Country 2020 & 2033
- Table 40: China Clean Label Protein Revenue (million) Forecast, by Application 2020 & 2033
- Table 41: India Clean Label Protein Revenue (million) Forecast, by Application 2020 & 2033
- Table 42: Japan Clean Label Protein Revenue (million) Forecast, by Application 2020 & 2033
- Table 43: South Korea Clean Label Protein Revenue (million) Forecast, by Application 2020 & 2033
- Table 44: ASEAN Clean Label Protein Revenue (million) Forecast, by Application 2020 & 2033
- Table 45: Oceania Clean Label Protein Revenue (million) Forecast, by Application 2020 & 2033
- Table 46: Rest of Asia Pacific Clean Label Protein Revenue (million) Forecast, by Application 2020 & 2033
Frequently Asked Questions
1. What is the projected Compound Annual Growth Rate (CAGR) of the Clean Label Protein?
The projected CAGR is approximately 7.6%.
2. Which companies are prominent players in the Clean Label Protein?
Key companies in the market include Cargil, ADM, dsm-firmenich, Du Pont, Kemin, Ebro Group, Beneo, IFF (International Flavors & Fragrances Inc), Ingredion Incorporated, InnovoPro, A&B Ingredients, Avebe, Coctio, Florida Food Products, Symega, CSM Ingredients (HIFOOD), The Scoular Company, Etprotein.
3. What are the main segments of the Clean Label Protein?
The market segments include Application, Type.
4. Can you provide details about the market size?
The market size is estimated to be USD 17240 million as of 2022.
5. What are some drivers contributing to market growth?
N/A
6. What are the notable trends driving market growth?
N/A
7. Are there any restraints impacting market growth?
N/A
8. Can you provide examples of recent developments in the market?
N/A
9. What pricing options are available for accessing the report?
Pricing options include single-user, multi-user, and enterprise licenses priced at USD 2900.00, USD 4350.00, and USD 5800.00 respectively.
10. Is the market size provided in terms of value or volume?
The market size is provided in terms of value, measured in million.
11. Are there any specific market keywords associated with the report?
Yes, the market keyword associated with the report is "Clean Label Protein," which aids in identifying and referencing the specific market segment covered.
12. How do I determine which pricing option suits my needs best?
The pricing options vary based on user requirements and access needs. Individual users may opt for single-user licenses, while businesses requiring broader access may choose multi-user or enterprise licenses for cost-effective access to the report.
13. Are there any additional resources or data provided in the Clean Label Protein report?
While the report offers comprehensive insights, it's advisable to review the specific contents or supplementary materials provided to ascertain if additional resources or data are available.
14. How can I stay updated on further developments or reports in the Clean Label Protein?
To stay informed about further developments, trends, and reports in the Clean Label Protein, consider subscribing to industry newsletters, following relevant companies and organizations, or regularly checking reputable industry news sources and publications.
Methodology
Step 1 - Identification of Relevant Samples Size from Population Database


Step 2 - Approaches for Defining Global Market Size (Value, Volume* & Price*)

Note*: In applicable scenarios
Step 3 - Data Sources
Primary Research
- Web Analytics
- Survey Reports
- Research Institute
- Latest Research Reports
- Opinion Leaders
Secondary Research
- Annual Reports
- White Paper
- Latest Press Release
- Industry Association
- Paid Database
- Investor Presentations

Step 4 - Data Triangulation
Involves using different sources of information in order to increase the validity of a study
These sources are likely to be stakeholders in a program - participants, other researchers, program staff, other community members, and so on.
Then we put all data in single framework & apply various statistical tools to find out the dynamic on the market.
During the analysis stage, feedback from the stakeholder groups would be compared to determine areas of agreement as well as areas of divergence

