
Key Insights
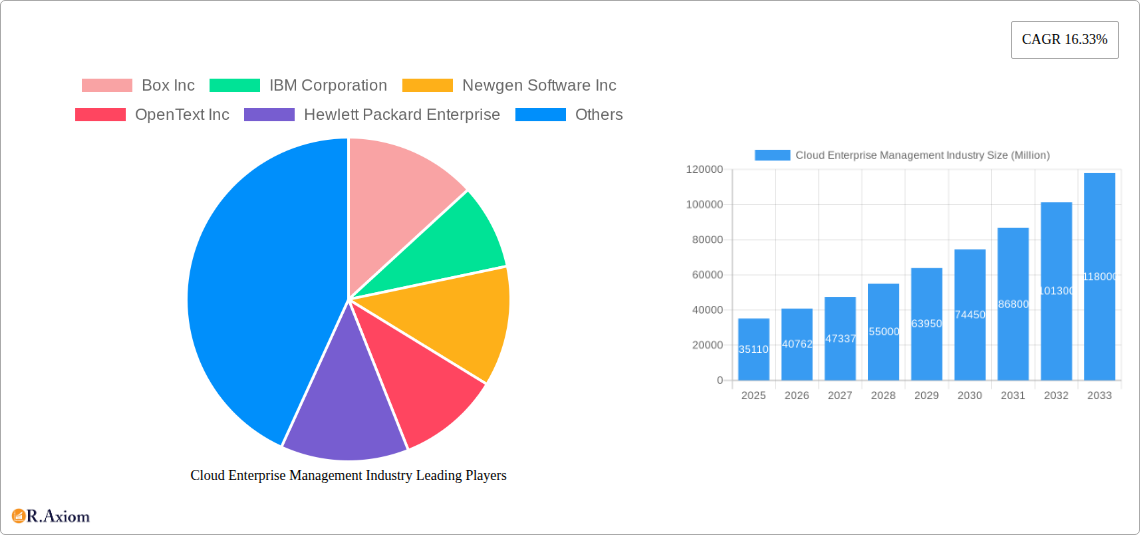
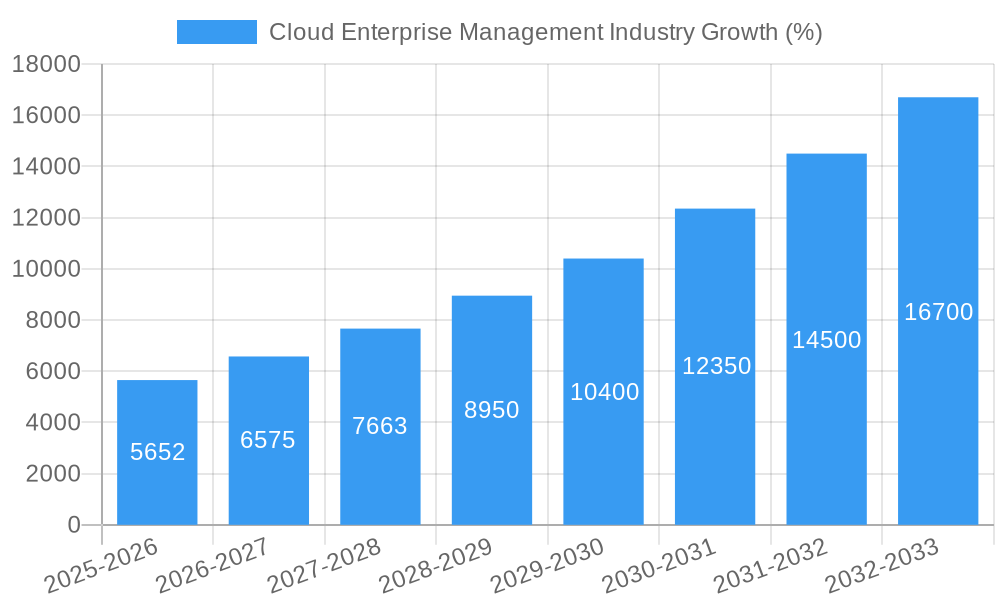
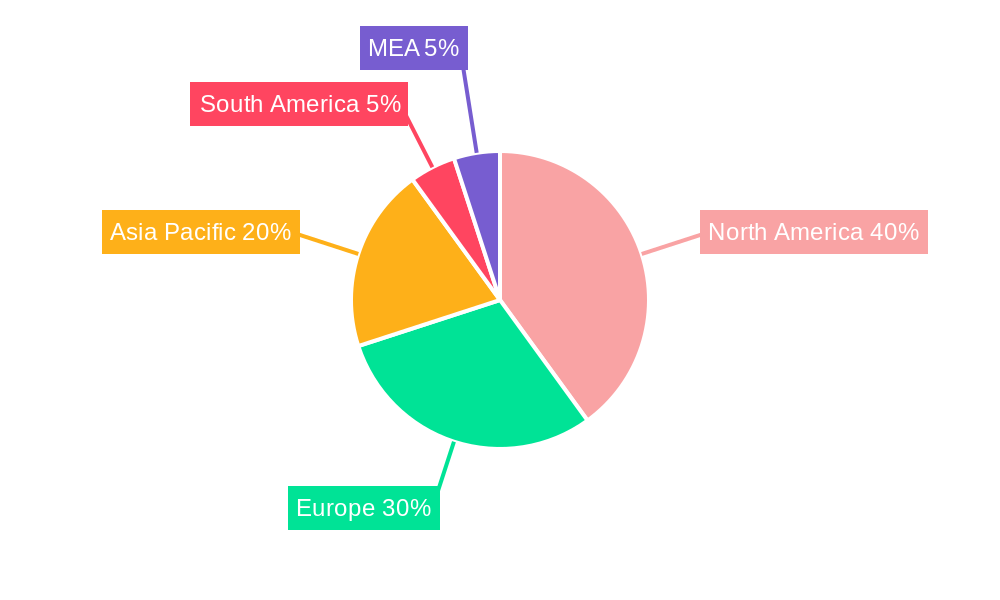
The Cloud Enterprise Content Management (ECM) market is experiencing robust growth, projected to reach \$35.11 billion in 2025 and exhibiting a Compound Annual Growth Rate (CAGR) of 16.33% from 2025 to 2033. This expansion is fueled by several key drivers. The increasing need for efficient data management and collaboration across geographically dispersed teams is a primary factor. Businesses are increasingly adopting cloud-based solutions to streamline workflows, improve operational efficiency, and reduce IT infrastructure costs. The rise of digital transformation initiatives across various industries, including BFSI (Banking, Financial Services, and Insurance), healthcare, and manufacturing, further accelerates market growth. Furthermore, stringent regulatory compliance requirements and the growing volume of unstructured data necessitate robust ECM solutions capable of handling diverse data types and ensuring data security. The market is segmented by service type (professional vs. managed), organization size (SMEs vs. large enterprises), solution type (content, case, workflow, record, and digital asset management), deployment model (public, private, and hybrid cloud), and end-user industry. Large enterprises currently dominate the market share, but the segment of small and medium-sized enterprises is expected to show significant growth driven by affordability and accessibility of cloud-based solutions. The North American market currently holds a substantial share due to early adoption and technological advancements, but the Asia-Pacific region is projected to experience the highest growth rate over the forecast period, fueled by increasing digitalization and economic expansion in countries like India and China. Competition is intense, with established players like IBM, Microsoft, and OpenText facing challenges from emerging cloud-native providers.
The continued growth of the Cloud ECM market will be influenced by several factors. Advancements in artificial intelligence (AI) and machine learning (ML) are expected to enhance ECM capabilities, enabling functionalities like automated content classification, intelligent search, and improved data analytics. The increasing adoption of hybrid cloud strategies will provide organizations with greater flexibility and control over their data. However, challenges remain, including concerns over data security and privacy, integration complexities with legacy systems, and the need for skilled personnel to manage and maintain cloud-based ECM solutions. The market will likely see increased consolidation through mergers and acquisitions as companies strive to expand their market reach and offer comprehensive solutions. The successful vendors will be those that can effectively address security concerns, offer seamless integration capabilities, and provide robust customer support and training.
Cloud Enterprise Management Industry: A Comprehensive Market Report (2019-2033)
This detailed report provides a comprehensive analysis of the Cloud Enterprise Management industry, covering market size, segmentation, key players, growth drivers, challenges, and future outlook. The study period spans from 2019 to 2033, with 2025 as the base and estimated year. The forecast period is 2025-2033, and the historical period covers 2019-2024. The report incorporates data from key players like Box Inc, IBM Corporation, Newgen Software Inc, OpenText Inc, Hewlett Packard Enterprise, Docuware GmbH, Lexmark International Inc, Xerox Corp, Oracle Corp, Microsoft Corp, and Alfresco Software Inc, and analyzes various market segments. The total market value in 2025 is estimated at $xx Million.
Cloud Enterprise Management Industry Market Concentration & Innovation
The Cloud Enterprise Management market exhibits a moderately concentrated landscape, with a few major players holding significant market share. While precise market share figures for each company require proprietary data, it's evident that companies like IBM, Microsoft, and Oracle hold substantial positions due to their established enterprise software portfolios and cloud infrastructure. However, the market is dynamic, witnessing increased competition from smaller, specialized vendors offering innovative solutions.
Market concentration is influenced by factors such as:
- High barriers to entry: Significant capital investment and expertise are needed to develop and maintain robust cloud enterprise management platforms.
- Strong brand recognition: Established players benefit from strong brand recognition and customer loyalty.
- Mergers and Acquisitions (M&A): The industry has seen considerable M&A activity in recent years, with deals valued at $xx Million annually, primarily aiming to expand product offerings and market reach. Notable acquisitions include (specific examples need further research).
- Technological innovation: Continuous innovation in areas like AI, automation, and security drives competition and market consolidation.
- Regulatory frameworks: Data privacy regulations (like GDPR) influence market dynamics, creating opportunities for compliant solutions and potentially hindering the growth of vendors who don't meet these standards.
- Product substitutes: Open-source alternatives and specialized solutions from smaller vendors pose a competitive threat.
- End-user trends: The increasing adoption of cloud technologies across various industries is the primary growth driver for this market.
Cloud Enterprise Management Industry Industry Trends & Insights
The Cloud Enterprise Management market is experiencing robust growth, with a projected Compound Annual Growth Rate (CAGR) of xx% during the forecast period (2025-2033). This growth is fueled by several factors:
- Rising demand for cloud-based solutions: Organizations are increasingly migrating their enterprise management functions to the cloud to enhance scalability, efficiency, and cost-effectiveness. Market penetration for cloud-based enterprise management solutions is projected to reach xx% by 2033.
- Technological advancements: Integration of AI, machine learning, and automation into cloud platforms is driving efficiency and creating new opportunities.
- Growing adoption of hybrid and multi-cloud environments: This trend necessitates robust management solutions capable of handling complexity across different cloud providers.
- Increased focus on data security and compliance: Concerns surrounding data privacy and security are driving demand for sophisticated security features within cloud enterprise management platforms.
- Shifting consumer preferences: Businesses are increasingly prioritizing user-friendly, intuitive interfaces and seamless integration with existing systems.
- Competitive landscape: Intense competition fosters innovation and forces vendors to enhance their solutions to maintain a competitive edge.
Dominant Markets & Segments in Cloud Enterprise Management Industry
The North American region is currently the dominant market for Cloud Enterprise Management, driven by high cloud adoption rates and strong technological infrastructure. However, Asia-Pacific is projected to experience significant growth over the forecast period.
Dominant Segments:
- By Service: Managed services represent a larger market share due to the outsourcing of complex management tasks.
- By Organization Size: Large enterprises dominate the market due to their higher budgets and more complex management requirements.
- By Solution: Content Management holds a prominent market share due to its widespread application across various industries.
- By Deployment Model: The public cloud segment is expanding rapidly due to its scalability and cost advantages.
- By End-user Industry: BFSI (Banking, Financial Services, and Insurance) and IT & Telecom are key end-user segments owing to stringent regulatory compliance and a focus on digital transformation.
Key Drivers of Segment Dominance:
- Economic policies: Government initiatives supporting digital transformation and cloud adoption.
- Technological infrastructure: Robust broadband connectivity and data center infrastructure.
- Regulatory frameworks: Data privacy regulations creating demand for secure solutions.
Cloud Enterprise Management Industry Product Developments
Recent product innovations in the Cloud Enterprise Management industry focus on enhanced automation, AI-powered insights, improved security features, and seamless integration with various enterprise applications. Vendors are striving to offer user-friendly interfaces, simplified management consoles, and tailored solutions to meet the specific requirements of different industries. This leads to a better market fit and increased customer satisfaction.
Report Scope & Segmentation Analysis
This report comprehensively analyzes the Cloud Enterprise Management market across multiple segments: By Service (Professional, Managed), By Organization Size (SMEs, Large Enterprises), By Solution (Content Management, Case Management, Workflow Management, Record Management, Digital Asset Management, Other Solutions), By Deployment Model (Public Cloud, Private Cloud, Hybrid Cloud), and By End-user Industry (BFSI, Energy and Power, Medical and Healthcare, Manufacturing, Retail, IT and Telecom, Other End-user Industries). Each segment's growth projections, market size, and competitive dynamics are thoroughly assessed. Growth is expected to be fastest in the Public Cloud deployment model and within the rapidly-digitalizing Healthcare and Retail sectors.
Key Drivers of Cloud Enterprise Management Industry Growth
The growth of the Cloud Enterprise Management industry is fueled by several key drivers:
- Increased adoption of cloud computing: Businesses are increasingly migrating their IT infrastructure to the cloud to improve scalability and efficiency.
- Technological advancements: Innovations in areas such as AI, machine learning, and automation are enhancing the capabilities of Cloud Enterprise Management solutions.
- Stringent data privacy and security regulations: The need to comply with regulations such as GDPR is driving demand for secure cloud-based management systems.
Challenges in the Cloud Enterprise Management Industry Sector
The Cloud Enterprise Management industry faces challenges such as:
- Data security concerns: Ensuring the security of sensitive data stored in the cloud is crucial and is a significant concern for many businesses.
- Integration complexities: Integrating cloud-based management solutions with existing on-premise systems can be complex and time-consuming.
- Vendor lock-in: Businesses may be hesitant to switch vendors due to the potential for data loss or disruption during migration.
Emerging Opportunities in Cloud Enterprise Management Industry
Emerging opportunities include:
- Expansion into new markets: The industry is expanding into new geographic regions with growing cloud adoption rates.
- Development of innovative solutions: Advancements in areas such as AI and machine learning are creating opportunities for innovative solutions.
- Focus on industry-specific solutions: Tailoring solutions to meet the unique needs of different industries will be a key growth driver.
Leading Players in the Cloud Enterprise Management Industry Market
- Box Inc
- IBM Corporation
- Newgen Software Inc
- OpenText Inc
- Hewlett Packard Enterprise
- Docuware GmbH
- Lexmark International Inc
- Xerox Corp
- Oracle Corp
- Microsoft Corp
- Alfresco Software Inc
Key Developments in Cloud Enterprise Management Industry Industry
- March 2023: Newgen Software launched its OmniDocs Connector on Salesforce AppExchange, enhancing content management capabilities within the Salesforce ecosystem. This directly impacts market dynamics by improving the integration capabilities of existing content management solutions, thus increasing market share for Newgen and creating more collaborative opportunities for Salesforce users.
- February 2023: Hewlett Packard Enterprise collaborated with Nokia to offer a Cloud RAN solution, expanding their reach in the telecommunications sector. This partnership significantly improves the efficiency and market reach of both companies, directly influencing the market competitiveness within the CSP segment of Cloud Enterprise Management.
Strategic Outlook for Cloud Enterprise Management Industry Market
The Cloud Enterprise Management market is poised for continued growth, driven by increasing cloud adoption, technological advancements, and the growing need for efficient and secure management solutions. Opportunities exist for vendors to capitalize on the increasing demand for AI-powered insights, automation, and specialized solutions tailored to specific industries. The focus on security and compliance will continue to drive market expansion.
Cloud Enterprise Management Industry Segmentation
-
1. Solution
- 1.1. Content Management
- 1.2. Case Management
- 1.3. Workflow Management
- 1.4. Record Management
- 1.5. Digital Asset Management
- 1.6. Other Solutions
-
2. Deployment Model
- 2.1. Public Cloud
- 2.2. Private Cloud
- 2.3. Hybrid Cloud
-
3. End-user Industry
- 3.1. BFSI
- 3.2. Energy and Power
- 3.3. Medical and Healthcare
- 3.4. Manufacturing
- 3.5. Retail
- 3.6. IT and Telecom
- 3.7. Other End-user Industries
-
4. Service
- 4.1. Professional
- 4.2. Managed
-
5. Organization Size
- 5.1. Small and Medium Enterprises
- 5.2. Large Enterprises
Cloud Enterprise Management Industry Segmentation By Geography
- 1. North America
- 2. Europe
- 3. Asia Pacific
- 4. Latin America
- 5. Middle East
Cloud Enterprise Management Industry REPORT HIGHLIGHTS
| Aspects | Details |
|---|---|
| Study Period | 2019-2033 |
| Base Year | 2024 |
| Estimated Year | 2025 |
| Forecast Period | 2025-2033 |
| Historical Period | 2019-2024 |
| Growth Rate | CAGR of 16.33% from 2019-2033 |
| Segmentation |
|
Table of Contents
- 1. Introduction
- 1.1. Research Scope
- 1.2. Market Segmentation
- 1.3. Research Methodology
- 1.4. Definitions and Assumptions
- 2. Executive Summary
- 2.1. Introduction
- 3. Market Dynamics
- 3.1. Introduction
- 3.2. Market Drivers
- 3.2.1. Increasing Uptake of Cloud Computing Technology; Rising Trend of Enterprise Mobility
- 3.3. Market Restrains
- 3.3.1. Internet Breakdown and Bandwidth Limitation
- 3.4. Market Trends
- 3.4.1. Hybrid Cloud Expected to Record High Adoption
- 4. Market Factor Analysis
- 4.1. Porters Five Forces
- 4.2. Supply/Value Chain
- 4.3. PESTEL analysis
- 4.4. Market Entropy
- 4.5. Patent/Trademark Analysis
- 5. Global Cloud Enterprise Management Industry Analysis, Insights and Forecast, 2019-2031
- 5.1. Market Analysis, Insights and Forecast - by Solution
- 5.1.1. Content Management
- 5.1.2. Case Management
- 5.1.3. Workflow Management
- 5.1.4. Record Management
- 5.1.5. Digital Asset Management
- 5.1.6. Other Solutions
- 5.2. Market Analysis, Insights and Forecast - by Deployment Model
- 5.2.1. Public Cloud
- 5.2.2. Private Cloud
- 5.2.3. Hybrid Cloud
- 5.3. Market Analysis, Insights and Forecast - by End-user Industry
- 5.3.1. BFSI
- 5.3.2. Energy and Power
- 5.3.3. Medical and Healthcare
- 5.3.4. Manufacturing
- 5.3.5. Retail
- 5.3.6. IT and Telecom
- 5.3.7. Other End-user Industries
- 5.4. Market Analysis, Insights and Forecast - by Service
- 5.4.1. Professional
- 5.4.2. Managed
- 5.5. Market Analysis, Insights and Forecast - by Organization Size
- 5.5.1. Small and Medium Enterprises
- 5.5.2. Large Enterprises
- 5.6. Market Analysis, Insights and Forecast - by Region
- 5.6.1. North America
- 5.6.2. Europe
- 5.6.3. Asia Pacific
- 5.6.4. Latin America
- 5.6.5. Middle East
- 5.1. Market Analysis, Insights and Forecast - by Solution
- 6. North America Cloud Enterprise Management Industry Analysis, Insights and Forecast, 2019-2031
- 6.1. Market Analysis, Insights and Forecast - by Solution
- 6.1.1. Content Management
- 6.1.2. Case Management
- 6.1.3. Workflow Management
- 6.1.4. Record Management
- 6.1.5. Digital Asset Management
- 6.1.6. Other Solutions
- 6.2. Market Analysis, Insights and Forecast - by Deployment Model
- 6.2.1. Public Cloud
- 6.2.2. Private Cloud
- 6.2.3. Hybrid Cloud
- 6.3. Market Analysis, Insights and Forecast - by End-user Industry
- 6.3.1. BFSI
- 6.3.2. Energy and Power
- 6.3.3. Medical and Healthcare
- 6.3.4. Manufacturing
- 6.3.5. Retail
- 6.3.6. IT and Telecom
- 6.3.7. Other End-user Industries
- 6.4. Market Analysis, Insights and Forecast - by Service
- 6.4.1. Professional
- 6.4.2. Managed
- 6.5. Market Analysis, Insights and Forecast - by Organization Size
- 6.5.1. Small and Medium Enterprises
- 6.5.2. Large Enterprises
- 6.1. Market Analysis, Insights and Forecast - by Solution
- 7. Europe Cloud Enterprise Management Industry Analysis, Insights and Forecast, 2019-2031
- 7.1. Market Analysis, Insights and Forecast - by Solution
- 7.1.1. Content Management
- 7.1.2. Case Management
- 7.1.3. Workflow Management
- 7.1.4. Record Management
- 7.1.5. Digital Asset Management
- 7.1.6. Other Solutions
- 7.2. Market Analysis, Insights and Forecast - by Deployment Model
- 7.2.1. Public Cloud
- 7.2.2. Private Cloud
- 7.2.3. Hybrid Cloud
- 7.3. Market Analysis, Insights and Forecast - by End-user Industry
- 7.3.1. BFSI
- 7.3.2. Energy and Power
- 7.3.3. Medical and Healthcare
- 7.3.4. Manufacturing
- 7.3.5. Retail
- 7.3.6. IT and Telecom
- 7.3.7. Other End-user Industries
- 7.4. Market Analysis, Insights and Forecast - by Service
- 7.4.1. Professional
- 7.4.2. Managed
- 7.5. Market Analysis, Insights and Forecast - by Organization Size
- 7.5.1. Small and Medium Enterprises
- 7.5.2. Large Enterprises
- 7.1. Market Analysis, Insights and Forecast - by Solution
- 8. Asia Pacific Cloud Enterprise Management Industry Analysis, Insights and Forecast, 2019-2031
- 8.1. Market Analysis, Insights and Forecast - by Solution
- 8.1.1. Content Management
- 8.1.2. Case Management
- 8.1.3. Workflow Management
- 8.1.4. Record Management
- 8.1.5. Digital Asset Management
- 8.1.6. Other Solutions
- 8.2. Market Analysis, Insights and Forecast - by Deployment Model
- 8.2.1. Public Cloud
- 8.2.2. Private Cloud
- 8.2.3. Hybrid Cloud
- 8.3. Market Analysis, Insights and Forecast - by End-user Industry
- 8.3.1. BFSI
- 8.3.2. Energy and Power
- 8.3.3. Medical and Healthcare
- 8.3.4. Manufacturing
- 8.3.5. Retail
- 8.3.6. IT and Telecom
- 8.3.7. Other End-user Industries
- 8.4. Market Analysis, Insights and Forecast - by Service
- 8.4.1. Professional
- 8.4.2. Managed
- 8.5. Market Analysis, Insights and Forecast - by Organization Size
- 8.5.1. Small and Medium Enterprises
- 8.5.2. Large Enterprises
- 8.1. Market Analysis, Insights and Forecast - by Solution
- 9. Latin America Cloud Enterprise Management Industry Analysis, Insights and Forecast, 2019-2031
- 9.1. Market Analysis, Insights and Forecast - by Solution
- 9.1.1. Content Management
- 9.1.2. Case Management
- 9.1.3. Workflow Management
- 9.1.4. Record Management
- 9.1.5. Digital Asset Management
- 9.1.6. Other Solutions
- 9.2. Market Analysis, Insights and Forecast - by Deployment Model
- 9.2.1. Public Cloud
- 9.2.2. Private Cloud
- 9.2.3. Hybrid Cloud
- 9.3. Market Analysis, Insights and Forecast - by End-user Industry
- 9.3.1. BFSI
- 9.3.2. Energy and Power
- 9.3.3. Medical and Healthcare
- 9.3.4. Manufacturing
- 9.3.5. Retail
- 9.3.6. IT and Telecom
- 9.3.7. Other End-user Industries
- 9.4. Market Analysis, Insights and Forecast - by Service
- 9.4.1. Professional
- 9.4.2. Managed
- 9.5. Market Analysis, Insights and Forecast - by Organization Size
- 9.5.1. Small and Medium Enterprises
- 9.5.2. Large Enterprises
- 9.1. Market Analysis, Insights and Forecast - by Solution
- 10. Middle East Cloud Enterprise Management Industry Analysis, Insights and Forecast, 2019-2031
- 10.1. Market Analysis, Insights and Forecast - by Solution
- 10.1.1. Content Management
- 10.1.2. Case Management
- 10.1.3. Workflow Management
- 10.1.4. Record Management
- 10.1.5. Digital Asset Management
- 10.1.6. Other Solutions
- 10.2. Market Analysis, Insights and Forecast - by Deployment Model
- 10.2.1. Public Cloud
- 10.2.2. Private Cloud
- 10.2.3. Hybrid Cloud
- 10.3. Market Analysis, Insights and Forecast - by End-user Industry
- 10.3.1. BFSI
- 10.3.2. Energy and Power
- 10.3.3. Medical and Healthcare
- 10.3.4. Manufacturing
- 10.3.5. Retail
- 10.3.6. IT and Telecom
- 10.3.7. Other End-user Industries
- 10.4. Market Analysis, Insights and Forecast - by Service
- 10.4.1. Professional
- 10.4.2. Managed
- 10.5. Market Analysis, Insights and Forecast - by Organization Size
- 10.5.1. Small and Medium Enterprises
- 10.5.2. Large Enterprises
- 10.1. Market Analysis, Insights and Forecast - by Solution
- 11. North America Cloud Enterprise Management Industry Analysis, Insights and Forecast, 2019-2031
- 11.1. Market Analysis, Insights and Forecast - By Country/Sub-region
- 11.1.1 United States
- 11.1.2 Canada
- 11.1.3 Mexico
- 12. Europe Cloud Enterprise Management Industry Analysis, Insights and Forecast, 2019-2031
- 12.1. Market Analysis, Insights and Forecast - By Country/Sub-region
- 12.1.1 Germany
- 12.1.2 United Kingdom
- 12.1.3 France
- 12.1.4 Spain
- 12.1.5 Italy
- 12.1.6 Spain
- 12.1.7 Belgium
- 12.1.8 Netherland
- 12.1.9 Nordics
- 12.1.10 Rest of Europe
- 13. Asia Pacific Cloud Enterprise Management Industry Analysis, Insights and Forecast, 2019-2031
- 13.1. Market Analysis, Insights and Forecast - By Country/Sub-region
- 13.1.1 China
- 13.1.2 Japan
- 13.1.3 India
- 13.1.4 South Korea
- 13.1.5 Southeast Asia
- 13.1.6 Australia
- 13.1.7 Indonesia
- 13.1.8 Phillipes
- 13.1.9 Singapore
- 13.1.10 Thailandc
- 13.1.11 Rest of Asia Pacific
- 14. South America Cloud Enterprise Management Industry Analysis, Insights and Forecast, 2019-2031
- 14.1. Market Analysis, Insights and Forecast - By Country/Sub-region
- 14.1.1 Brazil
- 14.1.2 Argentina
- 14.1.3 Peru
- 14.1.4 Chile
- 14.1.5 Colombia
- 14.1.6 Ecuador
- 14.1.7 Venezuela
- 14.1.8 Rest of South America
- 15. North America Cloud Enterprise Management Industry Analysis, Insights and Forecast, 2019-2031
- 15.1. Market Analysis, Insights and Forecast - By Country/Sub-region
- 15.1.1 United States
- 15.1.2 Canada
- 15.1.3 Mexico
- 16. MEA Cloud Enterprise Management Industry Analysis, Insights and Forecast, 2019-2031
- 16.1. Market Analysis, Insights and Forecast - By Country/Sub-region
- 16.1.1 United Arab Emirates
- 16.1.2 Saudi Arabia
- 16.1.3 South Africa
- 16.1.4 Rest of Middle East and Africa
- 17. Competitive Analysis
- 17.1. Global Market Share Analysis 2024
- 17.2. Company Profiles
- 17.2.1 Box Inc
- 17.2.1.1. Overview
- 17.2.1.2. Products
- 17.2.1.3. SWOT Analysis
- 17.2.1.4. Recent Developments
- 17.2.1.5. Financials (Based on Availability)
- 17.2.2 IBM Corporation
- 17.2.2.1. Overview
- 17.2.2.2. Products
- 17.2.2.3. SWOT Analysis
- 17.2.2.4. Recent Developments
- 17.2.2.5. Financials (Based on Availability)
- 17.2.3 Newgen Software Inc
- 17.2.3.1. Overview
- 17.2.3.2. Products
- 17.2.3.3. SWOT Analysis
- 17.2.3.4. Recent Developments
- 17.2.3.5. Financials (Based on Availability)
- 17.2.4 OpenText Inc
- 17.2.4.1. Overview
- 17.2.4.2. Products
- 17.2.4.3. SWOT Analysis
- 17.2.4.4. Recent Developments
- 17.2.4.5. Financials (Based on Availability)
- 17.2.5 Hewlett Packard Enterprise
- 17.2.5.1. Overview
- 17.2.5.2. Products
- 17.2.5.3. SWOT Analysis
- 17.2.5.4. Recent Developments
- 17.2.5.5. Financials (Based on Availability)
- 17.2.6 Docuware GmbH
- 17.2.6.1. Overview
- 17.2.6.2. Products
- 17.2.6.3. SWOT Analysis
- 17.2.6.4. Recent Developments
- 17.2.6.5. Financials (Based on Availability)
- 17.2.7 Lexmark International Inc
- 17.2.7.1. Overview
- 17.2.7.2. Products
- 17.2.7.3. SWOT Analysis
- 17.2.7.4. Recent Developments
- 17.2.7.5. Financials (Based on Availability)
- 17.2.8 Xerox Corp
- 17.2.8.1. Overview
- 17.2.8.2. Products
- 17.2.8.3. SWOT Analysis
- 17.2.8.4. Recent Developments
- 17.2.8.5. Financials (Based on Availability)
- 17.2.9 Oracle Corp
- 17.2.9.1. Overview
- 17.2.9.2. Products
- 17.2.9.3. SWOT Analysis
- 17.2.9.4. Recent Developments
- 17.2.9.5. Financials (Based on Availability)
- 17.2.10 Microsoft Corp
- 17.2.10.1. Overview
- 17.2.10.2. Products
- 17.2.10.3. SWOT Analysis
- 17.2.10.4. Recent Developments
- 17.2.10.5. Financials (Based on Availability)
- 17.2.11 Alfresco Software Inc
- 17.2.11.1. Overview
- 17.2.11.2. Products
- 17.2.11.3. SWOT Analysis
- 17.2.11.4. Recent Developments
- 17.2.11.5. Financials (Based on Availability)
- 17.2.1 Box Inc
List of Figures
- Figure 1: Global Cloud Enterprise Management Industry Revenue Breakdown (Million, %) by Region 2024 & 2032
- Figure 2: Global Cloud Enterprise Management Industry Volume Breakdown (K Unit, %) by Region 2024 & 2032
- Figure 3: North America Cloud Enterprise Management Industry Revenue (Million), by Country 2024 & 2032
- Figure 4: North America Cloud Enterprise Management Industry Volume (K Unit), by Country 2024 & 2032
- Figure 5: North America Cloud Enterprise Management Industry Revenue Share (%), by Country 2024 & 2032
- Figure 6: North America Cloud Enterprise Management Industry Volume Share (%), by Country 2024 & 2032
- Figure 7: Europe Cloud Enterprise Management Industry Revenue (Million), by Country 2024 & 2032
- Figure 8: Europe Cloud Enterprise Management Industry Volume (K Unit), by Country 2024 & 2032
- Figure 9: Europe Cloud Enterprise Management Industry Revenue Share (%), by Country 2024 & 2032
- Figure 10: Europe Cloud Enterprise Management Industry Volume Share (%), by Country 2024 & 2032
- Figure 11: Asia Pacific Cloud Enterprise Management Industry Revenue (Million), by Country 2024 & 2032
- Figure 12: Asia Pacific Cloud Enterprise Management Industry Volume (K Unit), by Country 2024 & 2032
- Figure 13: Asia Pacific Cloud Enterprise Management Industry Revenue Share (%), by Country 2024 & 2032
- Figure 14: Asia Pacific Cloud Enterprise Management Industry Volume Share (%), by Country 2024 & 2032
- Figure 15: South America Cloud Enterprise Management Industry Revenue (Million), by Country 2024 & 2032
- Figure 16: South America Cloud Enterprise Management Industry Volume (K Unit), by Country 2024 & 2032
- Figure 17: South America Cloud Enterprise Management Industry Revenue Share (%), by Country 2024 & 2032
- Figure 18: South America Cloud Enterprise Management Industry Volume Share (%), by Country 2024 & 2032
- Figure 19: North America Cloud Enterprise Management Industry Revenue (Million), by Country 2024 & 2032
- Figure 20: North America Cloud Enterprise Management Industry Volume (K Unit), by Country 2024 & 2032
- Figure 21: North America Cloud Enterprise Management Industry Revenue Share (%), by Country 2024 & 2032
- Figure 22: North America Cloud Enterprise Management Industry Volume Share (%), by Country 2024 & 2032
- Figure 23: MEA Cloud Enterprise Management Industry Revenue (Million), by Country 2024 & 2032
- Figure 24: MEA Cloud Enterprise Management Industry Volume (K Unit), by Country 2024 & 2032
- Figure 25: MEA Cloud Enterprise Management Industry Revenue Share (%), by Country 2024 & 2032
- Figure 26: MEA Cloud Enterprise Management Industry Volume Share (%), by Country 2024 & 2032
- Figure 27: North America Cloud Enterprise Management Industry Revenue (Million), by Solution 2024 & 2032
- Figure 28: North America Cloud Enterprise Management Industry Volume (K Unit), by Solution 2024 & 2032
- Figure 29: North America Cloud Enterprise Management Industry Revenue Share (%), by Solution 2024 & 2032
- Figure 30: North America Cloud Enterprise Management Industry Volume Share (%), by Solution 2024 & 2032
- Figure 31: North America Cloud Enterprise Management Industry Revenue (Million), by Deployment Model 2024 & 2032
- Figure 32: North America Cloud Enterprise Management Industry Volume (K Unit), by Deployment Model 2024 & 2032
- Figure 33: North America Cloud Enterprise Management Industry Revenue Share (%), by Deployment Model 2024 & 2032
- Figure 34: North America Cloud Enterprise Management Industry Volume Share (%), by Deployment Model 2024 & 2032
- Figure 35: North America Cloud Enterprise Management Industry Revenue (Million), by End-user Industry 2024 & 2032
- Figure 36: North America Cloud Enterprise Management Industry Volume (K Unit), by End-user Industry 2024 & 2032
- Figure 37: North America Cloud Enterprise Management Industry Revenue Share (%), by End-user Industry 2024 & 2032
- Figure 38: North America Cloud Enterprise Management Industry Volume Share (%), by End-user Industry 2024 & 2032
- Figure 39: North America Cloud Enterprise Management Industry Revenue (Million), by Service 2024 & 2032
- Figure 40: North America Cloud Enterprise Management Industry Volume (K Unit), by Service 2024 & 2032
- Figure 41: North America Cloud Enterprise Management Industry Revenue Share (%), by Service 2024 & 2032
- Figure 42: North America Cloud Enterprise Management Industry Volume Share (%), by Service 2024 & 2032
- Figure 43: North America Cloud Enterprise Management Industry Revenue (Million), by Organization Size 2024 & 2032
- Figure 44: North America Cloud Enterprise Management Industry Volume (K Unit), by Organization Size 2024 & 2032
- Figure 45: North America Cloud Enterprise Management Industry Revenue Share (%), by Organization Size 2024 & 2032
- Figure 46: North America Cloud Enterprise Management Industry Volume Share (%), by Organization Size 2024 & 2032
- Figure 47: North America Cloud Enterprise Management Industry Revenue (Million), by Country 2024 & 2032
- Figure 48: North America Cloud Enterprise Management Industry Volume (K Unit), by Country 2024 & 2032
- Figure 49: North America Cloud Enterprise Management Industry Revenue Share (%), by Country 2024 & 2032
- Figure 50: North America Cloud Enterprise Management Industry Volume Share (%), by Country 2024 & 2032
- Figure 51: Europe Cloud Enterprise Management Industry Revenue (Million), by Solution 2024 & 2032
- Figure 52: Europe Cloud Enterprise Management Industry Volume (K Unit), by Solution 2024 & 2032
- Figure 53: Europe Cloud Enterprise Management Industry Revenue Share (%), by Solution 2024 & 2032
- Figure 54: Europe Cloud Enterprise Management Industry Volume Share (%), by Solution 2024 & 2032
- Figure 55: Europe Cloud Enterprise Management Industry Revenue (Million), by Deployment Model 2024 & 2032
- Figure 56: Europe Cloud Enterprise Management Industry Volume (K Unit), by Deployment Model 2024 & 2032
- Figure 57: Europe Cloud Enterprise Management Industry Revenue Share (%), by Deployment Model 2024 & 2032
- Figure 58: Europe Cloud Enterprise Management Industry Volume Share (%), by Deployment Model 2024 & 2032
- Figure 59: Europe Cloud Enterprise Management Industry Revenue (Million), by End-user Industry 2024 & 2032
- Figure 60: Europe Cloud Enterprise Management Industry Volume (K Unit), by End-user Industry 2024 & 2032
- Figure 61: Europe Cloud Enterprise Management Industry Revenue Share (%), by End-user Industry 2024 & 2032
- Figure 62: Europe Cloud Enterprise Management Industry Volume Share (%), by End-user Industry 2024 & 2032
- Figure 63: Europe Cloud Enterprise Management Industry Revenue (Million), by Service 2024 & 2032
- Figure 64: Europe Cloud Enterprise Management Industry Volume (K Unit), by Service 2024 & 2032
- Figure 65: Europe Cloud Enterprise Management Industry Revenue Share (%), by Service 2024 & 2032
- Figure 66: Europe Cloud Enterprise Management Industry Volume Share (%), by Service 2024 & 2032
- Figure 67: Europe Cloud Enterprise Management Industry Revenue (Million), by Organization Size 2024 & 2032
- Figure 68: Europe Cloud Enterprise Management Industry Volume (K Unit), by Organization Size 2024 & 2032
- Figure 69: Europe Cloud Enterprise Management Industry Revenue Share (%), by Organization Size 2024 & 2032
- Figure 70: Europe Cloud Enterprise Management Industry Volume Share (%), by Organization Size 2024 & 2032
- Figure 71: Europe Cloud Enterprise Management Industry Revenue (Million), by Country 2024 & 2032
- Figure 72: Europe Cloud Enterprise Management Industry Volume (K Unit), by Country 2024 & 2032
- Figure 73: Europe Cloud Enterprise Management Industry Revenue Share (%), by Country 2024 & 2032
- Figure 74: Europe Cloud Enterprise Management Industry Volume Share (%), by Country 2024 & 2032
- Figure 75: Asia Pacific Cloud Enterprise Management Industry Revenue (Million), by Solution 2024 & 2032
- Figure 76: Asia Pacific Cloud Enterprise Management Industry Volume (K Unit), by Solution 2024 & 2032
- Figure 77: Asia Pacific Cloud Enterprise Management Industry Revenue Share (%), by Solution 2024 & 2032
- Figure 78: Asia Pacific Cloud Enterprise Management Industry Volume Share (%), by Solution 2024 & 2032
- Figure 79: Asia Pacific Cloud Enterprise Management Industry Revenue (Million), by Deployment Model 2024 & 2032
- Figure 80: Asia Pacific Cloud Enterprise Management Industry Volume (K Unit), by Deployment Model 2024 & 2032
- Figure 81: Asia Pacific Cloud Enterprise Management Industry Revenue Share (%), by Deployment Model 2024 & 2032
- Figure 82: Asia Pacific Cloud Enterprise Management Industry Volume Share (%), by Deployment Model 2024 & 2032
- Figure 83: Asia Pacific Cloud Enterprise Management Industry Revenue (Million), by End-user Industry 2024 & 2032
- Figure 84: Asia Pacific Cloud Enterprise Management Industry Volume (K Unit), by End-user Industry 2024 & 2032
- Figure 85: Asia Pacific Cloud Enterprise Management Industry Revenue Share (%), by End-user Industry 2024 & 2032
- Figure 86: Asia Pacific Cloud Enterprise Management Industry Volume Share (%), by End-user Industry 2024 & 2032
- Figure 87: Asia Pacific Cloud Enterprise Management Industry Revenue (Million), by Service 2024 & 2032
- Figure 88: Asia Pacific Cloud Enterprise Management Industry Volume (K Unit), by Service 2024 & 2032
- Figure 89: Asia Pacific Cloud Enterprise Management Industry Revenue Share (%), by Service 2024 & 2032
- Figure 90: Asia Pacific Cloud Enterprise Management Industry Volume Share (%), by Service 2024 & 2032
- Figure 91: Asia Pacific Cloud Enterprise Management Industry Revenue (Million), by Organization Size 2024 & 2032
- Figure 92: Asia Pacific Cloud Enterprise Management Industry Volume (K Unit), by Organization Size 2024 & 2032
- Figure 93: Asia Pacific Cloud Enterprise Management Industry Revenue Share (%), by Organization Size 2024 & 2032
- Figure 94: Asia Pacific Cloud Enterprise Management Industry Volume Share (%), by Organization Size 2024 & 2032
- Figure 95: Asia Pacific Cloud Enterprise Management Industry Revenue (Million), by Country 2024 & 2032
- Figure 96: Asia Pacific Cloud Enterprise Management Industry Volume (K Unit), by Country 2024 & 2032
- Figure 97: Asia Pacific Cloud Enterprise Management Industry Revenue Share (%), by Country 2024 & 2032
- Figure 98: Asia Pacific Cloud Enterprise Management Industry Volume Share (%), by Country 2024 & 2032
- Figure 99: Latin America Cloud Enterprise Management Industry Revenue (Million), by Solution 2024 & 2032
- Figure 100: Latin America Cloud Enterprise Management Industry Volume (K Unit), by Solution 2024 & 2032
- Figure 101: Latin America Cloud Enterprise Management Industry Revenue Share (%), by Solution 2024 & 2032
- Figure 102: Latin America Cloud Enterprise Management Industry Volume Share (%), by Solution 2024 & 2032
- Figure 103: Latin America Cloud Enterprise Management Industry Revenue (Million), by Deployment Model 2024 & 2032
- Figure 104: Latin America Cloud Enterprise Management Industry Volume (K Unit), by Deployment Model 2024 & 2032
- Figure 105: Latin America Cloud Enterprise Management Industry Revenue Share (%), by Deployment Model 2024 & 2032
- Figure 106: Latin America Cloud Enterprise Management Industry Volume Share (%), by Deployment Model 2024 & 2032
- Figure 107: Latin America Cloud Enterprise Management Industry Revenue (Million), by End-user Industry 2024 & 2032
- Figure 108: Latin America Cloud Enterprise Management Industry Volume (K Unit), by End-user Industry 2024 & 2032
- Figure 109: Latin America Cloud Enterprise Management Industry Revenue Share (%), by End-user Industry 2024 & 2032
- Figure 110: Latin America Cloud Enterprise Management Industry Volume Share (%), by End-user Industry 2024 & 2032
- Figure 111: Latin America Cloud Enterprise Management Industry Revenue (Million), by Service 2024 & 2032
- Figure 112: Latin America Cloud Enterprise Management Industry Volume (K Unit), by Service 2024 & 2032
- Figure 113: Latin America Cloud Enterprise Management Industry Revenue Share (%), by Service 2024 & 2032
- Figure 114: Latin America Cloud Enterprise Management Industry Volume Share (%), by Service 2024 & 2032
- Figure 115: Latin America Cloud Enterprise Management Industry Revenue (Million), by Organization Size 2024 & 2032
- Figure 116: Latin America Cloud Enterprise Management Industry Volume (K Unit), by Organization Size 2024 & 2032
- Figure 117: Latin America Cloud Enterprise Management Industry Revenue Share (%), by Organization Size 2024 & 2032
- Figure 118: Latin America Cloud Enterprise Management Industry Volume Share (%), by Organization Size 2024 & 2032
- Figure 119: Latin America Cloud Enterprise Management Industry Revenue (Million), by Country 2024 & 2032
- Figure 120: Latin America Cloud Enterprise Management Industry Volume (K Unit), by Country 2024 & 2032
- Figure 121: Latin America Cloud Enterprise Management Industry Revenue Share (%), by Country 2024 & 2032
- Figure 122: Latin America Cloud Enterprise Management Industry Volume Share (%), by Country 2024 & 2032
- Figure 123: Middle East Cloud Enterprise Management Industry Revenue (Million), by Solution 2024 & 2032
- Figure 124: Middle East Cloud Enterprise Management Industry Volume (K Unit), by Solution 2024 & 2032
- Figure 125: Middle East Cloud Enterprise Management Industry Revenue Share (%), by Solution 2024 & 2032
- Figure 126: Middle East Cloud Enterprise Management Industry Volume Share (%), by Solution 2024 & 2032
- Figure 127: Middle East Cloud Enterprise Management Industry Revenue (Million), by Deployment Model 2024 & 2032
- Figure 128: Middle East Cloud Enterprise Management Industry Volume (K Unit), by Deployment Model 2024 & 2032
- Figure 129: Middle East Cloud Enterprise Management Industry Revenue Share (%), by Deployment Model 2024 & 2032
- Figure 130: Middle East Cloud Enterprise Management Industry Volume Share (%), by Deployment Model 2024 & 2032
- Figure 131: Middle East Cloud Enterprise Management Industry Revenue (Million), by End-user Industry 2024 & 2032
- Figure 132: Middle East Cloud Enterprise Management Industry Volume (K Unit), by End-user Industry 2024 & 2032
- Figure 133: Middle East Cloud Enterprise Management Industry Revenue Share (%), by End-user Industry 2024 & 2032
- Figure 134: Middle East Cloud Enterprise Management Industry Volume Share (%), by End-user Industry 2024 & 2032
- Figure 135: Middle East Cloud Enterprise Management Industry Revenue (Million), by Service 2024 & 2032
- Figure 136: Middle East Cloud Enterprise Management Industry Volume (K Unit), by Service 2024 & 2032
- Figure 137: Middle East Cloud Enterprise Management Industry Revenue Share (%), by Service 2024 & 2032
- Figure 138: Middle East Cloud Enterprise Management Industry Volume Share (%), by Service 2024 & 2032
- Figure 139: Middle East Cloud Enterprise Management Industry Revenue (Million), by Organization Size 2024 & 2032
- Figure 140: Middle East Cloud Enterprise Management Industry Volume (K Unit), by Organization Size 2024 & 2032
- Figure 141: Middle East Cloud Enterprise Management Industry Revenue Share (%), by Organization Size 2024 & 2032
- Figure 142: Middle East Cloud Enterprise Management Industry Volume Share (%), by Organization Size 2024 & 2032
- Figure 143: Middle East Cloud Enterprise Management Industry Revenue (Million), by Country 2024 & 2032
- Figure 144: Middle East Cloud Enterprise Management Industry Volume (K Unit), by Country 2024 & 2032
- Figure 145: Middle East Cloud Enterprise Management Industry Revenue Share (%), by Country 2024 & 2032
- Figure 146: Middle East Cloud Enterprise Management Industry Volume Share (%), by Country 2024 & 2032
List of Tables
- Table 1: Global Cloud Enterprise Management Industry Revenue Million Forecast, by Region 2019 & 2032
- Table 2: Global Cloud Enterprise Management Industry Volume K Unit Forecast, by Region 2019 & 2032
- Table 3: Global Cloud Enterprise Management Industry Revenue Million Forecast, by Solution 2019 & 2032
- Table 4: Global Cloud Enterprise Management Industry Volume K Unit Forecast, by Solution 2019 & 2032
- Table 5: Global Cloud Enterprise Management Industry Revenue Million Forecast, by Deployment Model 2019 & 2032
- Table 6: Global Cloud Enterprise Management Industry Volume K Unit Forecast, by Deployment Model 2019 & 2032
- Table 7: Global Cloud Enterprise Management Industry Revenue Million Forecast, by End-user Industry 2019 & 2032
- Table 8: Global Cloud Enterprise Management Industry Volume K Unit Forecast, by End-user Industry 2019 & 2032
- Table 9: Global Cloud Enterprise Management Industry Revenue Million Forecast, by Service 2019 & 2032
- Table 10: Global Cloud Enterprise Management Industry Volume K Unit Forecast, by Service 2019 & 2032
- Table 11: Global Cloud Enterprise Management Industry Revenue Million Forecast, by Organization Size 2019 & 2032
- Table 12: Global Cloud Enterprise Management Industry Volume K Unit Forecast, by Organization Size 2019 & 2032
- Table 13: Global Cloud Enterprise Management Industry Revenue Million Forecast, by Region 2019 & 2032
- Table 14: Global Cloud Enterprise Management Industry Volume K Unit Forecast, by Region 2019 & 2032
- Table 15: Global Cloud Enterprise Management Industry Revenue Million Forecast, by Country 2019 & 2032
- Table 16: Global Cloud Enterprise Management Industry Volume K Unit Forecast, by Country 2019 & 2032
- Table 17: United States Cloud Enterprise Management Industry Revenue (Million) Forecast, by Application 2019 & 2032
- Table 18: United States Cloud Enterprise Management Industry Volume (K Unit) Forecast, by Application 2019 & 2032
- Table 19: Canada Cloud Enterprise Management Industry Revenue (Million) Forecast, by Application 2019 & 2032
- Table 20: Canada Cloud Enterprise Management Industry Volume (K Unit) Forecast, by Application 2019 & 2032
- Table 21: Mexico Cloud Enterprise Management Industry Revenue (Million) Forecast, by Application 2019 & 2032
- Table 22: Mexico Cloud Enterprise Management Industry Volume (K Unit) Forecast, by Application 2019 & 2032
- Table 23: Global Cloud Enterprise Management Industry Revenue Million Forecast, by Country 2019 & 2032
- Table 24: Global Cloud Enterprise Management Industry Volume K Unit Forecast, by Country 2019 & 2032
- Table 25: Germany Cloud Enterprise Management Industry Revenue (Million) Forecast, by Application 2019 & 2032
- Table 26: Germany Cloud Enterprise Management Industry Volume (K Unit) Forecast, by Application 2019 & 2032
- Table 27: United Kingdom Cloud Enterprise Management Industry Revenue (Million) Forecast, by Application 2019 & 2032
- Table 28: United Kingdom Cloud Enterprise Management Industry Volume (K Unit) Forecast, by Application 2019 & 2032
- Table 29: France Cloud Enterprise Management Industry Revenue (Million) Forecast, by Application 2019 & 2032
- Table 30: France Cloud Enterprise Management Industry Volume (K Unit) Forecast, by Application 2019 & 2032
- Table 31: Spain Cloud Enterprise Management Industry Revenue (Million) Forecast, by Application 2019 & 2032
- Table 32: Spain Cloud Enterprise Management Industry Volume (K Unit) Forecast, by Application 2019 & 2032
- Table 33: Italy Cloud Enterprise Management Industry Revenue (Million) Forecast, by Application 2019 & 2032
- Table 34: Italy Cloud Enterprise Management Industry Volume (K Unit) Forecast, by Application 2019 & 2032
- Table 35: Spain Cloud Enterprise Management Industry Revenue (Million) Forecast, by Application 2019 & 2032
- Table 36: Spain Cloud Enterprise Management Industry Volume (K Unit) Forecast, by Application 2019 & 2032
- Table 37: Belgium Cloud Enterprise Management Industry Revenue (Million) Forecast, by Application 2019 & 2032
- Table 38: Belgium Cloud Enterprise Management Industry Volume (K Unit) Forecast, by Application 2019 & 2032
- Table 39: Netherland Cloud Enterprise Management Industry Revenue (Million) Forecast, by Application 2019 & 2032
- Table 40: Netherland Cloud Enterprise Management Industry Volume (K Unit) Forecast, by Application 2019 & 2032
- Table 41: Nordics Cloud Enterprise Management Industry Revenue (Million) Forecast, by Application 2019 & 2032
- Table 42: Nordics Cloud Enterprise Management Industry Volume (K Unit) Forecast, by Application 2019 & 2032
- Table 43: Rest of Europe Cloud Enterprise Management Industry Revenue (Million) Forecast, by Application 2019 & 2032
- Table 44: Rest of Europe Cloud Enterprise Management Industry Volume (K Unit) Forecast, by Application 2019 & 2032
- Table 45: Global Cloud Enterprise Management Industry Revenue Million Forecast, by Country 2019 & 2032
- Table 46: Global Cloud Enterprise Management Industry Volume K Unit Forecast, by Country 2019 & 2032
- Table 47: China Cloud Enterprise Management Industry Revenue (Million) Forecast, by Application 2019 & 2032
- Table 48: China Cloud Enterprise Management Industry Volume (K Unit) Forecast, by Application 2019 & 2032
- Table 49: Japan Cloud Enterprise Management Industry Revenue (Million) Forecast, by Application 2019 & 2032
- Table 50: Japan Cloud Enterprise Management Industry Volume (K Unit) Forecast, by Application 2019 & 2032
- Table 51: India Cloud Enterprise Management Industry Revenue (Million) Forecast, by Application 2019 & 2032
- Table 52: India Cloud Enterprise Management Industry Volume (K Unit) Forecast, by Application 2019 & 2032
- Table 53: South Korea Cloud Enterprise Management Industry Revenue (Million) Forecast, by Application 2019 & 2032
- Table 54: South Korea Cloud Enterprise Management Industry Volume (K Unit) Forecast, by Application 2019 & 2032
- Table 55: Southeast Asia Cloud Enterprise Management Industry Revenue (Million) Forecast, by Application 2019 & 2032
- Table 56: Southeast Asia Cloud Enterprise Management Industry Volume (K Unit) Forecast, by Application 2019 & 2032
- Table 57: Australia Cloud Enterprise Management Industry Revenue (Million) Forecast, by Application 2019 & 2032
- Table 58: Australia Cloud Enterprise Management Industry Volume (K Unit) Forecast, by Application 2019 & 2032
- Table 59: Indonesia Cloud Enterprise Management Industry Revenue (Million) Forecast, by Application 2019 & 2032
- Table 60: Indonesia Cloud Enterprise Management Industry Volume (K Unit) Forecast, by Application 2019 & 2032
- Table 61: Phillipes Cloud Enterprise Management Industry Revenue (Million) Forecast, by Application 2019 & 2032
- Table 62: Phillipes Cloud Enterprise Management Industry Volume (K Unit) Forecast, by Application 2019 & 2032
- Table 63: Singapore Cloud Enterprise Management Industry Revenue (Million) Forecast, by Application 2019 & 2032
- Table 64: Singapore Cloud Enterprise Management Industry Volume (K Unit) Forecast, by Application 2019 & 2032
- Table 65: Thailandc Cloud Enterprise Management Industry Revenue (Million) Forecast, by Application 2019 & 2032
- Table 66: Thailandc Cloud Enterprise Management Industry Volume (K Unit) Forecast, by Application 2019 & 2032
- Table 67: Rest of Asia Pacific Cloud Enterprise Management Industry Revenue (Million) Forecast, by Application 2019 & 2032
- Table 68: Rest of Asia Pacific Cloud Enterprise Management Industry Volume (K Unit) Forecast, by Application 2019 & 2032
- Table 69: Global Cloud Enterprise Management Industry Revenue Million Forecast, by Country 2019 & 2032
- Table 70: Global Cloud Enterprise Management Industry Volume K Unit Forecast, by Country 2019 & 2032
- Table 71: Brazil Cloud Enterprise Management Industry Revenue (Million) Forecast, by Application 2019 & 2032
- Table 72: Brazil Cloud Enterprise Management Industry Volume (K Unit) Forecast, by Application 2019 & 2032
- Table 73: Argentina Cloud Enterprise Management Industry Revenue (Million) Forecast, by Application 2019 & 2032
- Table 74: Argentina Cloud Enterprise Management Industry Volume (K Unit) Forecast, by Application 2019 & 2032
- Table 75: Peru Cloud Enterprise Management Industry Revenue (Million) Forecast, by Application 2019 & 2032
- Table 76: Peru Cloud Enterprise Management Industry Volume (K Unit) Forecast, by Application 2019 & 2032
- Table 77: Chile Cloud Enterprise Management Industry Revenue (Million) Forecast, by Application 2019 & 2032
- Table 78: Chile Cloud Enterprise Management Industry Volume (K Unit) Forecast, by Application 2019 & 2032
- Table 79: Colombia Cloud Enterprise Management Industry Revenue (Million) Forecast, by Application 2019 & 2032
- Table 80: Colombia Cloud Enterprise Management Industry Volume (K Unit) Forecast, by Application 2019 & 2032
- Table 81: Ecuador Cloud Enterprise Management Industry Revenue (Million) Forecast, by Application 2019 & 2032
- Table 82: Ecuador Cloud Enterprise Management Industry Volume (K Unit) Forecast, by Application 2019 & 2032
- Table 83: Venezuela Cloud Enterprise Management Industry Revenue (Million) Forecast, by Application 2019 & 2032
- Table 84: Venezuela Cloud Enterprise Management Industry Volume (K Unit) Forecast, by Application 2019 & 2032
- Table 85: Rest of South America Cloud Enterprise Management Industry Revenue (Million) Forecast, by Application 2019 & 2032
- Table 86: Rest of South America Cloud Enterprise Management Industry Volume (K Unit) Forecast, by Application 2019 & 2032
- Table 87: Global Cloud Enterprise Management Industry Revenue Million Forecast, by Country 2019 & 2032
- Table 88: Global Cloud Enterprise Management Industry Volume K Unit Forecast, by Country 2019 & 2032
- Table 89: United States Cloud Enterprise Management Industry Revenue (Million) Forecast, by Application 2019 & 2032
- Table 90: United States Cloud Enterprise Management Industry Volume (K Unit) Forecast, by Application 2019 & 2032
- Table 91: Canada Cloud Enterprise Management Industry Revenue (Million) Forecast, by Application 2019 & 2032
- Table 92: Canada Cloud Enterprise Management Industry Volume (K Unit) Forecast, by Application 2019 & 2032
- Table 93: Mexico Cloud Enterprise Management Industry Revenue (Million) Forecast, by Application 2019 & 2032
- Table 94: Mexico Cloud Enterprise Management Industry Volume (K Unit) Forecast, by Application 2019 & 2032
- Table 95: Global Cloud Enterprise Management Industry Revenue Million Forecast, by Country 2019 & 2032
- Table 96: Global Cloud Enterprise Management Industry Volume K Unit Forecast, by Country 2019 & 2032
- Table 97: United Arab Emirates Cloud Enterprise Management Industry Revenue (Million) Forecast, by Application 2019 & 2032
- Table 98: United Arab Emirates Cloud Enterprise Management Industry Volume (K Unit) Forecast, by Application 2019 & 2032
- Table 99: Saudi Arabia Cloud Enterprise Management Industry Revenue (Million) Forecast, by Application 2019 & 2032
- Table 100: Saudi Arabia Cloud Enterprise Management Industry Volume (K Unit) Forecast, by Application 2019 & 2032
- Table 101: South Africa Cloud Enterprise Management Industry Revenue (Million) Forecast, by Application 2019 & 2032
- Table 102: South Africa Cloud Enterprise Management Industry Volume (K Unit) Forecast, by Application 2019 & 2032
- Table 103: Rest of Middle East and Africa Cloud Enterprise Management Industry Revenue (Million) Forecast, by Application 2019 & 2032
- Table 104: Rest of Middle East and Africa Cloud Enterprise Management Industry Volume (K Unit) Forecast, by Application 2019 & 2032
- Table 105: Global Cloud Enterprise Management Industry Revenue Million Forecast, by Solution 2019 & 2032
- Table 106: Global Cloud Enterprise Management Industry Volume K Unit Forecast, by Solution 2019 & 2032
- Table 107: Global Cloud Enterprise Management Industry Revenue Million Forecast, by Deployment Model 2019 & 2032
- Table 108: Global Cloud Enterprise Management Industry Volume K Unit Forecast, by Deployment Model 2019 & 2032
- Table 109: Global Cloud Enterprise Management Industry Revenue Million Forecast, by End-user Industry 2019 & 2032
- Table 110: Global Cloud Enterprise Management Industry Volume K Unit Forecast, by End-user Industry 2019 & 2032
- Table 111: Global Cloud Enterprise Management Industry Revenue Million Forecast, by Service 2019 & 2032
- Table 112: Global Cloud Enterprise Management Industry Volume K Unit Forecast, by Service 2019 & 2032
- Table 113: Global Cloud Enterprise Management Industry Revenue Million Forecast, by Organization Size 2019 & 2032
- Table 114: Global Cloud Enterprise Management Industry Volume K Unit Forecast, by Organization Size 2019 & 2032
- Table 115: Global Cloud Enterprise Management Industry Revenue Million Forecast, by Country 2019 & 2032
- Table 116: Global Cloud Enterprise Management Industry Volume K Unit Forecast, by Country 2019 & 2032
- Table 117: Global Cloud Enterprise Management Industry Revenue Million Forecast, by Solution 2019 & 2032
- Table 118: Global Cloud Enterprise Management Industry Volume K Unit Forecast, by Solution 2019 & 2032
- Table 119: Global Cloud Enterprise Management Industry Revenue Million Forecast, by Deployment Model 2019 & 2032
- Table 120: Global Cloud Enterprise Management Industry Volume K Unit Forecast, by Deployment Model 2019 & 2032
- Table 121: Global Cloud Enterprise Management Industry Revenue Million Forecast, by End-user Industry 2019 & 2032
- Table 122: Global Cloud Enterprise Management Industry Volume K Unit Forecast, by End-user Industry 2019 & 2032
- Table 123: Global Cloud Enterprise Management Industry Revenue Million Forecast, by Service 2019 & 2032
- Table 124: Global Cloud Enterprise Management Industry Volume K Unit Forecast, by Service 2019 & 2032
- Table 125: Global Cloud Enterprise Management Industry Revenue Million Forecast, by Organization Size 2019 & 2032
- Table 126: Global Cloud Enterprise Management Industry Volume K Unit Forecast, by Organization Size 2019 & 2032
- Table 127: Global Cloud Enterprise Management Industry Revenue Million Forecast, by Country 2019 & 2032
- Table 128: Global Cloud Enterprise Management Industry Volume K Unit Forecast, by Country 2019 & 2032
- Table 129: Global Cloud Enterprise Management Industry Revenue Million Forecast, by Solution 2019 & 2032
- Table 130: Global Cloud Enterprise Management Industry Volume K Unit Forecast, by Solution 2019 & 2032
- Table 131: Global Cloud Enterprise Management Industry Revenue Million Forecast, by Deployment Model 2019 & 2032
- Table 132: Global Cloud Enterprise Management Industry Volume K Unit Forecast, by Deployment Model 2019 & 2032
- Table 133: Global Cloud Enterprise Management Industry Revenue Million Forecast, by End-user Industry 2019 & 2032
- Table 134: Global Cloud Enterprise Management Industry Volume K Unit Forecast, by End-user Industry 2019 & 2032
- Table 135: Global Cloud Enterprise Management Industry Revenue Million Forecast, by Service 2019 & 2032
- Table 136: Global Cloud Enterprise Management Industry Volume K Unit Forecast, by Service 2019 & 2032
- Table 137: Global Cloud Enterprise Management Industry Revenue Million Forecast, by Organization Size 2019 & 2032
- Table 138: Global Cloud Enterprise Management Industry Volume K Unit Forecast, by Organization Size 2019 & 2032
- Table 139: Global Cloud Enterprise Management Industry Revenue Million Forecast, by Country 2019 & 2032
- Table 140: Global Cloud Enterprise Management Industry Volume K Unit Forecast, by Country 2019 & 2032
- Table 141: Global Cloud Enterprise Management Industry Revenue Million Forecast, by Solution 2019 & 2032
- Table 142: Global Cloud Enterprise Management Industry Volume K Unit Forecast, by Solution 2019 & 2032
- Table 143: Global Cloud Enterprise Management Industry Revenue Million Forecast, by Deployment Model 2019 & 2032
- Table 144: Global Cloud Enterprise Management Industry Volume K Unit Forecast, by Deployment Model 2019 & 2032
- Table 145: Global Cloud Enterprise Management Industry Revenue Million Forecast, by End-user Industry 2019 & 2032
- Table 146: Global Cloud Enterprise Management Industry Volume K Unit Forecast, by End-user Industry 2019 & 2032
- Table 147: Global Cloud Enterprise Management Industry Revenue Million Forecast, by Service 2019 & 2032
- Table 148: Global Cloud Enterprise Management Industry Volume K Unit Forecast, by Service 2019 & 2032
- Table 149: Global Cloud Enterprise Management Industry Revenue Million Forecast, by Organization Size 2019 & 2032
- Table 150: Global Cloud Enterprise Management Industry Volume K Unit Forecast, by Organization Size 2019 & 2032
- Table 151: Global Cloud Enterprise Management Industry Revenue Million Forecast, by Country 2019 & 2032
- Table 152: Global Cloud Enterprise Management Industry Volume K Unit Forecast, by Country 2019 & 2032
- Table 153: Global Cloud Enterprise Management Industry Revenue Million Forecast, by Solution 2019 & 2032
- Table 154: Global Cloud Enterprise Management Industry Volume K Unit Forecast, by Solution 2019 & 2032
- Table 155: Global Cloud Enterprise Management Industry Revenue Million Forecast, by Deployment Model 2019 & 2032
- Table 156: Global Cloud Enterprise Management Industry Volume K Unit Forecast, by Deployment Model 2019 & 2032
- Table 157: Global Cloud Enterprise Management Industry Revenue Million Forecast, by End-user Industry 2019 & 2032
- Table 158: Global Cloud Enterprise Management Industry Volume K Unit Forecast, by End-user Industry 2019 & 2032
- Table 159: Global Cloud Enterprise Management Industry Revenue Million Forecast, by Service 2019 & 2032
- Table 160: Global Cloud Enterprise Management Industry Volume K Unit Forecast, by Service 2019 & 2032
- Table 161: Global Cloud Enterprise Management Industry Revenue Million Forecast, by Organization Size 2019 & 2032
- Table 162: Global Cloud Enterprise Management Industry Volume K Unit Forecast, by Organization Size 2019 & 2032
- Table 163: Global Cloud Enterprise Management Industry Revenue Million Forecast, by Country 2019 & 2032
- Table 164: Global Cloud Enterprise Management Industry Volume K Unit Forecast, by Country 2019 & 2032
Frequently Asked Questions
1. What is the projected Compound Annual Growth Rate (CAGR) of the Cloud Enterprise Management Industry?
The projected CAGR is approximately 16.33%.
2. Which companies are prominent players in the Cloud Enterprise Management Industry?
Key companies in the market include Box Inc, IBM Corporation, Newgen Software Inc, OpenText Inc, Hewlett Packard Enterprise, Docuware GmbH, Lexmark International Inc, Xerox Corp, Oracle Corp, Microsoft Corp, Alfresco Software Inc.
3. What are the main segments of the Cloud Enterprise Management Industry?
The market segments include Solution, Deployment Model, End-user Industry, Service, Organization Size.
4. Can you provide details about the market size?
The market size is estimated to be USD 35.11 Million as of 2022.
5. What are some drivers contributing to market growth?
Increasing Uptake of Cloud Computing Technology; Rising Trend of Enterprise Mobility.
6. What are the notable trends driving market growth?
Hybrid Cloud Expected to Record High Adoption.
7. Are there any restraints impacting market growth?
Internet Breakdown and Bandwidth Limitation.
8. Can you provide examples of recent developments in the market?
March 2023: Newgen Software, a global provider of low code-based digital transformation platform announced the launch of its enterprise content management suite OmniDocs Connector on cloud marketplace Salesforce AppExchange. Newgen OmniDocs Contextual Content Services Platform seamlessly integrates with Salesforce Sales Cloud, allowing users to manage, control, share, and utilize organizational content.
9. What pricing options are available for accessing the report?
Pricing options include single-user, multi-user, and enterprise licenses priced at USD 4750, USD 5250, and USD 8750 respectively.
10. Is the market size provided in terms of value or volume?
The market size is provided in terms of value, measured in Million and volume, measured in K Unit.
11. Are there any specific market keywords associated with the report?
Yes, the market keyword associated with the report is "Cloud Enterprise Management Industry," which aids in identifying and referencing the specific market segment covered.
12. How do I determine which pricing option suits my needs best?
The pricing options vary based on user requirements and access needs. Individual users may opt for single-user licenses, while businesses requiring broader access may choose multi-user or enterprise licenses for cost-effective access to the report.
13. Are there any additional resources or data provided in the Cloud Enterprise Management Industry report?
While the report offers comprehensive insights, it's advisable to review the specific contents or supplementary materials provided to ascertain if additional resources or data are available.
14. How can I stay updated on further developments or reports in the Cloud Enterprise Management Industry?
To stay informed about further developments, trends, and reports in the Cloud Enterprise Management Industry, consider subscribing to industry newsletters, following relevant companies and organizations, or regularly checking reputable industry news sources and publications.
Methodology
Step 1 - Identification of Relevant Samples Size from Population Database


Step 2 - Approaches for Defining Global Market Size (Value, Volume* & Price*)

Note*: In applicable scenarios
Step 3 - Data Sources
Primary Research
- Web Analytics
- Survey Reports
- Research Institute
- Latest Research Reports
- Opinion Leaders
Secondary Research
- Annual Reports
- White Paper
- Latest Press Release
- Industry Association
- Paid Database
- Investor Presentations

Step 4 - Data Triangulation
Involves using different sources of information in order to increase the validity of a study
These sources are likely to be stakeholders in a program - participants, other researchers, program staff, other community members, and so on.
Then we put all data in single framework & apply various statistical tools to find out the dynamic on the market.
During the analysis stage, feedback from the stakeholder groups would be compared to determine areas of agreement as well as areas of divergence


