
Key Insights
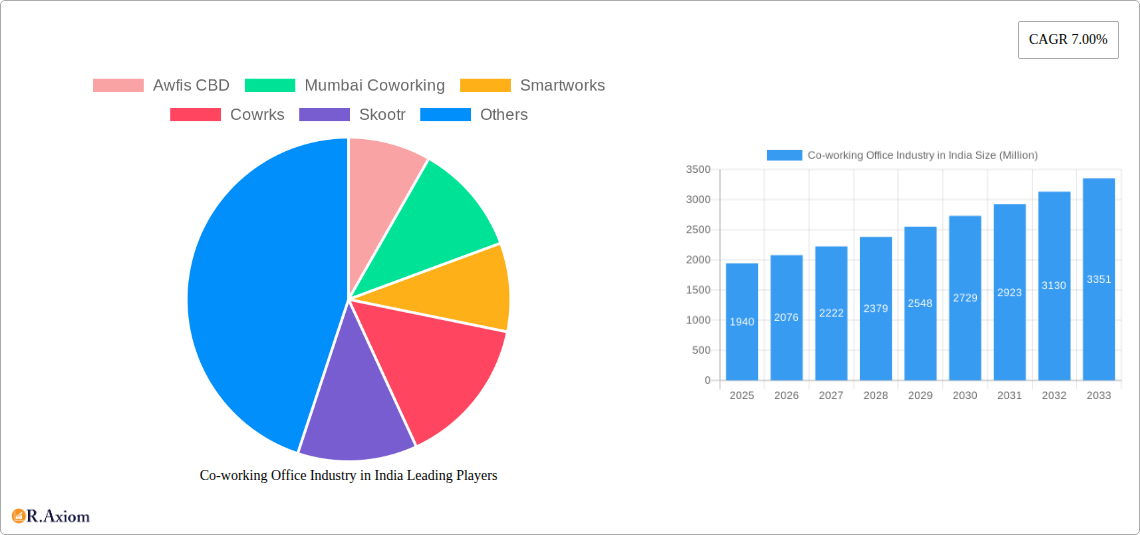
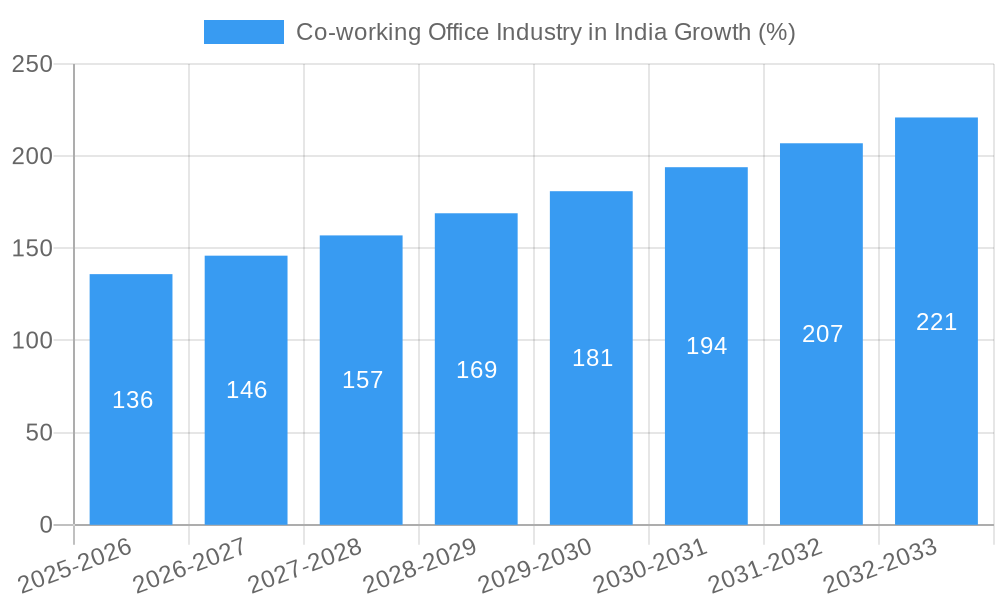
The Indian co-working office market, valued at $1.94 billion in 2025, exhibits robust growth potential, projected to expand at a CAGR of 7% from 2025 to 2033. This expansion is fueled by several key drivers. The burgeoning startup ecosystem and increasing preference for flexible work arrangements among small and large-scale companies are significant contributors. The IT and ITES sector, along with BFSI and consulting firms, are major end-users, driving demand in key cities like Delhi, Mumbai, and Bangalore. Technological advancements, enhancing workspace management and communication, further accelerate market growth. While a potential restraint could be increased competition and fluctuating real estate prices, the overall market outlook remains positive. The diverse segmentations, including flexible managed offices, serviced offices, and varied end-user needs, offer substantial opportunities for growth and diversification within the industry. The expansion into Tier-2 and Tier-3 cities also presents a significant untapped potential.
The market's growth trajectory is significantly influenced by the evolving preferences of businesses. The demand for cost-effective solutions, enhanced networking opportunities, and improved work-life balance is driving the adoption of co-working spaces. Established players like Awfis, Smartworks, and WeWork are strengthening their market presence through strategic expansions and innovative service offerings. The emergence of new players and the increasing adoption of technology in the sector are expected to further intensify competition and stimulate innovation. Future growth will likely be driven by technological advancements, enhanced service offerings tailored to specific industry needs, and expansion into underserved markets, ensuring the continued success of the co-working space industry within India's dynamic economic landscape.
Co-working Office Industry in India: A Comprehensive Market Report (2019-2033)
This comprehensive report provides an in-depth analysis of the burgeoning co-working office industry in India, covering market size, segmentation, key players, growth drivers, challenges, and future opportunities. The study period spans from 2019 to 2033, with 2025 as the base and estimated year. The forecast period is 2025-2033, and the historical period covers 2019-2024. This report is invaluable for investors, entrepreneurs, industry stakeholders, and anyone seeking to understand this dynamic sector.
Co-working Office Industry in India Market Concentration & Innovation
The Indian co-working industry is characterized by a moderately concentrated market with several major players vying for market share. While precise market share figures for each company are difficult to obtain publicly and are dynamic, major players like Awfis, Smartworks, and WeWork India command significant portions of the market, estimated to be in the range of xx Million USD to xx Million USD in revenue collectively, but this data remains fluid. This concentration is partly driven by the significant capital investments needed to establish and expand a network of co-working spaces across major cities. However, the market also exhibits a high degree of innovation, with companies constantly seeking to differentiate themselves through unique offerings, such as specialized amenities, flexible lease terms, and technologically advanced workspaces.
Innovation Drivers:
- Technological advancements (e.g., smart building technologies, booking platforms).
- Changing work preferences (e.g., remote work, flexible work arrangements).
- Growth of startups and SMEs.
Regulatory Frameworks: The regulatory landscape remains evolving, with various state and local regulations impacting space licensing and operations. This poses both challenges and opportunities for companies to navigate the regulatory complexities.
Product Substitutes: Traditional office spaces, virtual offices, and home offices are considered substitutes, however the flexible nature of co-working and its added benefits are driving growth despite competition.
End-User Trends: The increasing preference for flexible workspaces among personal users, small-scale, and large-scale companies fuels market expansion. Large corporations are increasingly utilizing co-working spaces to accommodate their growing teams and expand their footprint to new locations.
M&A Activities: The industry has witnessed significant mergers and acquisitions (M&A) activity in recent years, though precise deal values for all transactions are unavailable. These activities reflect consolidation within the sector and the drive for expansion by larger players. The reported USD 20 million valuation of Stylework in April 2023 illustrates potential deal values, but accurate overall M&A data is difficult to gather from publicly available sources.
Co-working Office Industry in India Industry Trends & Insights
The Indian co-working office market is experiencing robust growth, driven by several key factors. The increasing adoption of flexible work models, the rise of startups and SMEs, and the expansion of the IT and ITES sector, all contribute significantly to this growth. The market's CAGR (Compound Annual Growth Rate) from 2019 to 2024 is estimated at xx%, and market penetration is projected to increase further, reaching xx% by 2033.
Technological disruptions, such as the implementation of booking platforms and smart building technologies, are enhancing the co-working experience and driving efficiency. Consumer preferences for flexible work arrangements and community-driven workspaces continue to shape the market. The competitive dynamics are characterized by a mix of established players and new entrants, resulting in ongoing innovation and a focus on differentiation. The increasing adoption of hybrid work models is also proving to be a catalyst for growth. Several reports project the industry will reach xx Million USD market size in 2025, but these forecasts vary based on the source and methodology.
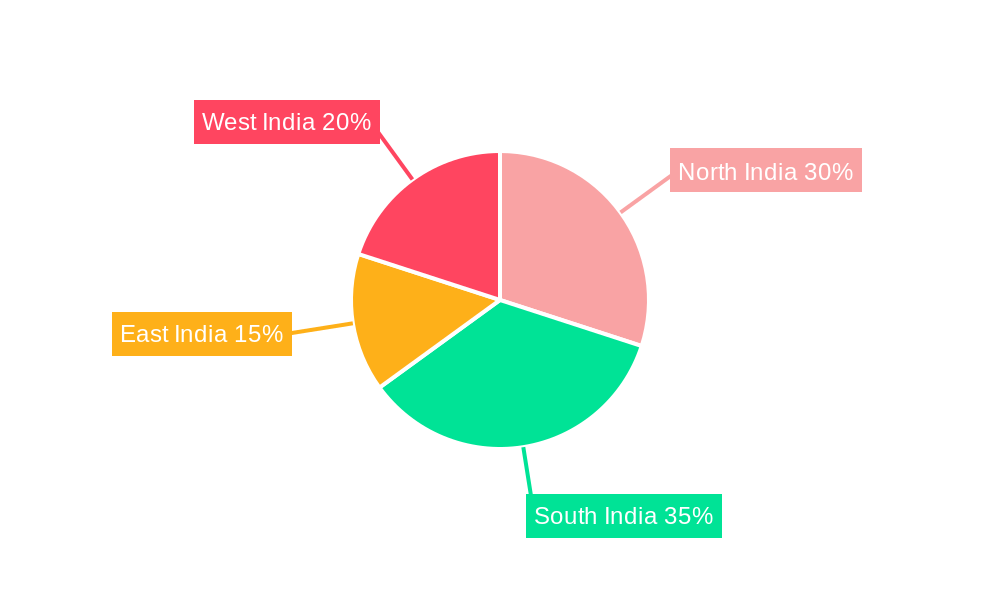
Dominant Markets & Segments in Co-working Office Industry in India
The co-working office market in India is geographically diverse, with key cities like Delhi, Mumbai, and Bangalore leading the charge. This dominance is fueled by factors such as a robust IT sector, a concentration of startups and SMEs, and well-developed infrastructure. Other cities are also witnessing growth, though at a slower pace.
Key Drivers:
- Delhi: Strong presence of IT companies, government agencies, and startups.
- Mumbai: Financial hub with a large corporate presence.
- Bangalore: India's Silicon Valley, attracting significant IT and technology businesses.
Dominance Analysis (By Segment):
- By Type: Flexible managed offices are dominant due to their flexibility and scalability, while serviced offices cater to a niche market requiring a higher level of service.
- By Application: The IT and ITES sector is the largest application segment, followed by consulting and BFSI.
- By End User: Small and medium-sized companies represent a significant share of the market, along with the increasingly important presence of large corporations adopting flexible workspace strategies. Personal users also contribute to market growth, particularly in larger metropolitan areas.
Growth projection for each segment remains dynamic with flexible managed offices expected to maintain the fastest growth rate over the forecast period. The total market size across all segments is projected to reach xx Million USD by 2033, with significant inter-segment variation. Accurate figures require proprietary data from market intelligence firms.
Co-working Office Industry in India Product Developments
Recent product innovations in the Indian co-working industry have focused on enhancing the user experience through technology integration, such as automated booking systems and mobile apps. Companies are also offering customized workspace solutions to cater to specific client needs, incorporating amenities such as event spaces, networking opportunities, and specialized business support services. These features create a competitive advantage by differentiating offerings from traditional office rentals. The emphasis on enhancing the work-life integration through additional services (e.g., wellness facilities) is gaining traction.
Report Scope & Segmentation Analysis
This report analyzes the Indian co-working office market across various segments:
- By Type: Flexible Managed Office, Serviced Office. Flexible managed offices are projected to grow faster due to flexibility and cost-effectiveness.
- By Application: Information Technology (IT and ITES), Legal Services, BFSI, Consulting, Other Services. The IT and ITES sector remains the dominant user.
- By End User: Personal User, Small Scale Company, Large Scale Company, Other End Users. Small to medium-sized businesses are a large user base.
- By Key Cities: Delhi, Mumbai, Bangalore, Other Cities. The top three cities are expected to see continued growth, but other key cities will also see expansion of services.
Each segment’s market size and growth projection are detailed within the full report. The competitive landscape is also analyzed for each segment, identifying key players and their market positions.
Key Drivers of Co-working Office Industry in India Growth
Several factors drive the growth of the Indian co-working industry:
- Technological advancements: Improved booking systems, virtual tours, and smart building features enhancing the experience.
- Economic growth: The rising number of startups and SMEs creates a large pool of potential clients.
- Changing work culture: The increasing preference for flexible work arrangements drives the demand for co-working spaces.
- Government initiatives: Policies supporting entrepreneurship and technological innovation further fuel market growth.
Challenges in the Co-working Office Industry in India Sector
The Indian co-working office industry faces challenges such as:
- High real estate costs: Securing suitable spaces in prime locations can be expensive, affecting profitability.
- Competition: The market is becoming increasingly competitive, requiring continuous innovation to maintain market share.
- Infrastructure limitations: In some locations, inadequate infrastructure may hinder growth.
- Regulatory hurdles: Navigating the complex regulatory environment can create operational challenges.
Emerging Opportunities in Co-working Office Industry in India
Emerging opportunities include:
- Expansion into Tier 2 and Tier 3 cities: Untapped potential in smaller cities with rising demand for flexible workspaces.
- Specialized co-working spaces: Catering to niche industries with unique needs (e.g., creative hubs, tech incubators).
- Hybrid models: Integrating online and offline co-working spaces to create a seamless work experience.
Leading Players in the Co-working Office Industry in India Market
- Awfis
- Mumbai Coworking
- Smartworks
- Cowrks
- Skootr
- WeWork-BKC
- 91 springboard
- Goodworks
- Spring House Coworking
- Innov8-Vikhroli
- Hive
- 63 Other Companies
- Indi Qube
Key Developments in Co-working Office Industry in India Industry
- April 2023: Stylework, a co-working marketplace, secured USD 2 million in Series A1 funding at a USD 20 million valuation. This demonstrates investor confidence in the sector's potential.
- February 2023: WeWork India opened a new center in Pune, adding 1,500 desks and 96,000 square feet of space, signaling strong demand for flexible workspaces.
Strategic Outlook for Co-working Office Industry in India Market
The Indian co-working office market holds significant future potential, driven by sustained economic growth, a growing startup ecosystem, and the increasing popularity of flexible work arrangements. The market will likely witness further consolidation, with larger players acquiring smaller ones. Innovation in technology and service offerings will be crucial for sustained success. Expansion into less-penetrated markets and the development of specialized co-working spaces will present lucrative opportunities for existing and new players. The market shows potential for continued robust growth, positioning India as a key player in the global co-working landscape.
Co-working Office Industry in India Segmentation
-
1. Type
- 1.1. Flexible Managed Office
- 1.2. Serviced Office
-
2. ByApplication
- 2.1. Information Technology (IT and ITES)
- 2.2. Legal Services
- 2.3. BFSI (Banking, Financial Services, and Insurance)
- 2.4. Consulting
- 2.5. Other Services
-
3. End User
- 3.1. Personal User
- 3.2. Small Scale Company
- 3.3. Large Scale Company
- 3.4. Other End Users
-
4. Key Cities
- 4.1. Delhi
- 4.2. Mumbai
- 4.3. Bangalore
- 4.4. Other Cities
Co-working Office Industry in India Segmentation By Geography
-
1. North America
- 1.1. United States
- 1.2. Canada
- 1.3. Mexico
-
2. South America
- 2.1. Brazil
- 2.2. Argentina
- 2.3. Rest of South America
-
3. Europe
- 3.1. United Kingdom
- 3.2. Germany
- 3.3. France
- 3.4. Italy
- 3.5. Spain
- 3.6. Russia
- 3.7. Benelux
- 3.8. Nordics
- 3.9. Rest of Europe
-
4. Middle East & Africa
- 4.1. Turkey
- 4.2. Israel
- 4.3. GCC
- 4.4. North Africa
- 4.5. South Africa
- 4.6. Rest of Middle East & Africa
-
5. Asia Pacific
- 5.1. China
- 5.2. India
- 5.3. Japan
- 5.4. South Korea
- 5.5. ASEAN
- 5.6. Oceania
- 5.7. Rest of Asia Pacific
Co-working Office Industry in India REPORT HIGHLIGHTS
| Aspects | Details |
|---|---|
| Study Period | 2019-2033 |
| Base Year | 2024 |
| Estimated Year | 2025 |
| Forecast Period | 2025-2033 |
| Historical Period | 2019-2024 |
| Growth Rate | CAGR of 7.00% from 2019-2033 |
| Segmentation |
|
Table of Contents
- 1. Introduction
- 1.1. Research Scope
- 1.2. Market Segmentation
- 1.3. Research Methodology
- 1.4. Definitions and Assumptions
- 2. Executive Summary
- 2.1. Introduction
- 3. Market Dynamics
- 3.1. Introduction
- 3.2. Market Drivers
- 3.2.1. 4.; Increase in Number of Startups4.; The Development of Sustainable Co-working Spaces
- 3.3. Market Restrains
- 3.3.1 4.; A Rise in Remote Work4.; Traditional Work Culture in India
- 3.3.2 Which May Not Align Well With the Open and Collaborative Environment of Co-working Spaces
- 3.4. Market Trends
- 3.4.1. Cost Optimization is Driving the Significant Growth in the Sector
- 4. Market Factor Analysis
- 4.1. Porters Five Forces
- 4.2. Supply/Value Chain
- 4.3. PESTEL analysis
- 4.4. Market Entropy
- 4.5. Patent/Trademark Analysis
- 5. Global Co-working Office Industry in India Analysis, Insights and Forecast, 2019-2031
- 5.1. Market Analysis, Insights and Forecast - by Type
- 5.1.1. Flexible Managed Office
- 5.1.2. Serviced Office
- 5.2. Market Analysis, Insights and Forecast - by ByApplication
- 5.2.1. Information Technology (IT and ITES)
- 5.2.2. Legal Services
- 5.2.3. BFSI (Banking, Financial Services, and Insurance)
- 5.2.4. Consulting
- 5.2.5. Other Services
- 5.3. Market Analysis, Insights and Forecast - by End User
- 5.3.1. Personal User
- 5.3.2. Small Scale Company
- 5.3.3. Large Scale Company
- 5.3.4. Other End Users
- 5.4. Market Analysis, Insights and Forecast - by Key Cities
- 5.4.1. Delhi
- 5.4.2. Mumbai
- 5.4.3. Bangalore
- 5.4.4. Other Cities
- 5.5. Market Analysis, Insights and Forecast - by Region
- 5.5.1. North America
- 5.5.2. South America
- 5.5.3. Europe
- 5.5.4. Middle East & Africa
- 5.5.5. Asia Pacific
- 5.1. Market Analysis, Insights and Forecast - by Type
- 6. North America Co-working Office Industry in India Analysis, Insights and Forecast, 2019-2031
- 6.1. Market Analysis, Insights and Forecast - by Type
- 6.1.1. Flexible Managed Office
- 6.1.2. Serviced Office
- 6.2. Market Analysis, Insights and Forecast - by ByApplication
- 6.2.1. Information Technology (IT and ITES)
- 6.2.2. Legal Services
- 6.2.3. BFSI (Banking, Financial Services, and Insurance)
- 6.2.4. Consulting
- 6.2.5. Other Services
- 6.3. Market Analysis, Insights and Forecast - by End User
- 6.3.1. Personal User
- 6.3.2. Small Scale Company
- 6.3.3. Large Scale Company
- 6.3.4. Other End Users
- 6.4. Market Analysis, Insights and Forecast - by Key Cities
- 6.4.1. Delhi
- 6.4.2. Mumbai
- 6.4.3. Bangalore
- 6.4.4. Other Cities
- 6.1. Market Analysis, Insights and Forecast - by Type
- 7. South America Co-working Office Industry in India Analysis, Insights and Forecast, 2019-2031
- 7.1. Market Analysis, Insights and Forecast - by Type
- 7.1.1. Flexible Managed Office
- 7.1.2. Serviced Office
- 7.2. Market Analysis, Insights and Forecast - by ByApplication
- 7.2.1. Information Technology (IT and ITES)
- 7.2.2. Legal Services
- 7.2.3. BFSI (Banking, Financial Services, and Insurance)
- 7.2.4. Consulting
- 7.2.5. Other Services
- 7.3. Market Analysis, Insights and Forecast - by End User
- 7.3.1. Personal User
- 7.3.2. Small Scale Company
- 7.3.3. Large Scale Company
- 7.3.4. Other End Users
- 7.4. Market Analysis, Insights and Forecast - by Key Cities
- 7.4.1. Delhi
- 7.4.2. Mumbai
- 7.4.3. Bangalore
- 7.4.4. Other Cities
- 7.1. Market Analysis, Insights and Forecast - by Type
- 8. Europe Co-working Office Industry in India Analysis, Insights and Forecast, 2019-2031
- 8.1. Market Analysis, Insights and Forecast - by Type
- 8.1.1. Flexible Managed Office
- 8.1.2. Serviced Office
- 8.2. Market Analysis, Insights and Forecast - by ByApplication
- 8.2.1. Information Technology (IT and ITES)
- 8.2.2. Legal Services
- 8.2.3. BFSI (Banking, Financial Services, and Insurance)
- 8.2.4. Consulting
- 8.2.5. Other Services
- 8.3. Market Analysis, Insights and Forecast - by End User
- 8.3.1. Personal User
- 8.3.2. Small Scale Company
- 8.3.3. Large Scale Company
- 8.3.4. Other End Users
- 8.4. Market Analysis, Insights and Forecast - by Key Cities
- 8.4.1. Delhi
- 8.4.2. Mumbai
- 8.4.3. Bangalore
- 8.4.4. Other Cities
- 8.1. Market Analysis, Insights and Forecast - by Type
- 9. Middle East & Africa Co-working Office Industry in India Analysis, Insights and Forecast, 2019-2031
- 9.1. Market Analysis, Insights and Forecast - by Type
- 9.1.1. Flexible Managed Office
- 9.1.2. Serviced Office
- 9.2. Market Analysis, Insights and Forecast - by ByApplication
- 9.2.1. Information Technology (IT and ITES)
- 9.2.2. Legal Services
- 9.2.3. BFSI (Banking, Financial Services, and Insurance)
- 9.2.4. Consulting
- 9.2.5. Other Services
- 9.3. Market Analysis, Insights and Forecast - by End User
- 9.3.1. Personal User
- 9.3.2. Small Scale Company
- 9.3.3. Large Scale Company
- 9.3.4. Other End Users
- 9.4. Market Analysis, Insights and Forecast - by Key Cities
- 9.4.1. Delhi
- 9.4.2. Mumbai
- 9.4.3. Bangalore
- 9.4.4. Other Cities
- 9.1. Market Analysis, Insights and Forecast - by Type
- 10. Asia Pacific Co-working Office Industry in India Analysis, Insights and Forecast, 2019-2031
- 10.1. Market Analysis, Insights and Forecast - by Type
- 10.1.1. Flexible Managed Office
- 10.1.2. Serviced Office
- 10.2. Market Analysis, Insights and Forecast - by ByApplication
- 10.2.1. Information Technology (IT and ITES)
- 10.2.2. Legal Services
- 10.2.3. BFSI (Banking, Financial Services, and Insurance)
- 10.2.4. Consulting
- 10.2.5. Other Services
- 10.3. Market Analysis, Insights and Forecast - by End User
- 10.3.1. Personal User
- 10.3.2. Small Scale Company
- 10.3.3. Large Scale Company
- 10.3.4. Other End Users
- 10.4. Market Analysis, Insights and Forecast - by Key Cities
- 10.4.1. Delhi
- 10.4.2. Mumbai
- 10.4.3. Bangalore
- 10.4.4. Other Cities
- 10.1. Market Analysis, Insights and Forecast - by Type
- 11. North India Co-working Office Industry in India Analysis, Insights and Forecast, 2019-2031
- 12. South India Co-working Office Industry in India Analysis, Insights and Forecast, 2019-2031
- 13. East India Co-working Office Industry in India Analysis, Insights and Forecast, 2019-2031
- 14. West India Co-working Office Industry in India Analysis, Insights and Forecast, 2019-2031
- 15. Competitive Analysis
- 15.1. Global Market Share Analysis 2024
- 15.2. Company Profiles
- 15.2.1 Awfis CBD
- 15.2.1.1. Overview
- 15.2.1.2. Products
- 15.2.1.3. SWOT Analysis
- 15.2.1.4. Recent Developments
- 15.2.1.5. Financials (Based on Availability)
- 15.2.2 Mumbai Coworking
- 15.2.2.1. Overview
- 15.2.2.2. Products
- 15.2.2.3. SWOT Analysis
- 15.2.2.4. Recent Developments
- 15.2.2.5. Financials (Based on Availability)
- 15.2.3 Smartworks
- 15.2.3.1. Overview
- 15.2.3.2. Products
- 15.2.3.3. SWOT Analysis
- 15.2.3.4. Recent Developments
- 15.2.3.5. Financials (Based on Availability)
- 15.2.4 Cowrks
- 15.2.4.1. Overview
- 15.2.4.2. Products
- 15.2.4.3. SWOT Analysis
- 15.2.4.4. Recent Developments
- 15.2.4.5. Financials (Based on Availability)
- 15.2.5 Skootr
- 15.2.5.1. Overview
- 15.2.5.2. Products
- 15.2.5.3. SWOT Analysis
- 15.2.5.4. Recent Developments
- 15.2.5.5. Financials (Based on Availability)
- 15.2.6 We Work-BKC
- 15.2.6.1. Overview
- 15.2.6.2. Products
- 15.2.6.3. SWOT Analysis
- 15.2.6.4. Recent Developments
- 15.2.6.5. Financials (Based on Availability)
- 15.2.7 91 springboard
- 15.2.7.1. Overview
- 15.2.7.2. Products
- 15.2.7.3. SWOT Analysis
- 15.2.7.4. Recent Developments
- 15.2.7.5. Financials (Based on Availability)
- 15.2.8 Goodworks
- 15.2.8.1. Overview
- 15.2.8.2. Products
- 15.2.8.3. SWOT Analysis
- 15.2.8.4. Recent Developments
- 15.2.8.5. Financials (Based on Availability)
- 15.2.9 Spring House Coworking
- 15.2.9.1. Overview
- 15.2.9.2. Products
- 15.2.9.3. SWOT Analysis
- 15.2.9.4. Recent Developments
- 15.2.9.5. Financials (Based on Availability)
- 15.2.10 Innov8-Vikhroli
- 15.2.10.1. Overview
- 15.2.10.2. Products
- 15.2.10.3. SWOT Analysis
- 15.2.10.4. Recent Developments
- 15.2.10.5. Financials (Based on Availability)
- 15.2.11 Hive**List Not Exhaustive 6 3 Other Companie
- 15.2.11.1. Overview
- 15.2.11.2. Products
- 15.2.11.3. SWOT Analysis
- 15.2.11.4. Recent Developments
- 15.2.11.5. Financials (Based on Availability)
- 15.2.12 Indi Qube
- 15.2.12.1. Overview
- 15.2.12.2. Products
- 15.2.12.3. SWOT Analysis
- 15.2.12.4. Recent Developments
- 15.2.12.5. Financials (Based on Availability)
- 15.2.1 Awfis CBD
List of Figures
- Figure 1: Global Co-working Office Industry in India Revenue Breakdown (Million, %) by Region 2024 & 2032
- Figure 2: India Co-working Office Industry in India Revenue (Million), by Country 2024 & 2032
- Figure 3: India Co-working Office Industry in India Revenue Share (%), by Country 2024 & 2032
- Figure 4: North America Co-working Office Industry in India Revenue (Million), by Type 2024 & 2032
- Figure 5: North America Co-working Office Industry in India Revenue Share (%), by Type 2024 & 2032
- Figure 6: North America Co-working Office Industry in India Revenue (Million), by ByApplication 2024 & 2032
- Figure 7: North America Co-working Office Industry in India Revenue Share (%), by ByApplication 2024 & 2032
- Figure 8: North America Co-working Office Industry in India Revenue (Million), by End User 2024 & 2032
- Figure 9: North America Co-working Office Industry in India Revenue Share (%), by End User 2024 & 2032
- Figure 10: North America Co-working Office Industry in India Revenue (Million), by Key Cities 2024 & 2032
- Figure 11: North America Co-working Office Industry in India Revenue Share (%), by Key Cities 2024 & 2032
- Figure 12: North America Co-working Office Industry in India Revenue (Million), by Country 2024 & 2032
- Figure 13: North America Co-working Office Industry in India Revenue Share (%), by Country 2024 & 2032
- Figure 14: South America Co-working Office Industry in India Revenue (Million), by Type 2024 & 2032
- Figure 15: South America Co-working Office Industry in India Revenue Share (%), by Type 2024 & 2032
- Figure 16: South America Co-working Office Industry in India Revenue (Million), by ByApplication 2024 & 2032
- Figure 17: South America Co-working Office Industry in India Revenue Share (%), by ByApplication 2024 & 2032
- Figure 18: South America Co-working Office Industry in India Revenue (Million), by End User 2024 & 2032
- Figure 19: South America Co-working Office Industry in India Revenue Share (%), by End User 2024 & 2032
- Figure 20: South America Co-working Office Industry in India Revenue (Million), by Key Cities 2024 & 2032
- Figure 21: South America Co-working Office Industry in India Revenue Share (%), by Key Cities 2024 & 2032
- Figure 22: South America Co-working Office Industry in India Revenue (Million), by Country 2024 & 2032
- Figure 23: South America Co-working Office Industry in India Revenue Share (%), by Country 2024 & 2032
- Figure 24: Europe Co-working Office Industry in India Revenue (Million), by Type 2024 & 2032
- Figure 25: Europe Co-working Office Industry in India Revenue Share (%), by Type 2024 & 2032
- Figure 26: Europe Co-working Office Industry in India Revenue (Million), by ByApplication 2024 & 2032
- Figure 27: Europe Co-working Office Industry in India Revenue Share (%), by ByApplication 2024 & 2032
- Figure 28: Europe Co-working Office Industry in India Revenue (Million), by End User 2024 & 2032
- Figure 29: Europe Co-working Office Industry in India Revenue Share (%), by End User 2024 & 2032
- Figure 30: Europe Co-working Office Industry in India Revenue (Million), by Key Cities 2024 & 2032
- Figure 31: Europe Co-working Office Industry in India Revenue Share (%), by Key Cities 2024 & 2032
- Figure 32: Europe Co-working Office Industry in India Revenue (Million), by Country 2024 & 2032
- Figure 33: Europe Co-working Office Industry in India Revenue Share (%), by Country 2024 & 2032
- Figure 34: Middle East & Africa Co-working Office Industry in India Revenue (Million), by Type 2024 & 2032
- Figure 35: Middle East & Africa Co-working Office Industry in India Revenue Share (%), by Type 2024 & 2032
- Figure 36: Middle East & Africa Co-working Office Industry in India Revenue (Million), by ByApplication 2024 & 2032
- Figure 37: Middle East & Africa Co-working Office Industry in India Revenue Share (%), by ByApplication 2024 & 2032
- Figure 38: Middle East & Africa Co-working Office Industry in India Revenue (Million), by End User 2024 & 2032
- Figure 39: Middle East & Africa Co-working Office Industry in India Revenue Share (%), by End User 2024 & 2032
- Figure 40: Middle East & Africa Co-working Office Industry in India Revenue (Million), by Key Cities 2024 & 2032
- Figure 41: Middle East & Africa Co-working Office Industry in India Revenue Share (%), by Key Cities 2024 & 2032
- Figure 42: Middle East & Africa Co-working Office Industry in India Revenue (Million), by Country 2024 & 2032
- Figure 43: Middle East & Africa Co-working Office Industry in India Revenue Share (%), by Country 2024 & 2032
- Figure 44: Asia Pacific Co-working Office Industry in India Revenue (Million), by Type 2024 & 2032
- Figure 45: Asia Pacific Co-working Office Industry in India Revenue Share (%), by Type 2024 & 2032
- Figure 46: Asia Pacific Co-working Office Industry in India Revenue (Million), by ByApplication 2024 & 2032
- Figure 47: Asia Pacific Co-working Office Industry in India Revenue Share (%), by ByApplication 2024 & 2032
- Figure 48: Asia Pacific Co-working Office Industry in India Revenue (Million), by End User 2024 & 2032
- Figure 49: Asia Pacific Co-working Office Industry in India Revenue Share (%), by End User 2024 & 2032
- Figure 50: Asia Pacific Co-working Office Industry in India Revenue (Million), by Key Cities 2024 & 2032
- Figure 51: Asia Pacific Co-working Office Industry in India Revenue Share (%), by Key Cities 2024 & 2032
- Figure 52: Asia Pacific Co-working Office Industry in India Revenue (Million), by Country 2024 & 2032
- Figure 53: Asia Pacific Co-working Office Industry in India Revenue Share (%), by Country 2024 & 2032
List of Tables
- Table 1: Global Co-working Office Industry in India Revenue Million Forecast, by Region 2019 & 2032
- Table 2: Global Co-working Office Industry in India Revenue Million Forecast, by Type 2019 & 2032
- Table 3: Global Co-working Office Industry in India Revenue Million Forecast, by ByApplication 2019 & 2032
- Table 4: Global Co-working Office Industry in India Revenue Million Forecast, by End User 2019 & 2032
- Table 5: Global Co-working Office Industry in India Revenue Million Forecast, by Key Cities 2019 & 2032
- Table 6: Global Co-working Office Industry in India Revenue Million Forecast, by Region 2019 & 2032
- Table 7: Global Co-working Office Industry in India Revenue Million Forecast, by Country 2019 & 2032
- Table 8: North India Co-working Office Industry in India Revenue (Million) Forecast, by Application 2019 & 2032
- Table 9: South India Co-working Office Industry in India Revenue (Million) Forecast, by Application 2019 & 2032
- Table 10: East India Co-working Office Industry in India Revenue (Million) Forecast, by Application 2019 & 2032
- Table 11: West India Co-working Office Industry in India Revenue (Million) Forecast, by Application 2019 & 2032
- Table 12: Global Co-working Office Industry in India Revenue Million Forecast, by Type 2019 & 2032
- Table 13: Global Co-working Office Industry in India Revenue Million Forecast, by ByApplication 2019 & 2032
- Table 14: Global Co-working Office Industry in India Revenue Million Forecast, by End User 2019 & 2032
- Table 15: Global Co-working Office Industry in India Revenue Million Forecast, by Key Cities 2019 & 2032
- Table 16: Global Co-working Office Industry in India Revenue Million Forecast, by Country 2019 & 2032
- Table 17: United States Co-working Office Industry in India Revenue (Million) Forecast, by Application 2019 & 2032
- Table 18: Canada Co-working Office Industry in India Revenue (Million) Forecast, by Application 2019 & 2032
- Table 19: Mexico Co-working Office Industry in India Revenue (Million) Forecast, by Application 2019 & 2032
- Table 20: Global Co-working Office Industry in India Revenue Million Forecast, by Type 2019 & 2032
- Table 21: Global Co-working Office Industry in India Revenue Million Forecast, by ByApplication 2019 & 2032
- Table 22: Global Co-working Office Industry in India Revenue Million Forecast, by End User 2019 & 2032
- Table 23: Global Co-working Office Industry in India Revenue Million Forecast, by Key Cities 2019 & 2032
- Table 24: Global Co-working Office Industry in India Revenue Million Forecast, by Country 2019 & 2032
- Table 25: Brazil Co-working Office Industry in India Revenue (Million) Forecast, by Application 2019 & 2032
- Table 26: Argentina Co-working Office Industry in India Revenue (Million) Forecast, by Application 2019 & 2032
- Table 27: Rest of South America Co-working Office Industry in India Revenue (Million) Forecast, by Application 2019 & 2032
- Table 28: Global Co-working Office Industry in India Revenue Million Forecast, by Type 2019 & 2032
- Table 29: Global Co-working Office Industry in India Revenue Million Forecast, by ByApplication 2019 & 2032
- Table 30: Global Co-working Office Industry in India Revenue Million Forecast, by End User 2019 & 2032
- Table 31: Global Co-working Office Industry in India Revenue Million Forecast, by Key Cities 2019 & 2032
- Table 32: Global Co-working Office Industry in India Revenue Million Forecast, by Country 2019 & 2032
- Table 33: United Kingdom Co-working Office Industry in India Revenue (Million) Forecast, by Application 2019 & 2032
- Table 34: Germany Co-working Office Industry in India Revenue (Million) Forecast, by Application 2019 & 2032
- Table 35: France Co-working Office Industry in India Revenue (Million) Forecast, by Application 2019 & 2032
- Table 36: Italy Co-working Office Industry in India Revenue (Million) Forecast, by Application 2019 & 2032
- Table 37: Spain Co-working Office Industry in India Revenue (Million) Forecast, by Application 2019 & 2032
- Table 38: Russia Co-working Office Industry in India Revenue (Million) Forecast, by Application 2019 & 2032
- Table 39: Benelux Co-working Office Industry in India Revenue (Million) Forecast, by Application 2019 & 2032
- Table 40: Nordics Co-working Office Industry in India Revenue (Million) Forecast, by Application 2019 & 2032
- Table 41: Rest of Europe Co-working Office Industry in India Revenue (Million) Forecast, by Application 2019 & 2032
- Table 42: Global Co-working Office Industry in India Revenue Million Forecast, by Type 2019 & 2032
- Table 43: Global Co-working Office Industry in India Revenue Million Forecast, by ByApplication 2019 & 2032
- Table 44: Global Co-working Office Industry in India Revenue Million Forecast, by End User 2019 & 2032
- Table 45: Global Co-working Office Industry in India Revenue Million Forecast, by Key Cities 2019 & 2032
- Table 46: Global Co-working Office Industry in India Revenue Million Forecast, by Country 2019 & 2032
- Table 47: Turkey Co-working Office Industry in India Revenue (Million) Forecast, by Application 2019 & 2032
- Table 48: Israel Co-working Office Industry in India Revenue (Million) Forecast, by Application 2019 & 2032
- Table 49: GCC Co-working Office Industry in India Revenue (Million) Forecast, by Application 2019 & 2032
- Table 50: North Africa Co-working Office Industry in India Revenue (Million) Forecast, by Application 2019 & 2032
- Table 51: South Africa Co-working Office Industry in India Revenue (Million) Forecast, by Application 2019 & 2032
- Table 52: Rest of Middle East & Africa Co-working Office Industry in India Revenue (Million) Forecast, by Application 2019 & 2032
- Table 53: Global Co-working Office Industry in India Revenue Million Forecast, by Type 2019 & 2032
- Table 54: Global Co-working Office Industry in India Revenue Million Forecast, by ByApplication 2019 & 2032
- Table 55: Global Co-working Office Industry in India Revenue Million Forecast, by End User 2019 & 2032
- Table 56: Global Co-working Office Industry in India Revenue Million Forecast, by Key Cities 2019 & 2032
- Table 57: Global Co-working Office Industry in India Revenue Million Forecast, by Country 2019 & 2032
- Table 58: China Co-working Office Industry in India Revenue (Million) Forecast, by Application 2019 & 2032
- Table 59: India Co-working Office Industry in India Revenue (Million) Forecast, by Application 2019 & 2032
- Table 60: Japan Co-working Office Industry in India Revenue (Million) Forecast, by Application 2019 & 2032
- Table 61: South Korea Co-working Office Industry in India Revenue (Million) Forecast, by Application 2019 & 2032
- Table 62: ASEAN Co-working Office Industry in India Revenue (Million) Forecast, by Application 2019 & 2032
- Table 63: Oceania Co-working Office Industry in India Revenue (Million) Forecast, by Application 2019 & 2032
- Table 64: Rest of Asia Pacific Co-working Office Industry in India Revenue (Million) Forecast, by Application 2019 & 2032
Frequently Asked Questions
1. What is the projected Compound Annual Growth Rate (CAGR) of the Co-working Office Industry in India?
The projected CAGR is approximately 7.00%.
2. Which companies are prominent players in the Co-working Office Industry in India?
Key companies in the market include Awfis CBD, Mumbai Coworking, Smartworks, Cowrks, Skootr, We Work-BKC, 91 springboard, Goodworks, Spring House Coworking, Innov8-Vikhroli, Hive**List Not Exhaustive 6 3 Other Companie, Indi Qube.
3. What are the main segments of the Co-working Office Industry in India?
The market segments include Type, ByApplication, End User, Key Cities.
4. Can you provide details about the market size?
The market size is estimated to be USD 1.94 Million as of 2022.
5. What are some drivers contributing to market growth?
4.; Increase in Number of Startups4.; The Development of Sustainable Co-working Spaces.
6. What are the notable trends driving market growth?
Cost Optimization is Driving the Significant Growth in the Sector.
7. Are there any restraints impacting market growth?
4.; A Rise in Remote Work4.; Traditional Work Culture in India. Which May Not Align Well With the Open and Collaborative Environment of Co-working Spaces.
8. Can you provide examples of recent developments in the market?
April 2023: Stylework, a co-working marketplace, raised USD 2 million at a USD 20 million valued deal. Stylework's impressive growth and innovative approach caught the industry's attention, leading to a successful Series A1 funding of USD 2 million at a USD 20 million valued deal from institutional investors, including Capriglobal Holdings, QI Ventures, and some undisclosed family offices.
9. What pricing options are available for accessing the report?
Pricing options include single-user, multi-user, and enterprise licenses priced at USD 3800, USD 4500, and USD 5800 respectively.
10. Is the market size provided in terms of value or volume?
The market size is provided in terms of value, measured in Million.
11. Are there any specific market keywords associated with the report?
Yes, the market keyword associated with the report is "Co-working Office Industry in India," which aids in identifying and referencing the specific market segment covered.
12. How do I determine which pricing option suits my needs best?
The pricing options vary based on user requirements and access needs. Individual users may opt for single-user licenses, while businesses requiring broader access may choose multi-user or enterprise licenses for cost-effective access to the report.
13. Are there any additional resources or data provided in the Co-working Office Industry in India report?
While the report offers comprehensive insights, it's advisable to review the specific contents or supplementary materials provided to ascertain if additional resources or data are available.
14. How can I stay updated on further developments or reports in the Co-working Office Industry in India?
To stay informed about further developments, trends, and reports in the Co-working Office Industry in India, consider subscribing to industry newsletters, following relevant companies and organizations, or regularly checking reputable industry news sources and publications.
Methodology
Step 1 - Identification of Relevant Samples Size from Population Database


Step 2 - Approaches for Defining Global Market Size (Value, Volume* & Price*)

Note*: In applicable scenarios
Step 3 - Data Sources
Primary Research
- Web Analytics
- Survey Reports
- Research Institute
- Latest Research Reports
- Opinion Leaders
Secondary Research
- Annual Reports
- White Paper
- Latest Press Release
- Industry Association
- Paid Database
- Investor Presentations

Step 4 - Data Triangulation
Involves using different sources of information in order to increase the validity of a study
These sources are likely to be stakeholders in a program - participants, other researchers, program staff, other community members, and so on.
Then we put all data in single framework & apply various statistical tools to find out the dynamic on the market.
During the analysis stage, feedback from the stakeholder groups would be compared to determine areas of agreement as well as areas of divergence


