

Key Insights
The Canadian luxury housing market, encompassing high-end apartments, condominiums, villas, and landed houses, is experiencing robust growth, fueled by a confluence of factors. A strong economy, particularly in major cities like Toronto, Vancouver, and Montreal, coupled with a limited supply of premium properties, continues to drive demand and price escalation. Foreign investment, particularly from high-net-worth individuals seeking safe haven assets and lifestyle benefits, significantly contributes to this trend. Furthermore, low interest rates in recent years (though this is shifting), although impacting affordability for the broader market, have further stimulated demand within the luxury segment where buyers are less sensitive to rate fluctuations. The market's segmentation reveals distinct dynamics; for example, Vancouver's luxury market might be more influenced by Asian investment, while Toronto sees strong domestic and American buyer activity. This diversity creates opportunities for developers catering to specific preferences and market segments.
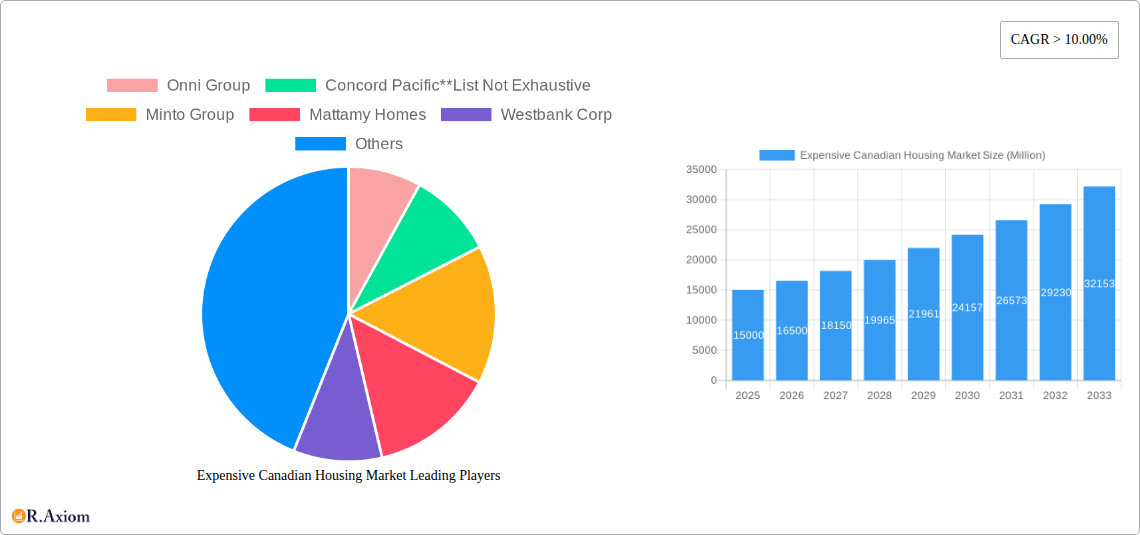
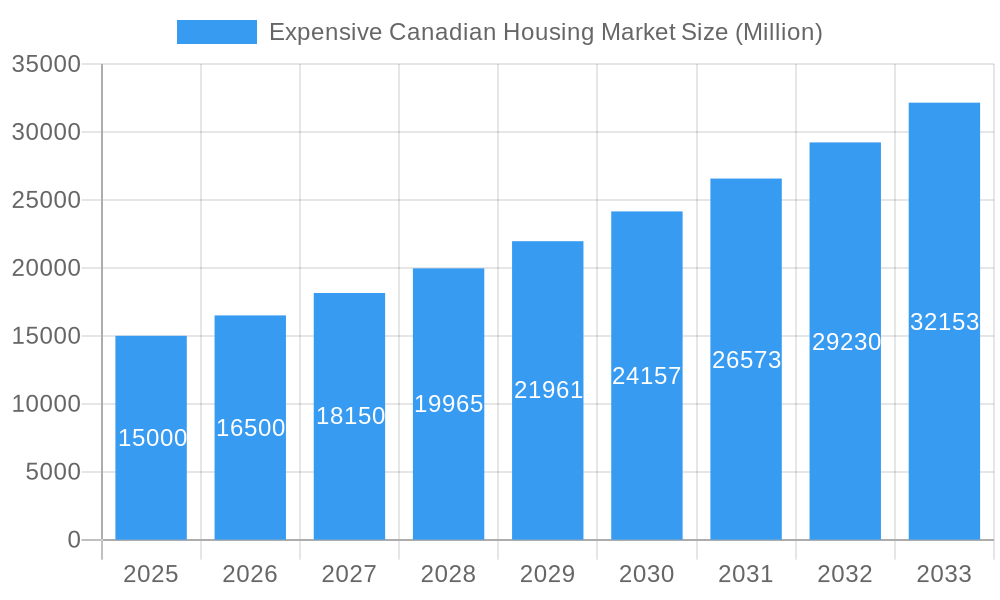
Expensive Canadian Housing Market Market Size (In Billion)
However, challenges remain. Increasing construction costs and regulatory hurdles are impacting the pace of new luxury developments. Furthermore, macroeconomic uncertainties, including potential interest rate hikes and global economic slowdown, could moderate future growth. Despite these headwinds, the long-term outlook remains positive, driven by Canada's strong immigration policies, sustained economic growth in key regions, and the enduring appeal of Canadian luxury properties as both primary residences and investment vehicles. The market's resilience is evident in its consistent CAGR exceeding 10% since 2019, signifying continuous upward momentum despite cyclical fluctuations. The diverse developer landscape, including established players like Onni Group, Concord Pacific, and Mattamy Homes, ensures competition and innovation within the sector, contributing to the market's dynamic nature.
Expensive Canadian Housing Market Company Market Share
Expensive Canadian Housing Market: A Comprehensive Report (2019-2033)
This in-depth report provides a comprehensive analysis of the expensive Canadian housing market, offering invaluable insights for investors, developers, and industry stakeholders. Covering the period from 2019 to 2033, with a base year of 2025 and a forecast period spanning 2025-2033, this report meticulously examines market trends, key players, and future growth prospects. The report values are expressed in Millions.
Expensive Canadian Housing Market Market Concentration & Innovation
This section analyzes the market concentration within the expensive Canadian housing sector, focusing on key players like Onni Group, Concord Pacific, Minto Group, Mattamy Homes, Westbank Corp, The Daniels Corporation, Valencia Residential, Amacon, Brookfield Residential, and Oxford Properties Group (list not exhaustive). We examine market share dynamics, highlighting the influence of major players and the emergence of new entrants. The report assesses innovation drivers, such as technological advancements in construction and design, along with the impact of regulatory frameworks on market competition and development. We also explore the role of product substitutes, evolving end-user trends (e.g., preferences for sustainable housing), and the impact of mergers and acquisitions (M&A) activity. The analysis includes an examination of M&A deal values from the historical period (2019-2024) and projected values for the forecast period (2025-2033), with specific examples of significant deals affecting market concentration. For example, the xx Million acquisition of X company by Y company in 2022 significantly altered the market share in the Vancouver condominium segment. The report also explores the average deal value, concluding with an estimate of xx Million in 2033.
Expensive Canadian Housing Market Industry Trends & Insights
This section dives deep into the evolving dynamics of the Canadian luxury housing market. We analyze the market growth drivers, including demographic shifts, urbanization, and economic factors. Specific metrics, such as Compound Annual Growth Rate (CAGR) for different segments and market penetration rates of new technologies, are analyzed for the historical period (2019-2024) and projected for the forecast period (2025-2033). This section discusses technological disruptions, like the increased adoption of prefabricated construction methods and smart home technology. We also explore shifting consumer preferences, focusing on demand for sustainable and energy-efficient homes, luxury amenities, and desirable locations. Competitive dynamics, including pricing strategies, brand positioning, and differentiation tactics employed by leading companies are evaluated. We project a CAGR of xx% for the luxury condo market in Vancouver between 2025 and 2033, driven by a projected increase in high-net-worth individuals and continued demand for waterfront properties. Market penetration of smart home technology is projected to reach xx% by 2033.
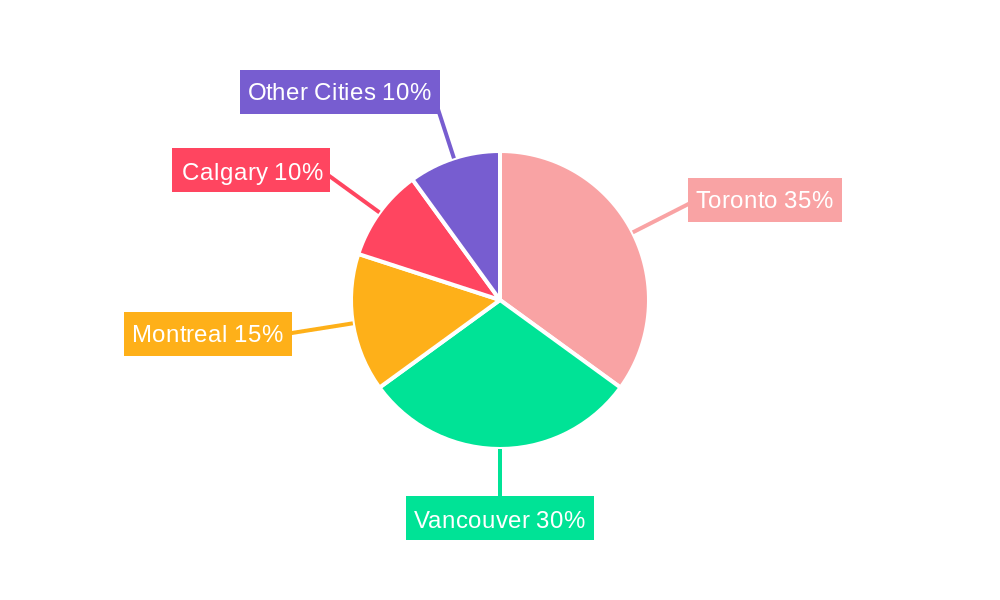
Dominant Markets & Segments in Expensive Canadian Housing Market
This section identifies the leading markets and segments within the expensive Canadian housing sector. We analyze the dominance of specific cities (Toronto, Montreal, Vancouver, Calgary, and other cities) and housing types (Apartments and Condominiums, Villas and Landed Houses).
Key Drivers of Dominance:
- Toronto: Strong economic activity, diverse population, and robust infrastructure.
- Vancouver: Desirable location, stunning natural scenery, and limited land availability.
- Montreal: Relatively lower prices compared to Toronto and Vancouver, attracting investors.
- Calgary: Energy sector influence, strong economy (prior to recent downturns), and relatively affordable housing compared to other major cities.
Dominance analysis includes detailed examinations of market size, growth projections, and key factors driving each segment's performance. For instance, Vancouver's luxury condo market is analyzed in detail, highlighting the impact of foreign investment, limited land supply, and rising construction costs on pricing and market dynamics. The projected market size of luxury villas in Toronto in 2033 is estimated at xx Million.
Expensive Canadian Housing Market Product Developments
This section summarizes the latest innovations in product development within the expensive Canadian housing market. It analyzes the introduction of new technologies, such as sustainable building materials, smart home integration, and innovative architectural designs, and evaluates their impact on market competitiveness. The focus is on how these technological advancements are improving energy efficiency, enhancing living experiences, and catering to evolving consumer preferences, providing competitive advantages for developers. For example, the increasing popularity of net-zero energy homes is driving product innovation and market differentiation.
Report Scope & Segmentation Analysis
This report comprehensively analyzes the expensive Canadian housing market based on several key segmentations:
By Type:
- Apartments and Condominiums: This segment is analyzed regarding size, location, and amenities. Growth is projected at xx% CAGR from 2025 to 2033, driven by urbanization and higher demand for urban living.
- Villas and Landed Houses: The analysis here explores various villa types, sizes, and locations. Projected market size in 2033 is estimated to be xx Million, fueled by increasing disposable incomes.
By Cities:
- Toronto, Montreal, Vancouver, Calgary, Other Cities: Each city's market is analyzed individually, considering its unique economic conditions, demographic trends, and regulatory frameworks. Market sizes for each city are provided, along with competitive landscapes and growth projections. For instance, the report estimates that Toronto's luxury housing market will be worth xx Million in 2033.
Key Drivers of Expensive Canadian Housing Market Growth
Key drivers for the expensive Canadian housing market's growth include robust economic conditions (prior to economic downturn), increasing disposable incomes, population growth, particularly in urban centers, and favorable government policies supporting housing development. Technological advancements in construction and design have also contributed, enhancing building efficiency and creating more luxurious living spaces. Further, limited land availability in prime locations acts as a significant driver of higher prices.
Challenges in the Expensive Canadian Housing Market Sector
The expensive Canadian housing market faces challenges, including stringent building codes and regulations, increasing construction costs, and the availability of skilled labor. Supply chain disruptions can impact project timelines and budgets. Furthermore, intense competition among developers requires innovative solutions to attract buyers in a dynamic market with shifts in consumer preferences. The average cost increase per project due to supply chain issues is estimated at xx Million for the forecast period.
Emerging Opportunities in Expensive Canadian Housing Market
Emerging opportunities include growing demand for sustainable and eco-friendly housing, innovative financing options, and the adoption of smart home technologies. Furthermore, the increasing popularity of co-living spaces and multi-generational housing caters to evolving lifestyle preferences. Government initiatives to promote affordable housing and energy efficiency also provide opportunities for innovative development models.
Leading Players in the Expensive Canadian Housing Market Market
- Onni Group
- Concord Pacific
- Minto Group
- Mattamy Homes
- Westbank Corp
- The Daniels Corporation
- Valencia Residential
- Amacon
- Brookfield Residential
- Oxford Properties Group
Key Developments in Expensive Canadian Housing Market Industry
- 2022 Q4: Introduction of new eco-friendly building materials by Brookfield Residential, significantly reducing carbon footprint in new projects.
- 2023 Q1: Onni Group announces a major mixed-use development in downtown Toronto, incorporating smart home technologies.
- 2024 Q2: Concord Pacific merges with a smaller developer, expanding its market share in Vancouver.
- (Further key developments will be listed in the full report)
Strategic Outlook for Expensive Canadian Housing Market Market
The future of the expensive Canadian housing market shows significant potential for continued growth, driven by ongoing urbanization, improving economic conditions, and the sustained demand for high-quality, luxury homes. Technological innovations will further shape the market, offering opportunities for sustainable and smart living solutions. However, careful consideration of challenges such as affordability and environmental sustainability will be crucial for ensuring long-term growth and market stability.
Expensive Canadian Housing Market Segmentation
-
1. Type
- 1.1. Apartments and Condominiums
- 1.2. Villas and Landed Houses
-
2. Cities
- 2.1. Toronto
- 2.2. Montreal
- 2.3. Vancouver
- 2.4. Calgary
- 2.5. Other Cities
Expensive Canadian Housing Market Segmentation By Geography
-
1. North America
- 1.1. United States
- 1.2. Canada
- 1.3. Mexico
-
2. South America
- 2.1. Brazil
- 2.2. Argentina
- 2.3. Rest of South America
-
3. Europe
- 3.1. United Kingdom
- 3.2. Germany
- 3.3. France
- 3.4. Italy
- 3.5. Spain
- 3.6. Russia
- 3.7. Benelux
- 3.8. Nordics
- 3.9. Rest of Europe
-
4. Middle East & Africa
- 4.1. Turkey
- 4.2. Israel
- 4.3. GCC
- 4.4. North Africa
- 4.5. South Africa
- 4.6. Rest of Middle East & Africa
-
5. Asia Pacific
- 5.1. China
- 5.2. India
- 5.3. Japan
- 5.4. South Korea
- 5.5. ASEAN
- 5.6. Oceania
- 5.7. Rest of Asia Pacific
Expensive Canadian Housing Market Regional Market Share
Geographic Coverage of Expensive Canadian Housing Market
Expensive Canadian Housing Market REPORT HIGHLIGHTS
| Aspects | Details |
|---|---|
| Study Period | 2020-2034 |
| Base Year | 2025 |
| Estimated Year | 2026 |
| Forecast Period | 2026-2034 |
| Historical Period | 2020-2025 |
| Growth Rate | CAGR of > 10.00% from 2020-2034 |
| Segmentation |
|
Table of Contents
- 1. Introduction
- 1.1. Research Scope
- 1.2. Market Segmentation
- 1.3. Research Objective
- 1.4. Definitions and Assumptions
- 2. Executive Summary
- 2.1. Market Snapshot
- 3. Market Dynamics
- 3.1. Market Drivers
- 3.2. Market Restrains
- 3.3. Market Trends
- 3.4. Market Opportunities
- 4. Market Factor Analysis
- 4.1. Porters Five Forces
- 4.1.1. Bargaining Power of Suppliers
- 4.1.2. Bargaining Power of Buyers
- 4.1.3. Threat of New Entrants
- 4.1.4. Threat of Substitutes
- 4.1.5. Competitive Rivalry
- 4.2. PESTEL analysis
- 4.3. BCG Analysis
- 4.3.1. Stars (High Growth, High Market Share)
- 4.3.2. Cash Cows (Low Growth, High Market Share)
- 4.3.3. Question Mark (High Growth, Low Market Share)
- 4.3.4. Dogs (Low Growth, Low Market Share)
- 4.4. Ansoff Matrix Analysis
- 4.5. Supply Chain Analysis
- 4.6. Regulatory Landscape
- 4.7. Current Market Potential and Opportunity Assessment (TAM–SAM–SOM Framework)
- 4.8. RAX Analyst Note
- 4.1. Porters Five Forces
- 5. Market Analysis, Insights and Forecast 2021-2033
- 5.1. Market Analysis, Insights and Forecast - by Type
- 5.1.1. Apartments and Condominiums
- 5.1.2. Villas and Landed Houses
- 5.2. Market Analysis, Insights and Forecast - by Cities
- 5.2.1. Toronto
- 5.2.2. Montreal
- 5.2.3. Vancouver
- 5.2.4. Calgary
- 5.2.5. Other Cities
- 5.3. Market Analysis, Insights and Forecast - by Region
- 5.3.1. North America
- 5.3.2. South America
- 5.3.3. Europe
- 5.3.4. Middle East & Africa
- 5.3.5. Asia Pacific
- 5.1. Market Analysis, Insights and Forecast - by Type
- 6. Global Expensive Canadian Housing Market Analysis, Insights and Forecast, 2021-2033
- 6.1. Market Analysis, Insights and Forecast - by Type
- 6.1.1. Apartments and Condominiums
- 6.1.2. Villas and Landed Houses
- 6.2. Market Analysis, Insights and Forecast - by Cities
- 6.2.1. Toronto
- 6.2.2. Montreal
- 6.2.3. Vancouver
- 6.2.4. Calgary
- 6.2.5. Other Cities
- 6.1. Market Analysis, Insights and Forecast - by Type
- 7. North America Expensive Canadian Housing Market Analysis, Insights and Forecast, 2020-2032
- 7.1. Market Analysis, Insights and Forecast - by Type
- 7.1.1. Apartments and Condominiums
- 7.1.2. Villas and Landed Houses
- 7.2. Market Analysis, Insights and Forecast - by Cities
- 7.2.1. Toronto
- 7.2.2. Montreal
- 7.2.3. Vancouver
- 7.2.4. Calgary
- 7.2.5. Other Cities
- 7.1. Market Analysis, Insights and Forecast - by Type
- 8. South America Expensive Canadian Housing Market Analysis, Insights and Forecast, 2020-2032
- 8.1. Market Analysis, Insights and Forecast - by Type
- 8.1.1. Apartments and Condominiums
- 8.1.2. Villas and Landed Houses
- 8.2. Market Analysis, Insights and Forecast - by Cities
- 8.2.1. Toronto
- 8.2.2. Montreal
- 8.2.3. Vancouver
- 8.2.4. Calgary
- 8.2.5. Other Cities
- 8.1. Market Analysis, Insights and Forecast - by Type
- 9. Europe Expensive Canadian Housing Market Analysis, Insights and Forecast, 2020-2032
- 9.1. Market Analysis, Insights and Forecast - by Type
- 9.1.1. Apartments and Condominiums
- 9.1.2. Villas and Landed Houses
- 9.2. Market Analysis, Insights and Forecast - by Cities
- 9.2.1. Toronto
- 9.2.2. Montreal
- 9.2.3. Vancouver
- 9.2.4. Calgary
- 9.2.5. Other Cities
- 9.1. Market Analysis, Insights and Forecast - by Type
- 10. Middle East & Africa Expensive Canadian Housing Market Analysis, Insights and Forecast, 2020-2032
- 10.1. Market Analysis, Insights and Forecast - by Type
- 10.1.1. Apartments and Condominiums
- 10.1.2. Villas and Landed Houses
- 10.2. Market Analysis, Insights and Forecast - by Cities
- 10.2.1. Toronto
- 10.2.2. Montreal
- 10.2.3. Vancouver
- 10.2.4. Calgary
- 10.2.5. Other Cities
- 10.1. Market Analysis, Insights and Forecast - by Type
- 11. Asia Pacific Expensive Canadian Housing Market Analysis, Insights and Forecast, 2020-2032
- 11.1. Market Analysis, Insights and Forecast - by Type
- 11.1.1. Apartments and Condominiums
- 11.1.2. Villas and Landed Houses
- 11.2. Market Analysis, Insights and Forecast - by Cities
- 11.2.1. Toronto
- 11.2.2. Montreal
- 11.2.3. Vancouver
- 11.2.4. Calgary
- 11.2.5. Other Cities
- 11.1. Market Analysis, Insights and Forecast - by Type
- 12. Competitive Analysis
- 12.1. Company Profiles
- 12.1.1 Onni Group
- 12.1.1.1. Company Overview
- 12.1.1.2. Products
- 12.1.1.3. Company Financials
- 12.1.1.4. SWOT Analysis
- 12.1.2 Concord Pacific**List Not Exhaustive
- 12.1.2.1. Company Overview
- 12.1.2.2. Products
- 12.1.2.3. Company Financials
- 12.1.2.4. SWOT Analysis
- 12.1.3 Minto Group
- 12.1.3.1. Company Overview
- 12.1.3.2. Products
- 12.1.3.3. Company Financials
- 12.1.3.4. SWOT Analysis
- 12.1.4 Mattamy Homes
- 12.1.4.1. Company Overview
- 12.1.4.2. Products
- 12.1.4.3. Company Financials
- 12.1.4.4. SWOT Analysis
- 12.1.5 Westbank Corp
- 12.1.5.1. Company Overview
- 12.1.5.2. Products
- 12.1.5.3. Company Financials
- 12.1.5.4. SWOT Analysis
- 12.1.6 The Daniels Corporation
- 12.1.6.1. Company Overview
- 12.1.6.2. Products
- 12.1.6.3. Company Financials
- 12.1.6.4. SWOT Analysis
- 12.1.7 Valencia Residential
- 12.1.7.1. Company Overview
- 12.1.7.2. Products
- 12.1.7.3. Company Financials
- 12.1.7.4. SWOT Analysis
- 12.1.8 Amacon
- 12.1.8.1. Company Overview
- 12.1.8.2. Products
- 12.1.8.3. Company Financials
- 12.1.8.4. SWOT Analysis
- 12.1.9 Brookfield Residential
- 12.1.9.1. Company Overview
- 12.1.9.2. Products
- 12.1.9.3. Company Financials
- 12.1.9.4. SWOT Analysis
- 12.1.10 Oxford Properties Group
- 12.1.10.1. Company Overview
- 12.1.10.2. Products
- 12.1.10.3. Company Financials
- 12.1.10.4. SWOT Analysis
- 12.1.1 Onni Group
- 12.2. Market Entropy
- 12.2.1 Company's Key Areas Served
- 12.2.2 Recent Developments
- 12.3. Company Market Share Analysis 2025
- 12.3.1 Top 5 Companies Market Share Analysis
- 12.3.2 Top 3 Companies Market Share Analysis
- 12.4. List of Potential Customers
- 13. Research Methodology
List of Figures
- Figure 1: Global Expensive Canadian Housing Market Revenue Breakdown (Million, %) by Region 2025 & 2033
- Figure 2: North America Expensive Canadian Housing Market Revenue (Million), by Type 2025 & 2033
- Figure 3: North America Expensive Canadian Housing Market Revenue Share (%), by Type 2025 & 2033
- Figure 4: North America Expensive Canadian Housing Market Revenue (Million), by Cities 2025 & 2033
- Figure 5: North America Expensive Canadian Housing Market Revenue Share (%), by Cities 2025 & 2033
- Figure 6: North America Expensive Canadian Housing Market Revenue (Million), by Country 2025 & 2033
- Figure 7: North America Expensive Canadian Housing Market Revenue Share (%), by Country 2025 & 2033
- Figure 8: South America Expensive Canadian Housing Market Revenue (Million), by Type 2025 & 2033
- Figure 9: South America Expensive Canadian Housing Market Revenue Share (%), by Type 2025 & 2033
- Figure 10: South America Expensive Canadian Housing Market Revenue (Million), by Cities 2025 & 2033
- Figure 11: South America Expensive Canadian Housing Market Revenue Share (%), by Cities 2025 & 2033
- Figure 12: South America Expensive Canadian Housing Market Revenue (Million), by Country 2025 & 2033
- Figure 13: South America Expensive Canadian Housing Market Revenue Share (%), by Country 2025 & 2033
- Figure 14: Europe Expensive Canadian Housing Market Revenue (Million), by Type 2025 & 2033
- Figure 15: Europe Expensive Canadian Housing Market Revenue Share (%), by Type 2025 & 2033
- Figure 16: Europe Expensive Canadian Housing Market Revenue (Million), by Cities 2025 & 2033
- Figure 17: Europe Expensive Canadian Housing Market Revenue Share (%), by Cities 2025 & 2033
- Figure 18: Europe Expensive Canadian Housing Market Revenue (Million), by Country 2025 & 2033
- Figure 19: Europe Expensive Canadian Housing Market Revenue Share (%), by Country 2025 & 2033
- Figure 20: Middle East & Africa Expensive Canadian Housing Market Revenue (Million), by Type 2025 & 2033
- Figure 21: Middle East & Africa Expensive Canadian Housing Market Revenue Share (%), by Type 2025 & 2033
- Figure 22: Middle East & Africa Expensive Canadian Housing Market Revenue (Million), by Cities 2025 & 2033
- Figure 23: Middle East & Africa Expensive Canadian Housing Market Revenue Share (%), by Cities 2025 & 2033
- Figure 24: Middle East & Africa Expensive Canadian Housing Market Revenue (Million), by Country 2025 & 2033
- Figure 25: Middle East & Africa Expensive Canadian Housing Market Revenue Share (%), by Country 2025 & 2033
- Figure 26: Asia Pacific Expensive Canadian Housing Market Revenue (Million), by Type 2025 & 2033
- Figure 27: Asia Pacific Expensive Canadian Housing Market Revenue Share (%), by Type 2025 & 2033
- Figure 28: Asia Pacific Expensive Canadian Housing Market Revenue (Million), by Cities 2025 & 2033
- Figure 29: Asia Pacific Expensive Canadian Housing Market Revenue Share (%), by Cities 2025 & 2033
- Figure 30: Asia Pacific Expensive Canadian Housing Market Revenue (Million), by Country 2025 & 2033
- Figure 31: Asia Pacific Expensive Canadian Housing Market Revenue Share (%), by Country 2025 & 2033
List of Tables
- Table 1: Global Expensive Canadian Housing Market Revenue Million Forecast, by Type 2020 & 2033
- Table 2: Global Expensive Canadian Housing Market Revenue Million Forecast, by Cities 2020 & 2033
- Table 3: Global Expensive Canadian Housing Market Revenue Million Forecast, by Region 2020 & 2033
- Table 4: Global Expensive Canadian Housing Market Revenue Million Forecast, by Type 2020 & 2033
- Table 5: Global Expensive Canadian Housing Market Revenue Million Forecast, by Cities 2020 & 2033
- Table 6: Global Expensive Canadian Housing Market Revenue Million Forecast, by Country 2020 & 2033
- Table 7: United States Expensive Canadian Housing Market Revenue (Million) Forecast, by Application 2020 & 2033
- Table 8: Canada Expensive Canadian Housing Market Revenue (Million) Forecast, by Application 2020 & 2033
- Table 9: Mexico Expensive Canadian Housing Market Revenue (Million) Forecast, by Application 2020 & 2033
- Table 10: Global Expensive Canadian Housing Market Revenue Million Forecast, by Type 2020 & 2033
- Table 11: Global Expensive Canadian Housing Market Revenue Million Forecast, by Cities 2020 & 2033
- Table 12: Global Expensive Canadian Housing Market Revenue Million Forecast, by Country 2020 & 2033
- Table 13: Brazil Expensive Canadian Housing Market Revenue (Million) Forecast, by Application 2020 & 2033
- Table 14: Argentina Expensive Canadian Housing Market Revenue (Million) Forecast, by Application 2020 & 2033
- Table 15: Rest of South America Expensive Canadian Housing Market Revenue (Million) Forecast, by Application 2020 & 2033
- Table 16: Global Expensive Canadian Housing Market Revenue Million Forecast, by Type 2020 & 2033
- Table 17: Global Expensive Canadian Housing Market Revenue Million Forecast, by Cities 2020 & 2033
- Table 18: Global Expensive Canadian Housing Market Revenue Million Forecast, by Country 2020 & 2033
- Table 19: United Kingdom Expensive Canadian Housing Market Revenue (Million) Forecast, by Application 2020 & 2033
- Table 20: Germany Expensive Canadian Housing Market Revenue (Million) Forecast, by Application 2020 & 2033
- Table 21: France Expensive Canadian Housing Market Revenue (Million) Forecast, by Application 2020 & 2033
- Table 22: Italy Expensive Canadian Housing Market Revenue (Million) Forecast, by Application 2020 & 2033
- Table 23: Spain Expensive Canadian Housing Market Revenue (Million) Forecast, by Application 2020 & 2033
- Table 24: Russia Expensive Canadian Housing Market Revenue (Million) Forecast, by Application 2020 & 2033
- Table 25: Benelux Expensive Canadian Housing Market Revenue (Million) Forecast, by Application 2020 & 2033
- Table 26: Nordics Expensive Canadian Housing Market Revenue (Million) Forecast, by Application 2020 & 2033
- Table 27: Rest of Europe Expensive Canadian Housing Market Revenue (Million) Forecast, by Application 2020 & 2033
- Table 28: Global Expensive Canadian Housing Market Revenue Million Forecast, by Type 2020 & 2033
- Table 29: Global Expensive Canadian Housing Market Revenue Million Forecast, by Cities 2020 & 2033
- Table 30: Global Expensive Canadian Housing Market Revenue Million Forecast, by Country 2020 & 2033
- Table 31: Turkey Expensive Canadian Housing Market Revenue (Million) Forecast, by Application 2020 & 2033
- Table 32: Israel Expensive Canadian Housing Market Revenue (Million) Forecast, by Application 2020 & 2033
- Table 33: GCC Expensive Canadian Housing Market Revenue (Million) Forecast, by Application 2020 & 2033
- Table 34: North Africa Expensive Canadian Housing Market Revenue (Million) Forecast, by Application 2020 & 2033
- Table 35: South Africa Expensive Canadian Housing Market Revenue (Million) Forecast, by Application 2020 & 2033
- Table 36: Rest of Middle East & Africa Expensive Canadian Housing Market Revenue (Million) Forecast, by Application 2020 & 2033
- Table 37: Global Expensive Canadian Housing Market Revenue Million Forecast, by Type 2020 & 2033
- Table 38: Global Expensive Canadian Housing Market Revenue Million Forecast, by Cities 2020 & 2033
- Table 39: Global Expensive Canadian Housing Market Revenue Million Forecast, by Country 2020 & 2033
- Table 40: China Expensive Canadian Housing Market Revenue (Million) Forecast, by Application 2020 & 2033
- Table 41: India Expensive Canadian Housing Market Revenue (Million) Forecast, by Application 2020 & 2033
- Table 42: Japan Expensive Canadian Housing Market Revenue (Million) Forecast, by Application 2020 & 2033
- Table 43: South Korea Expensive Canadian Housing Market Revenue (Million) Forecast, by Application 2020 & 2033
- Table 44: ASEAN Expensive Canadian Housing Market Revenue (Million) Forecast, by Application 2020 & 2033
- Table 45: Oceania Expensive Canadian Housing Market Revenue (Million) Forecast, by Application 2020 & 2033
- Table 46: Rest of Asia Pacific Expensive Canadian Housing Market Revenue (Million) Forecast, by Application 2020 & 2033
Frequently Asked Questions
1. What is the projected Compound Annual Growth Rate (CAGR) of the Expensive Canadian Housing Market?
The projected CAGR is approximately > 10.00%.
2. Which companies are prominent players in the Expensive Canadian Housing Market?
Key companies in the market include Onni Group, Concord Pacific**List Not Exhaustive, Minto Group, Mattamy Homes, Westbank Corp, The Daniels Corporation, Valencia Residential, Amacon, Brookfield Residential, Oxford Properties Group.
3. What are the main segments of the Expensive Canadian Housing Market?
The market segments include Type, Cities.
4. Can you provide details about the market size?
The market size is estimated to be USD XX Million as of 2022.
5. What are some drivers contributing to market growth?
Increasing Adoption of Remote and Hybrid Work Model.
6. What are the notable trends driving market growth?
Pandemic Accelerated Luxury Home Sales in Major Canadian Markets.
7. Are there any restraints impacting market growth?
Lack of Privacy.
8. Can you provide examples of recent developments in the market?
N/A
9. What pricing options are available for accessing the report?
Pricing options include single-user, multi-user, and enterprise licenses priced at USD 3800, USD 4500, and USD 5800 respectively.
10. Is the market size provided in terms of value or volume?
The market size is provided in terms of value, measured in Million.
11. Are there any specific market keywords associated with the report?
Yes, the market keyword associated with the report is "Expensive Canadian Housing Market," which aids in identifying and referencing the specific market segment covered.
12. How do I determine which pricing option suits my needs best?
The pricing options vary based on user requirements and access needs. Individual users may opt for single-user licenses, while businesses requiring broader access may choose multi-user or enterprise licenses for cost-effective access to the report.
13. Are there any additional resources or data provided in the Expensive Canadian Housing Market report?
While the report offers comprehensive insights, it's advisable to review the specific contents or supplementary materials provided to ascertain if additional resources or data are available.
14. How can I stay updated on further developments or reports in the Expensive Canadian Housing Market?
To stay informed about further developments, trends, and reports in the Expensive Canadian Housing Market, consider subscribing to industry newsletters, following relevant companies and organizations, or regularly checking reputable industry news sources and publications.
Methodology
Step 1 - Identification of Relevant Samples Size from Population Database


Step 2 - Approaches for Defining Global Market Size (Value, Volume* & Price*)

Note*: In applicable scenarios
Step 3 - Data Sources
Primary Research
- Web Analytics
- Survey Reports
- Research Institute
- Latest Research Reports
- Opinion Leaders
Secondary Research
- Annual Reports
- White Paper
- Latest Press Release
- Industry Association
- Paid Database
- Investor Presentations

Step 4 - Data Triangulation
Involves using different sources of information in order to increase the validity of a study
These sources are likely to be stakeholders in a program - participants, other researchers, program staff, other community members, and so on.
Then we put all data in single framework & apply various statistical tools to find out the dynamic on the market.
During the analysis stage, feedback from the stakeholder groups would be compared to determine areas of agreement as well as areas of divergence