
Key Insights
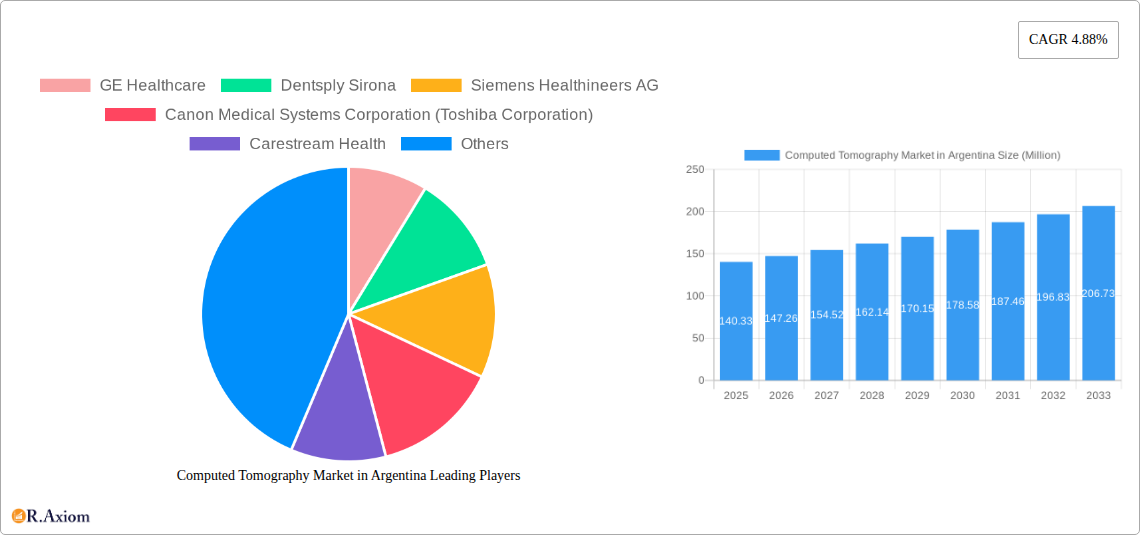
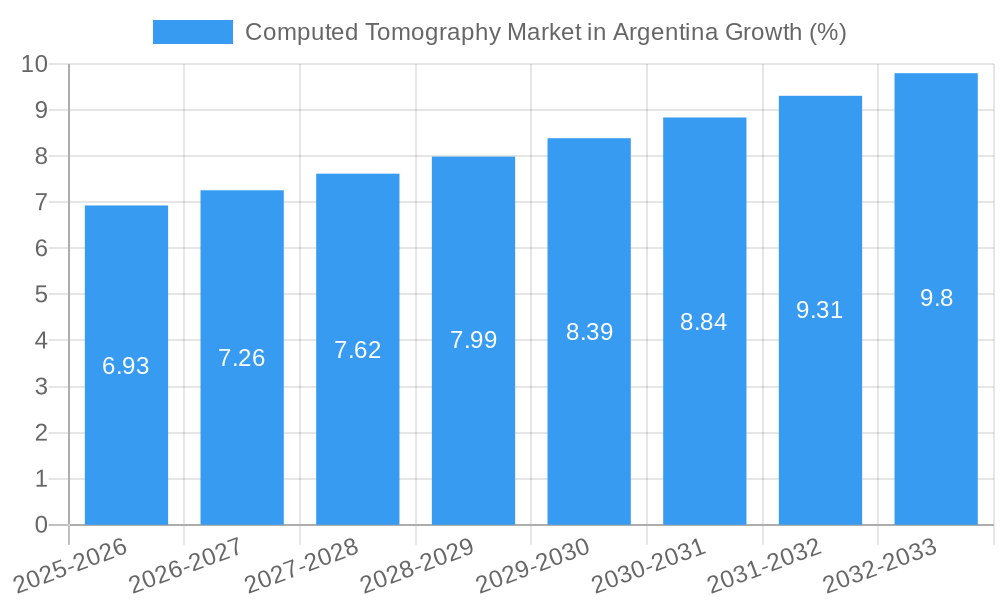
The Argentinian Computed Tomography (CT) market, valued at $140.33 million in 2025, is projected to experience steady growth, driven by a rising prevalence of chronic diseases necessitating advanced diagnostic imaging, increasing government investments in healthcare infrastructure, and a growing preference for minimally invasive procedures. The market's Compound Annual Growth Rate (CAGR) of 4.88% from 2025 to 2033 indicates a consistent expansion, although this rate might be influenced by economic fluctuations within the country. The segmentation reveals a diverse market, with hospitals and diagnostic centers as primary end-users. High-slice CT scanners are likely to command a significant share, given their superior image quality and faster scan times, catering particularly to the needs of oncology, cardiology, and neurology departments. While the market faces potential restraints such as high equipment costs and limited reimbursement policies, the overall growth trajectory appears positive, supported by a growing awareness of CT's diagnostic capabilities among healthcare professionals and patients. Key players like GE Healthcare, Siemens Healthineers AG, and Philips are expected to maintain a strong market presence through technological advancements and strategic partnerships. Future growth will likely be influenced by the adoption of AI-powered image analysis and the integration of CT with other imaging modalities for comprehensive diagnostics.
The forecast for the Argentinian CT market suggests that the demand for sophisticated diagnostic tools will continue to grow, driven by factors such as an aging population and increased incidence of cancer, cardiovascular diseases, and neurological disorders. Technological innovations, such as multi-slice CT scanners with improved resolution and faster scanning speeds, will continue to play a crucial role in shaping market growth. However, challenges relating to regulatory approvals, healthcare infrastructure development, and economic conditions in Argentina might influence the market's trajectory. Companies will need to adapt their strategies to address these challenges effectively to capitalize on the opportunities presented by the Argentinian CT market. Focusing on cost-effectiveness, service provision, and collaborative partnerships could prove essential in ensuring sustainable growth within the evolving healthcare landscape.
Computed Tomography Market in Argentina: A Comprehensive Market Report (2019-2033)
This comprehensive report provides a detailed analysis of the Computed Tomography (CT) market in Argentina, covering the period from 2019 to 2033. It offers valuable insights into market dynamics, growth drivers, challenges, and opportunities, equipping stakeholders with actionable intelligence for strategic decision-making. The report utilizes robust data and forecasts to paint a clear picture of the Argentinian CT market's evolution.
Computed Tomography Market in Argentina Market Concentration & Innovation
The Argentinian CT market exhibits a moderately concentrated landscape, with key players like GE Healthcare, Siemens Healthineers AG, and Philips holding significant market share. However, the presence of several smaller players and the potential for new entrants suggests a dynamic competitive environment. Market share data for 2024 indicates that GE Healthcare holds approximately 30%, Siemens Healthineers AG holds 25%, and Philips holds 20% of the market, while other players account for the remaining 25%. Innovation is driven by the demand for advanced imaging technologies, particularly in high-slice CT scanners offering improved image quality and faster scan times. Regulatory frameworks, while generally supportive of healthcare technology advancements, can impact market entry and pricing. Product substitutes, such as MRI, compete for the same patient pool, leading to a focus on demonstrating CT's unique advantages. End-user trends favor technologically advanced systems with enhanced software capabilities for improved diagnosis and workflow efficiency. M&A activity remains relatively low in recent years, with no significant deals exceeding $XX Million recorded since 2019. However, strategic partnerships between international vendors and local distributors are prevalent.
- Market Concentration: Moderately concentrated with major players holding significant shares but space for smaller players.
- Innovation Drivers: Demand for improved image quality, faster scan times, and advanced software capabilities.
- Regulatory Framework: Generally supportive but impacts market entry and pricing strategies.
- Product Substitutes: MRI presents a competitive alternative.
- End-User Trends: Preference for technologically advanced systems and efficient workflows.
- M&A Activity: Relatively low in recent years, with a focus on strategic partnerships.
Computed Tomography Market in Argentina Industry Trends & Insights
The Argentinian CT market is projected to experience steady growth during the forecast period (2025-2033), driven by factors such as rising prevalence of chronic diseases, increasing government investments in healthcare infrastructure, and growing awareness among the population about advanced diagnostic imaging. The market is expected to witness a CAGR of XX% during this period. Technological disruptions, such as the introduction of AI-powered image analysis tools and improved detector technologies, are significantly impacting market dynamics. Consumer preferences are shifting towards high-slice CT scanners that offer superior image quality, reducing the need for repeat scans and improving diagnostic accuracy. The competitive landscape is marked by both price competition and technological differentiation, with established players leveraging their brand recognition and technological capabilities. Market penetration of CT scanners in Argentina remains relatively low compared to developed nations, providing opportunities for future growth.
Dominant Markets & Segments in Computed Tomography Market in Argentina
The Hospitals segment dominates the end-user landscape, accounting for approximately 60% of the market share in 2024 due to the high volume of patients requiring CT scans. Among the types of CT scanners, High-Slice CTs hold the largest market share (approximately 45%) due to their superior image quality and diagnostic capabilities. The Oncology application segment leads in terms of market share (approximately 30%) reflecting the rising incidence of cancer in Argentina.
- Key Drivers for Hospitals Segment Dominance:
- High volume of patients requiring CT scans
- Government funding and investment in public hospitals
- Availability of advanced imaging technologies in major hospitals
- Key Drivers for High-Slice CT Dominance:
- Superior image quality and diagnostic capabilities
- Ability to perform complex procedures
- Growing demand from specialists in various medical fields
- Key Drivers for Oncology Application Dominance:
- High incidence of cancer
- Increased awareness about cancer screening
- Growing demand for accurate diagnosis and treatment planning
The geographical dominance within Argentina is centered around larger urban areas with well-established healthcare infrastructure, such as Buenos Aires and Córdoba. These regions benefit from higher healthcare expenditure and a greater concentration of hospitals and diagnostic centers.
Computed Tomography Market in Argentina Product Developments
Recent product developments in Argentina's CT market are characterized by a focus on enhancing image quality, speed, and functionality. High-slice CT scanners with advanced reconstruction algorithms and dose reduction technologies are gaining popularity. Manufacturers are also incorporating AI-powered image analysis tools for improved diagnostic accuracy and efficiency. These innovations cater to the increasing demand for faster and more precise diagnostic imaging. The key competitive advantage lies in delivering superior image quality, faster scan times, and user-friendly interfaces coupled with integrated software solutions for improved workflow.
Report Scope & Segmentation Analysis
This report segments the Argentinian CT market based on end-user (Hospitals, Diagnostic Centers, Other End Users), type (Low Slice, Medium Slice, High Slice), and application (Oncology, Neurology, Cardiovascular, Musculoskeletal, Other Applications). The Hospitals segment is projected to experience the highest CAGR during the forecast period, driven by increasing government spending and modernization of healthcare facilities. The High-Slice segment is anticipated to grow rapidly due to technological advancements and demand for enhanced image quality. Oncology application is expected to maintain its dominant position, reflecting the increasing incidence of cancer. Competitive dynamics within each segment vary, with established players facing competition from both local and international entrants. Market sizes for each segment are detailed within the full report.
Key Drivers of Computed Tomography Market in Argentina Growth
The Argentinian CT market's growth is fueled by a combination of factors:
- Technological Advancements: Introduction of high-slice CT scanners with advanced features and AI integration.
- Rising Prevalence of Chronic Diseases: Increased incidence of cancer, cardiovascular diseases, and neurological disorders boosts demand.
- Government Investments in Healthcare: Increased public spending on healthcare infrastructure and technological upgrades.
- Expanding Healthcare Insurance Coverage: Improved access to healthcare services further propels market growth.
Challenges in the Computed Tomography Market in Argentina Sector
Challenges facing the Argentinian CT market include:
- Economic Volatility: Fluctuations in the Argentinian economy impact healthcare spending and investment.
- Regulatory Hurdles: Navigating complex regulatory processes can delay market entry and adoption of new technologies.
- High Equipment Costs: The high cost of CT scanners limits accessibility, especially in smaller healthcare facilities.
- Limited Skilled Professionals: A shortage of trained radiologists and technicians can constrain market growth.
Emerging Opportunities in Computed Tomography Market in Argentina
Emerging opportunities include:
- Expansion of Private Healthcare: The growth of the private healthcare sector offers substantial market expansion potential.
- Telemedicine Integration: Integrating CT scans with telemedicine platforms can enhance accessibility and efficiency.
- AI-powered Diagnostics: The incorporation of AI in image analysis presents opportunities for improved accuracy and efficiency.
- Focus on Rural Healthcare: Addressing the lack of access to advanced imaging in rural areas presents a significant opportunity.
Leading Players in the Computed Tomography Market in Argentina Market
- GE Healthcare
- Dentsply Sirona
- Siemens Healthineers AG
- Canon Medical Systems Corporation (Toshiba Corporation)
- Carestream Health
- Koninklijke Philips NV
- Planmeca Group (Planmed OY)
Key Developments in Computed Tomography Market in Argentina Industry
- January 2021: Konica Minolta Healthcare Americas Inc. and AGIMED deployed imaging management solutions in Córdoba.
- November 2020: Agfa Radiology Solutions Argentina installed a DR 600 CT system at Imágenes Jaraba Medical Center.
Strategic Outlook for Computed Tomography Market in Argentina Market
The Argentinian CT market presents significant long-term growth potential, driven by ongoing technological advancements, increasing healthcare expenditure, and a growing need for advanced diagnostic imaging. Strategic focus should be on providing high-quality, cost-effective solutions tailored to the specific needs of the Argentinian healthcare system. Partnerships with local distributors and investments in training and education will be crucial for market expansion. The focus on advanced features such as AI-powered image analysis and dose reduction technologies will be key differentiators in this growing market.
Computed Tomography Market in Argentina Segmentation
-
1. Type
- 1.1. Low Slice
- 1.2. Medium Slice
- 1.3. High Slice
-
2. Application
- 2.1. Oncology
- 2.2. Neurology
- 2.3. Cardiovascular
- 2.4. Musculoskeletal
- 2.5. Other Applications
-
3. End User
- 3.1. Hospitals
- 3.2. Diagnostic Centers
- 3.3. Other End Users
Computed Tomography Market in Argentina Segmentation By Geography
-
1. North America
- 1.1. United States
- 1.2. Canada
- 1.3. Mexico
-
2. South America
- 2.1. Brazil
- 2.2. Argentina
- 2.3. Rest of South America
-
3. Europe
- 3.1. United Kingdom
- 3.2. Germany
- 3.3. France
- 3.4. Italy
- 3.5. Spain
- 3.6. Russia
- 3.7. Benelux
- 3.8. Nordics
- 3.9. Rest of Europe
-
4. Middle East & Africa
- 4.1. Turkey
- 4.2. Israel
- 4.3. GCC
- 4.4. North Africa
- 4.5. South Africa
- 4.6. Rest of Middle East & Africa
-
5. Asia Pacific
- 5.1. China
- 5.2. India
- 5.3. Japan
- 5.4. South Korea
- 5.5. ASEAN
- 5.6. Oceania
- 5.7. Rest of Asia Pacific
Computed Tomography Market in Argentina REPORT HIGHLIGHTS
| Aspects | Details |
|---|---|
| Study Period | 2019-2033 |
| Base Year | 2024 |
| Estimated Year | 2025 |
| Forecast Period | 2025-2033 |
| Historical Period | 2019-2024 |
| Growth Rate | CAGR of 4.88% from 2019-2033 |
| Segmentation |
|
Table of Contents
- 1. Introduction
- 1.1. Research Scope
- 1.2. Market Segmentation
- 1.3. Research Methodology
- 1.4. Definitions and Assumptions
- 2. Executive Summary
- 2.1. Introduction
- 3. Market Dynamics
- 3.1. Introduction
- 3.2. Market Drivers
- 3.2.1. Increasing Prevalence of Chronic Diseases; Rising Geriatric Population; Increasing Technological Advancements
- 3.3. Market Restrains
- 3.3.1. Lack Of Proper Reimbursement And Stringent Regulatory Approval Procedures; High Cost of Equipment
- 3.4. Market Trends
- 3.4.1. Medium Slice Segment is Expected to Hold a Significant Market Share Over the Forecast Period
- 4. Market Factor Analysis
- 4.1. Porters Five Forces
- 4.2. Supply/Value Chain
- 4.3. PESTEL analysis
- 4.4. Market Entropy
- 4.5. Patent/Trademark Analysis
- 5. Global Computed Tomography Market in Argentina Analysis, Insights and Forecast, 2019-2031
- 5.1. Market Analysis, Insights and Forecast - by Type
- 5.1.1. Low Slice
- 5.1.2. Medium Slice
- 5.1.3. High Slice
- 5.2. Market Analysis, Insights and Forecast - by Application
- 5.2.1. Oncology
- 5.2.2. Neurology
- 5.2.3. Cardiovascular
- 5.2.4. Musculoskeletal
- 5.2.5. Other Applications
- 5.3. Market Analysis, Insights and Forecast - by End User
- 5.3.1. Hospitals
- 5.3.2. Diagnostic Centers
- 5.3.3. Other End Users
- 5.4. Market Analysis, Insights and Forecast - by Region
- 5.4.1. North America
- 5.4.2. South America
- 5.4.3. Europe
- 5.4.4. Middle East & Africa
- 5.4.5. Asia Pacific
- 5.1. Market Analysis, Insights and Forecast - by Type
- 6. North America Computed Tomography Market in Argentina Analysis, Insights and Forecast, 2019-2031
- 6.1. Market Analysis, Insights and Forecast - by Type
- 6.1.1. Low Slice
- 6.1.2. Medium Slice
- 6.1.3. High Slice
- 6.2. Market Analysis, Insights and Forecast - by Application
- 6.2.1. Oncology
- 6.2.2. Neurology
- 6.2.3. Cardiovascular
- 6.2.4. Musculoskeletal
- 6.2.5. Other Applications
- 6.3. Market Analysis, Insights and Forecast - by End User
- 6.3.1. Hospitals
- 6.3.2. Diagnostic Centers
- 6.3.3. Other End Users
- 6.1. Market Analysis, Insights and Forecast - by Type
- 7. South America Computed Tomography Market in Argentina Analysis, Insights and Forecast, 2019-2031
- 7.1. Market Analysis, Insights and Forecast - by Type
- 7.1.1. Low Slice
- 7.1.2. Medium Slice
- 7.1.3. High Slice
- 7.2. Market Analysis, Insights and Forecast - by Application
- 7.2.1. Oncology
- 7.2.2. Neurology
- 7.2.3. Cardiovascular
- 7.2.4. Musculoskeletal
- 7.2.5. Other Applications
- 7.3. Market Analysis, Insights and Forecast - by End User
- 7.3.1. Hospitals
- 7.3.2. Diagnostic Centers
- 7.3.3. Other End Users
- 7.1. Market Analysis, Insights and Forecast - by Type
- 8. Europe Computed Tomography Market in Argentina Analysis, Insights and Forecast, 2019-2031
- 8.1. Market Analysis, Insights and Forecast - by Type
- 8.1.1. Low Slice
- 8.1.2. Medium Slice
- 8.1.3. High Slice
- 8.2. Market Analysis, Insights and Forecast - by Application
- 8.2.1. Oncology
- 8.2.2. Neurology
- 8.2.3. Cardiovascular
- 8.2.4. Musculoskeletal
- 8.2.5. Other Applications
- 8.3. Market Analysis, Insights and Forecast - by End User
- 8.3.1. Hospitals
- 8.3.2. Diagnostic Centers
- 8.3.3. Other End Users
- 8.1. Market Analysis, Insights and Forecast - by Type
- 9. Middle East & Africa Computed Tomography Market in Argentina Analysis, Insights and Forecast, 2019-2031
- 9.1. Market Analysis, Insights and Forecast - by Type
- 9.1.1. Low Slice
- 9.1.2. Medium Slice
- 9.1.3. High Slice
- 9.2. Market Analysis, Insights and Forecast - by Application
- 9.2.1. Oncology
- 9.2.2. Neurology
- 9.2.3. Cardiovascular
- 9.2.4. Musculoskeletal
- 9.2.5. Other Applications
- 9.3. Market Analysis, Insights and Forecast - by End User
- 9.3.1. Hospitals
- 9.3.2. Diagnostic Centers
- 9.3.3. Other End Users
- 9.1. Market Analysis, Insights and Forecast - by Type
- 10. Asia Pacific Computed Tomography Market in Argentina Analysis, Insights and Forecast, 2019-2031
- 10.1. Market Analysis, Insights and Forecast - by Type
- 10.1.1. Low Slice
- 10.1.2. Medium Slice
- 10.1.3. High Slice
- 10.2. Market Analysis, Insights and Forecast - by Application
- 10.2.1. Oncology
- 10.2.2. Neurology
- 10.2.3. Cardiovascular
- 10.2.4. Musculoskeletal
- 10.2.5. Other Applications
- 10.3. Market Analysis, Insights and Forecast - by End User
- 10.3.1. Hospitals
- 10.3.2. Diagnostic Centers
- 10.3.3. Other End Users
- 10.1. Market Analysis, Insights and Forecast - by Type
- 11. Competitive Analysis
- 11.1. Global Market Share Analysis 2024
- 11.2. Company Profiles
- 11.2.1 GE Healthcare
- 11.2.1.1. Overview
- 11.2.1.2. Products
- 11.2.1.3. SWOT Analysis
- 11.2.1.4. Recent Developments
- 11.2.1.5. Financials (Based on Availability)
- 11.2.2 Dentsply Sirona
- 11.2.2.1. Overview
- 11.2.2.2. Products
- 11.2.2.3. SWOT Analysis
- 11.2.2.4. Recent Developments
- 11.2.2.5. Financials (Based on Availability)
- 11.2.3 Siemens Healthineers AG
- 11.2.3.1. Overview
- 11.2.3.2. Products
- 11.2.3.3. SWOT Analysis
- 11.2.3.4. Recent Developments
- 11.2.3.5. Financials (Based on Availability)
- 11.2.4 Canon Medical Systems Corporation (Toshiba Corporation)
- 11.2.4.1. Overview
- 11.2.4.2. Products
- 11.2.4.3. SWOT Analysis
- 11.2.4.4. Recent Developments
- 11.2.4.5. Financials (Based on Availability)
- 11.2.5 Carestream Health
- 11.2.5.1. Overview
- 11.2.5.2. Products
- 11.2.5.3. SWOT Analysis
- 11.2.5.4. Recent Developments
- 11.2.5.5. Financials (Based on Availability)
- 11.2.6 Koninklijke Philips NV
- 11.2.6.1. Overview
- 11.2.6.2. Products
- 11.2.6.3. SWOT Analysis
- 11.2.6.4. Recent Developments
- 11.2.6.5. Financials (Based on Availability)
- 11.2.7 Planmeca Group (Planmed OY)
- 11.2.7.1. Overview
- 11.2.7.2. Products
- 11.2.7.3. SWOT Analysis
- 11.2.7.4. Recent Developments
- 11.2.7.5. Financials (Based on Availability)
- 11.2.1 GE Healthcare
List of Figures
- Figure 1: Global Computed Tomography Market in Argentina Revenue Breakdown (Million, %) by Region 2024 & 2032
- Figure 2: Argentina Computed Tomography Market in Argentina Revenue (Million), by Country 2024 & 2032
- Figure 3: Argentina Computed Tomography Market in Argentina Revenue Share (%), by Country 2024 & 2032
- Figure 4: North America Computed Tomography Market in Argentina Revenue (Million), by Type 2024 & 2032
- Figure 5: North America Computed Tomography Market in Argentina Revenue Share (%), by Type 2024 & 2032
- Figure 6: North America Computed Tomography Market in Argentina Revenue (Million), by Application 2024 & 2032
- Figure 7: North America Computed Tomography Market in Argentina Revenue Share (%), by Application 2024 & 2032
- Figure 8: North America Computed Tomography Market in Argentina Revenue (Million), by End User 2024 & 2032
- Figure 9: North America Computed Tomography Market in Argentina Revenue Share (%), by End User 2024 & 2032
- Figure 10: North America Computed Tomography Market in Argentina Revenue (Million), by Country 2024 & 2032
- Figure 11: North America Computed Tomography Market in Argentina Revenue Share (%), by Country 2024 & 2032
- Figure 12: South America Computed Tomography Market in Argentina Revenue (Million), by Type 2024 & 2032
- Figure 13: South America Computed Tomography Market in Argentina Revenue Share (%), by Type 2024 & 2032
- Figure 14: South America Computed Tomography Market in Argentina Revenue (Million), by Application 2024 & 2032
- Figure 15: South America Computed Tomography Market in Argentina Revenue Share (%), by Application 2024 & 2032
- Figure 16: South America Computed Tomography Market in Argentina Revenue (Million), by End User 2024 & 2032
- Figure 17: South America Computed Tomography Market in Argentina Revenue Share (%), by End User 2024 & 2032
- Figure 18: South America Computed Tomography Market in Argentina Revenue (Million), by Country 2024 & 2032
- Figure 19: South America Computed Tomography Market in Argentina Revenue Share (%), by Country 2024 & 2032
- Figure 20: Europe Computed Tomography Market in Argentina Revenue (Million), by Type 2024 & 2032
- Figure 21: Europe Computed Tomography Market in Argentina Revenue Share (%), by Type 2024 & 2032
- Figure 22: Europe Computed Tomography Market in Argentina Revenue (Million), by Application 2024 & 2032
- Figure 23: Europe Computed Tomography Market in Argentina Revenue Share (%), by Application 2024 & 2032
- Figure 24: Europe Computed Tomography Market in Argentina Revenue (Million), by End User 2024 & 2032
- Figure 25: Europe Computed Tomography Market in Argentina Revenue Share (%), by End User 2024 & 2032
- Figure 26: Europe Computed Tomography Market in Argentina Revenue (Million), by Country 2024 & 2032
- Figure 27: Europe Computed Tomography Market in Argentina Revenue Share (%), by Country 2024 & 2032
- Figure 28: Middle East & Africa Computed Tomography Market in Argentina Revenue (Million), by Type 2024 & 2032
- Figure 29: Middle East & Africa Computed Tomography Market in Argentina Revenue Share (%), by Type 2024 & 2032
- Figure 30: Middle East & Africa Computed Tomography Market in Argentina Revenue (Million), by Application 2024 & 2032
- Figure 31: Middle East & Africa Computed Tomography Market in Argentina Revenue Share (%), by Application 2024 & 2032
- Figure 32: Middle East & Africa Computed Tomography Market in Argentina Revenue (Million), by End User 2024 & 2032
- Figure 33: Middle East & Africa Computed Tomography Market in Argentina Revenue Share (%), by End User 2024 & 2032
- Figure 34: Middle East & Africa Computed Tomography Market in Argentina Revenue (Million), by Country 2024 & 2032
- Figure 35: Middle East & Africa Computed Tomography Market in Argentina Revenue Share (%), by Country 2024 & 2032
- Figure 36: Asia Pacific Computed Tomography Market in Argentina Revenue (Million), by Type 2024 & 2032
- Figure 37: Asia Pacific Computed Tomography Market in Argentina Revenue Share (%), by Type 2024 & 2032
- Figure 38: Asia Pacific Computed Tomography Market in Argentina Revenue (Million), by Application 2024 & 2032
- Figure 39: Asia Pacific Computed Tomography Market in Argentina Revenue Share (%), by Application 2024 & 2032
- Figure 40: Asia Pacific Computed Tomography Market in Argentina Revenue (Million), by End User 2024 & 2032
- Figure 41: Asia Pacific Computed Tomography Market in Argentina Revenue Share (%), by End User 2024 & 2032
- Figure 42: Asia Pacific Computed Tomography Market in Argentina Revenue (Million), by Country 2024 & 2032
- Figure 43: Asia Pacific Computed Tomography Market in Argentina Revenue Share (%), by Country 2024 & 2032
List of Tables
- Table 1: Global Computed Tomography Market in Argentina Revenue Million Forecast, by Region 2019 & 2032
- Table 2: Global Computed Tomography Market in Argentina Revenue Million Forecast, by Type 2019 & 2032
- Table 3: Global Computed Tomography Market in Argentina Revenue Million Forecast, by Application 2019 & 2032
- Table 4: Global Computed Tomography Market in Argentina Revenue Million Forecast, by End User 2019 & 2032
- Table 5: Global Computed Tomography Market in Argentina Revenue Million Forecast, by Region 2019 & 2032
- Table 6: Global Computed Tomography Market in Argentina Revenue Million Forecast, by Country 2019 & 2032
- Table 7: Global Computed Tomography Market in Argentina Revenue Million Forecast, by Type 2019 & 2032
- Table 8: Global Computed Tomography Market in Argentina Revenue Million Forecast, by Application 2019 & 2032
- Table 9: Global Computed Tomography Market in Argentina Revenue Million Forecast, by End User 2019 & 2032
- Table 10: Global Computed Tomography Market in Argentina Revenue Million Forecast, by Country 2019 & 2032
- Table 11: United States Computed Tomography Market in Argentina Revenue (Million) Forecast, by Application 2019 & 2032
- Table 12: Canada Computed Tomography Market in Argentina Revenue (Million) Forecast, by Application 2019 & 2032
- Table 13: Mexico Computed Tomography Market in Argentina Revenue (Million) Forecast, by Application 2019 & 2032
- Table 14: Global Computed Tomography Market in Argentina Revenue Million Forecast, by Type 2019 & 2032
- Table 15: Global Computed Tomography Market in Argentina Revenue Million Forecast, by Application 2019 & 2032
- Table 16: Global Computed Tomography Market in Argentina Revenue Million Forecast, by End User 2019 & 2032
- Table 17: Global Computed Tomography Market in Argentina Revenue Million Forecast, by Country 2019 & 2032
- Table 18: Brazil Computed Tomography Market in Argentina Revenue (Million) Forecast, by Application 2019 & 2032
- Table 19: Argentina Computed Tomography Market in Argentina Revenue (Million) Forecast, by Application 2019 & 2032
- Table 20: Rest of South America Computed Tomography Market in Argentina Revenue (Million) Forecast, by Application 2019 & 2032
- Table 21: Global Computed Tomography Market in Argentina Revenue Million Forecast, by Type 2019 & 2032
- Table 22: Global Computed Tomography Market in Argentina Revenue Million Forecast, by Application 2019 & 2032
- Table 23: Global Computed Tomography Market in Argentina Revenue Million Forecast, by End User 2019 & 2032
- Table 24: Global Computed Tomography Market in Argentina Revenue Million Forecast, by Country 2019 & 2032
- Table 25: United Kingdom Computed Tomography Market in Argentina Revenue (Million) Forecast, by Application 2019 & 2032
- Table 26: Germany Computed Tomography Market in Argentina Revenue (Million) Forecast, by Application 2019 & 2032
- Table 27: France Computed Tomography Market in Argentina Revenue (Million) Forecast, by Application 2019 & 2032
- Table 28: Italy Computed Tomography Market in Argentina Revenue (Million) Forecast, by Application 2019 & 2032
- Table 29: Spain Computed Tomography Market in Argentina Revenue (Million) Forecast, by Application 2019 & 2032
- Table 30: Russia Computed Tomography Market in Argentina Revenue (Million) Forecast, by Application 2019 & 2032
- Table 31: Benelux Computed Tomography Market in Argentina Revenue (Million) Forecast, by Application 2019 & 2032
- Table 32: Nordics Computed Tomography Market in Argentina Revenue (Million) Forecast, by Application 2019 & 2032
- Table 33: Rest of Europe Computed Tomography Market in Argentina Revenue (Million) Forecast, by Application 2019 & 2032
- Table 34: Global Computed Tomography Market in Argentina Revenue Million Forecast, by Type 2019 & 2032
- Table 35: Global Computed Tomography Market in Argentina Revenue Million Forecast, by Application 2019 & 2032
- Table 36: Global Computed Tomography Market in Argentina Revenue Million Forecast, by End User 2019 & 2032
- Table 37: Global Computed Tomography Market in Argentina Revenue Million Forecast, by Country 2019 & 2032
- Table 38: Turkey Computed Tomography Market in Argentina Revenue (Million) Forecast, by Application 2019 & 2032
- Table 39: Israel Computed Tomography Market in Argentina Revenue (Million) Forecast, by Application 2019 & 2032
- Table 40: GCC Computed Tomography Market in Argentina Revenue (Million) Forecast, by Application 2019 & 2032
- Table 41: North Africa Computed Tomography Market in Argentina Revenue (Million) Forecast, by Application 2019 & 2032
- Table 42: South Africa Computed Tomography Market in Argentina Revenue (Million) Forecast, by Application 2019 & 2032
- Table 43: Rest of Middle East & Africa Computed Tomography Market in Argentina Revenue (Million) Forecast, by Application 2019 & 2032
- Table 44: Global Computed Tomography Market in Argentina Revenue Million Forecast, by Type 2019 & 2032
- Table 45: Global Computed Tomography Market in Argentina Revenue Million Forecast, by Application 2019 & 2032
- Table 46: Global Computed Tomography Market in Argentina Revenue Million Forecast, by End User 2019 & 2032
- Table 47: Global Computed Tomography Market in Argentina Revenue Million Forecast, by Country 2019 & 2032
- Table 48: China Computed Tomography Market in Argentina Revenue (Million) Forecast, by Application 2019 & 2032
- Table 49: India Computed Tomography Market in Argentina Revenue (Million) Forecast, by Application 2019 & 2032
- Table 50: Japan Computed Tomography Market in Argentina Revenue (Million) Forecast, by Application 2019 & 2032
- Table 51: South Korea Computed Tomography Market in Argentina Revenue (Million) Forecast, by Application 2019 & 2032
- Table 52: ASEAN Computed Tomography Market in Argentina Revenue (Million) Forecast, by Application 2019 & 2032
- Table 53: Oceania Computed Tomography Market in Argentina Revenue (Million) Forecast, by Application 2019 & 2032
- Table 54: Rest of Asia Pacific Computed Tomography Market in Argentina Revenue (Million) Forecast, by Application 2019 & 2032
Frequently Asked Questions
1. What is the projected Compound Annual Growth Rate (CAGR) of the Computed Tomography Market in Argentina?
The projected CAGR is approximately 4.88%.
2. Which companies are prominent players in the Computed Tomography Market in Argentina?
Key companies in the market include GE Healthcare, Dentsply Sirona, Siemens Healthineers AG, Canon Medical Systems Corporation (Toshiba Corporation), Carestream Health, Koninklijke Philips NV, Planmeca Group (Planmed OY).
3. What are the main segments of the Computed Tomography Market in Argentina?
The market segments include Type, Application, End User.
4. Can you provide details about the market size?
The market size is estimated to be USD 140.33 Million as of 2022.
5. What are some drivers contributing to market growth?
Increasing Prevalence of Chronic Diseases; Rising Geriatric Population; Increasing Technological Advancements.
6. What are the notable trends driving market growth?
Medium Slice Segment is Expected to Hold a Significant Market Share Over the Forecast Period.
7. Are there any restraints impacting market growth?
Lack Of Proper Reimbursement And Stringent Regulatory Approval Procedures; High Cost of Equipment.
8. Can you provide examples of recent developments in the market?
In January 2021, in Córdoba, Argentina's primary public health hospital system, Konica Minolta Healthcare Americas Inc. and its strategic partner AGIMED, a healthcare provider, deployed Konica Minolta imaging management solutions.
9. What pricing options are available for accessing the report?
Pricing options include single-user, multi-user, and enterprise licenses priced at USD 3800, USD 4500, and USD 5800 respectively.
10. Is the market size provided in terms of value or volume?
The market size is provided in terms of value, measured in Million.
11. Are there any specific market keywords associated with the report?
Yes, the market keyword associated with the report is "Computed Tomography Market in Argentina," which aids in identifying and referencing the specific market segment covered.
12. How do I determine which pricing option suits my needs best?
The pricing options vary based on user requirements and access needs. Individual users may opt for single-user licenses, while businesses requiring broader access may choose multi-user or enterprise licenses for cost-effective access to the report.
13. Are there any additional resources or data provided in the Computed Tomography Market in Argentina report?
While the report offers comprehensive insights, it's advisable to review the specific contents or supplementary materials provided to ascertain if additional resources or data are available.
14. How can I stay updated on further developments or reports in the Computed Tomography Market in Argentina?
To stay informed about further developments, trends, and reports in the Computed Tomography Market in Argentina, consider subscribing to industry newsletters, following relevant companies and organizations, or regularly checking reputable industry news sources and publications.
Methodology
Step 1 - Identification of Relevant Samples Size from Population Database


Step 2 - Approaches for Defining Global Market Size (Value, Volume* & Price*)

Note*: In applicable scenarios
Step 3 - Data Sources
Primary Research
- Web Analytics
- Survey Reports
- Research Institute
- Latest Research Reports
- Opinion Leaders
Secondary Research
- Annual Reports
- White Paper
- Latest Press Release
- Industry Association
- Paid Database
- Investor Presentations

Step 4 - Data Triangulation
Involves using different sources of information in order to increase the validity of a study
These sources are likely to be stakeholders in a program - participants, other researchers, program staff, other community members, and so on.
Then we put all data in single framework & apply various statistical tools to find out the dynamic on the market.
During the analysis stage, feedback from the stakeholder groups would be compared to determine areas of agreement as well as areas of divergence


