
Key Insights
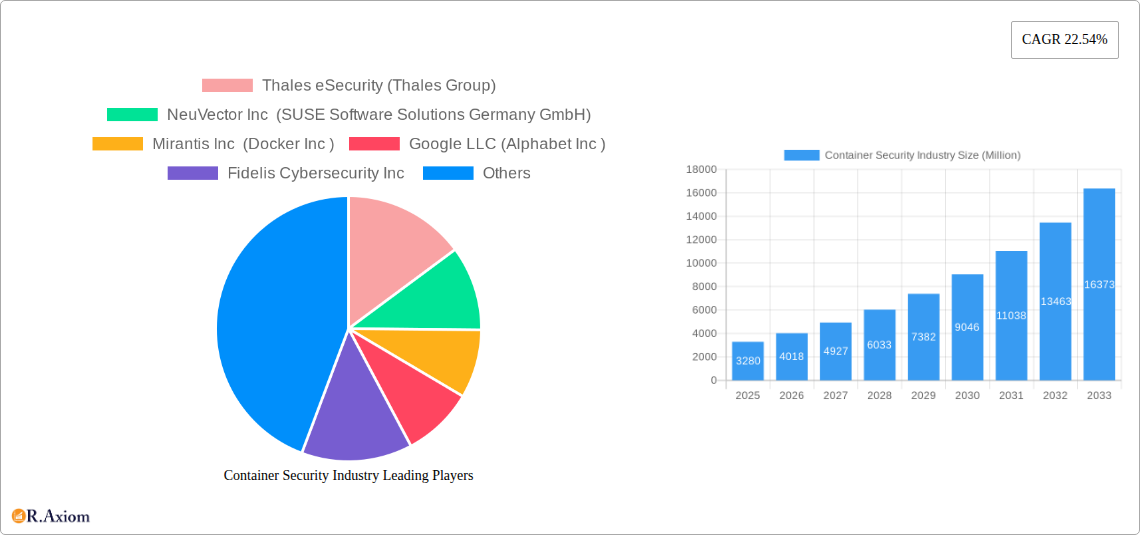
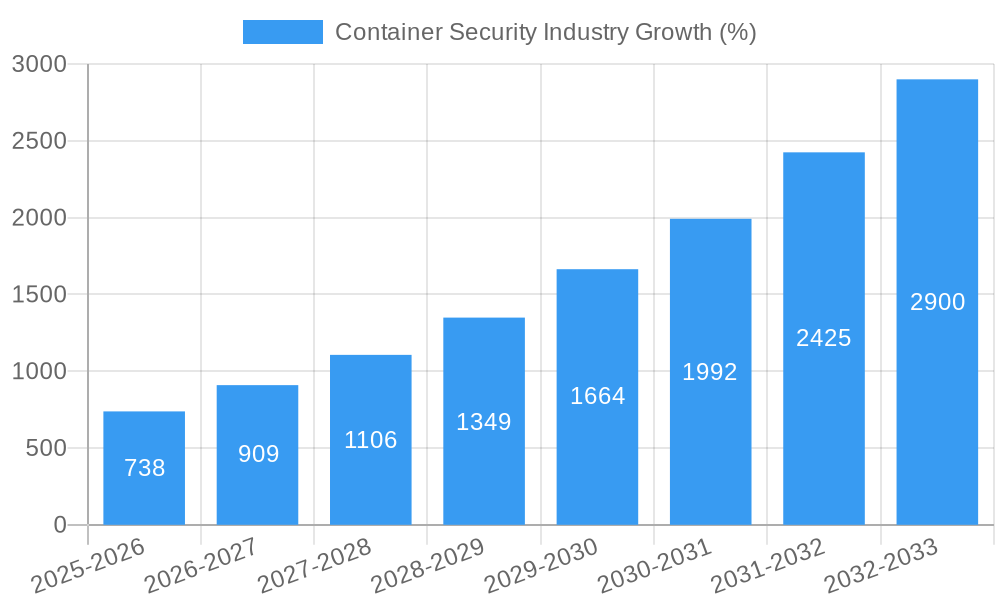
The container security market, valued at $3.28 billion in 2025, is experiencing rapid growth, projected to expand at a compound annual growth rate (CAGR) of 22.54% from 2025 to 2033. This robust expansion is driven by the increasing adoption of containerization technologies in enterprise applications and the rising need to secure these dynamic environments from evolving cyber threats. The surge in cloud-native applications and microservices architectures significantly contributes to market growth, as businesses seek solutions to protect their containerized workloads across various deployment models, including cloud-based and on-premise infrastructure. Key growth segments include large enterprises, prioritizing robust security measures for mission-critical applications, and the IT & ITES, BFSI, and Retail sectors, heavily reliant on containerized systems. Competitive forces are shaping the landscape, with established players like Thales eSecurity, Red Hat, and Trend Micro, alongside emerging innovative companies like NeuVector and Aqua Security, vying for market share. Geographical distribution shows strong growth across North America and Europe, driven by early adoption and stringent data security regulations. However, the Asia-Pacific region is poised for significant expansion due to increasing digital transformation initiatives and growing cloud adoption.
The market's growth, however, faces challenges. The complexity of container security solutions and the need for skilled personnel to manage and maintain them pose hurdles for some organizations. Furthermore, the rapid evolution of threats requires constant updates and adaptation of security measures, placing pressure on both vendors and users. Despite these restraints, the overall outlook remains positive, fueled by the continued dominance of containerization as a preferred deployment model, the increasing sophistication of cyberattacks targeting container environments, and the continuous innovation in container security technologies designed to mitigate these risks. The market is expected to witness consolidation as larger companies acquire smaller players to expand their product portfolios and enhance their market presence. The focus will likely shift towards integrated solutions providing comprehensive security across the entire container lifecycle, from development to deployment and operation.
Container Security Industry: A Comprehensive Market Report (2019-2033)
This detailed report provides a comprehensive analysis of the Container Security industry, encompassing market size, growth projections, competitive landscape, and emerging trends from 2019 to 2033. The study covers key market segments, including by organization size (Large Enterprises, Small & Medium Enterprises), deployment (Cloud-based, On-premise), and end-user industry (IT & ITES, BFSI, Retail, Healthcare, Industrial, Other End-user Industries). The report leverages extensive data analysis to offer actionable insights for industry stakeholders, investors, and businesses seeking to navigate this rapidly evolving market. The market is projected to reach $XX Million by 2033, exhibiting a CAGR of XX% during the forecast period (2025-2033). The base year for this report is 2025, with the historical period covering 2019-2024.
Container Security Industry Market Concentration & Innovation
The Container Security market is characterized by a moderate level of concentration, with several major players holding significant market share, but also exhibiting a substantial number of smaller, niche players. Key players such as Thales eSecurity (Thales Group), NeuVector Inc (SUSE Software Solutions Germany GmbH), Mirantis Inc (Docker Inc), Google LLC (Alphabet Inc), Fidelis Cybersecurity Inc, Red Hat Inc, Trend Micro Incorporated, Rapid7 Inc, Qualys Inc, Aqua Security Software Ltd, and Palo Alto Networks Inc are driving innovation through continuous product development and strategic acquisitions. The combined market share of these leading players is estimated at approximately 60% in 2025.
- Market Share: The top 5 players account for approximately 40% of the total market share in 2025, with the remaining share distributed among several smaller players.
- M&A Activity: The industry has witnessed significant M&A activity in recent years, with deal values exceeding $XX Million annually. These activities aim to expand product portfolios, enhance technological capabilities, and increase market reach. The average deal value in 2024 was approximately $XX Million.
- Innovation Drivers: The increasing adoption of cloud-native technologies, the growing need for robust security measures to protect containerized applications, and stringent regulatory compliance requirements are key innovation drivers.
- Regulatory Frameworks: Compliance with regulations like GDPR, CCPA, and industry-specific security standards are significant factors impacting product development and market adoption.
- Product Substitutes: Traditional security solutions are being replaced by container-specific security tools that offer better integration and protection.
- End-User Trends: A growing preference for cloud-based deployments and a heightened focus on DevSecOps practices are influencing market trends.
Container Security Industry Industry Trends & Insights
The Container Security market is experiencing robust growth, fueled by the widespread adoption of containerization technologies across various industries. The increasing digitization of businesses and the shift towards cloud-native applications are key market drivers. The market is projected to grow at a CAGR of XX% during the forecast period, reaching $XX Million by 2033. Market penetration is increasing rapidly, especially within large enterprises and cloud-based deployments. This growth is further driven by the need for comprehensive security solutions that address vulnerabilities across the entire container lifecycle, from image building to runtime protection. Technological disruptions, such as the emergence of serverless computing and AI-powered security tools, are transforming the industry landscape, fostering innovation and creating new opportunities. Consumer preferences are shifting towards integrated and automated security solutions that seamlessly integrate with existing DevOps workflows. Competitive dynamics are characterized by intense innovation, strategic partnerships, and M&A activities, all aiming to strengthen market positioning and offer superior solutions. The increasing sophistication of cyberattacks and the rising awareness of security risks are further contributing to the market's growth.
Dominant Markets & Segments in Container Security Industry
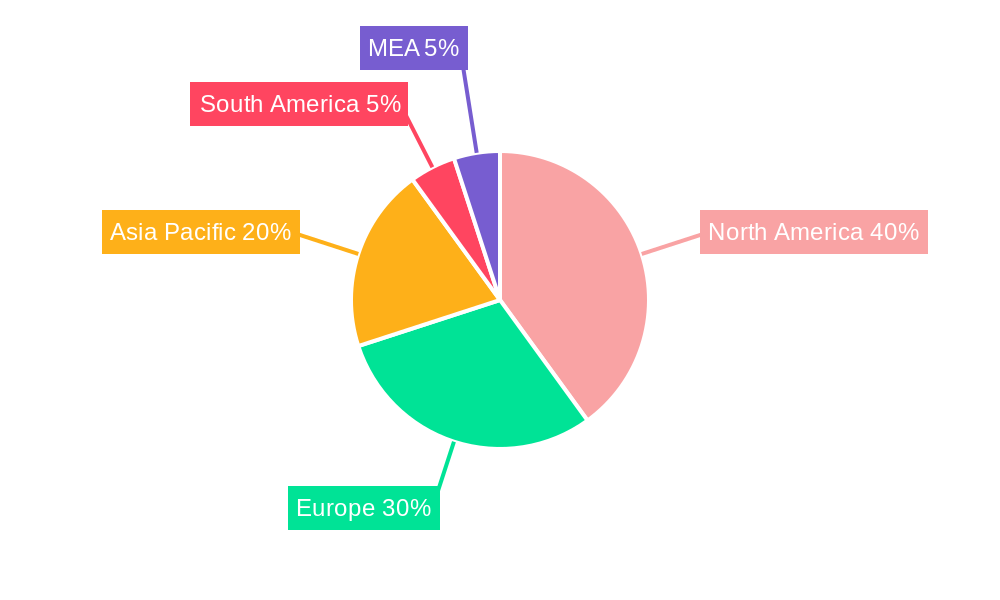
The North American region currently dominates the Container Security market, driven by high cloud adoption rates, robust technological infrastructure, and a strong regulatory environment. Within this region, the United States holds the largest market share. However, the Asia-Pacific region is showing strong growth potential due to increasing digitalization and investments in cloud infrastructure.
By Organisation Size:
- Large Enterprises: This segment dominates the market due to higher IT budgets and greater reliance on containerized applications. Key drivers include increased security needs and higher regulatory compliance requirements.
- Small & Medium Enterprises (SMEs): This segment is witnessing rapid growth due to the increasing accessibility and affordability of container security solutions. However, limited resources and expertise often present challenges to wider adoption.
By Deployment:
- Cloud-based: This segment is experiencing the most rapid growth, driven by the increasing adoption of cloud-native architectures and the inherent scalability and flexibility of cloud-based security solutions.
- On-premise: This segment continues to hold a significant share but is growing at a slower pace compared to the cloud-based segment.
By End-user Industry:
- IT & ITES: This segment holds the largest market share due to its high reliance on containerized applications and a strong understanding of security needs.
- BFSI (Banking, Financial Services, and Insurance): This segment is witnessing significant growth due to stringent regulatory requirements and the increasing adoption of digital banking solutions.
- Retail: The rising popularity of e-commerce and the need to protect sensitive customer data are driving growth in this segment.
- Healthcare: The increasing adoption of telehealth and electronic health records is fueling the demand for robust container security solutions in this sector.
- Industrial: Industrial IoT (IIoT) applications are increasing the demand for security solutions tailored to industrial environments.
Container Security Industry Product Developments
Recent product innovations focus on integrating AI and machine learning for improved threat detection and response. Container security solutions now offer comprehensive capabilities, including image scanning, runtime protection, vulnerability management, and secrets management. This integrated approach allows organizations to efficiently secure their containerized environments throughout the entire application lifecycle. The key competitive advantage lies in the ability to provide comprehensive security with minimal disruption to the DevOps workflow, offering automation, real-time visibility, and reduced operational overhead. The trend towards cloud-native security solutions with seamless integration with container orchestration platforms like Kubernetes is further enhancing market competitiveness.
Report Scope & Segmentation Analysis
This report offers a detailed segmentation of the Container Security market across three key parameters: organization size (Large Enterprises and Small & Medium Enterprises), deployment (Cloud-based and On-premise), and end-user industry (IT & ITES, BFSI, Retail, Healthcare, Industrial, and Other End-user Industries). Growth projections and market sizes are provided for each segment based on extensive analysis of historical data, current market trends, and future projections. Competitive dynamics within each segment are analyzed to identify key players, their market shares, and competitive strategies. The report analyzes how each segment is expected to contribute to overall market growth and the factors that will influence future market share.
Key Drivers of Container Security Industry Growth
The growth of the Container Security industry is driven by several key factors. The increasing adoption of cloud-native applications and microservices architectures necessitates robust security solutions for containerized environments. The rising frequency and sophistication of cyberattacks targeting containerized workloads are pushing organizations to adopt more sophisticated security measures. Furthermore, stringent regulatory compliance requirements and industry standards are driving the demand for container security solutions.
Challenges in the Container Security Industry Sector
The Container Security industry faces several challenges. The complexity of containerized environments and the constantly evolving threat landscape make it difficult to provide comprehensive security. Integrating container security tools with existing DevOps workflows can be challenging, impacting adoption rates. A shortage of skilled professionals specializing in container security poses a significant barrier. Finally, maintaining a balance between security and performance remains a critical challenge for organizations implementing container security solutions. The cost of implementation and ongoing maintenance can also hinder adoption, especially for SMEs.
Emerging Opportunities in Container Security Industry
The Container Security market presents numerous emerging opportunities. The increasing adoption of serverless computing and edge computing creates a demand for new security solutions that address the unique challenges of these environments. The growing adoption of AI and machine learning in security offers opportunities to develop more sophisticated threat detection and response capabilities. The expansion of container security solutions into new verticals, such as industrial automation and IoT, represents significant growth potential. Finally, the focus on DevSecOps practices will drive demand for integrated and automated security tools.
Leading Players in the Container Security Industry Market
- Thales eSecurity (Thales Group)
- NeuVector Inc (SUSE Software Solutions Germany GmbH)
- Mirantis Inc (Docker Inc)
- Google LLC (Alphabet Inc)
- Fidelis Cybersecurity Inc
- Red Hat Inc
- Trend Micro Incorporated
- Rapid7 Inc
- Qualys Inc
- Aqua Security Software Ltd
- Palo Alto Networks Inc
Key Developments in Container Security Industry Industry
October 2022: Veracode launched its Container Security service, providing vulnerability scanning, secure configuration, and secrets management for container images. This expansion significantly impacts the market by providing a comprehensive solution for existing clients.
August 2022: Tigera released new container security features in Calico Cloud, enhancing malware protection, image assurance, runtime visibility, and admission control. This development strengthens the company's position and offers customers a comprehensive container security solution.
Strategic Outlook for Container Security Industry Market
The Container Security market is poised for significant growth driven by the continued adoption of containerization technologies and increasing cybersecurity threats. The market will benefit from innovative solutions such as AI-driven threat detection and response and enhanced integration with DevOps workflows. Expansion into new vertical markets, particularly IoT and edge computing, presents substantial opportunities. Continued focus on user-friendly interfaces, automation, and ease of integration will remain critical for success. The market is projected to expand significantly in the coming years, with considerable opportunities for established players and new entrants to capitalize on the evolving technological landscape.
Container Security Industry Segmentation
-
1. Organisation Size
- 1.1. Large Enterprises
- 1.2. Small & Medium Enterprises
-
2. Deployment
- 2.1. Cloud-based
- 2.2. On-premise
-
3. End-user Industry
- 3.1. IT & ITES
- 3.2. BFSI
- 3.3. Retail
- 3.4. Healthcare
- 3.5. Industrial
- 3.6. Other End-user Industries
Container Security Industry Segmentation By Geography
-
1. North America
- 1.1. United States
- 1.2. Canada
-
2. Europe
- 2.1. United Kingdom
- 2.2. Germany
- 2.3. Rest of Europe
-
3. Asia Pacific
- 3.1. China
- 3.2. Japan
- 3.3. Rest of Asia Pacific
-
4. Rest of the World
- 4.1. Latin America
- 4.2. Middle East
Container Security Industry REPORT HIGHLIGHTS
| Aspects | Details |
|---|---|
| Study Period | 2019-2033 |
| Base Year | 2024 |
| Estimated Year | 2025 |
| Forecast Period | 2025-2033 |
| Historical Period | 2019-2024 |
| Growth Rate | CAGR of 22.54% from 2019-2033 |
| Segmentation |
|
Table of Contents
- 1. Introduction
- 1.1. Research Scope
- 1.2. Market Segmentation
- 1.3. Research Methodology
- 1.4. Definitions and Assumptions
- 2. Executive Summary
- 2.1. Introduction
- 3. Market Dynamics
- 3.1. Introduction
- 3.2. Market Drivers
- 3.2.1. Rising Adoption of the Hybrid Cloud Technology Applications; Growing Vulnerability Concern across the Container Architecture
- 3.3. Market Restrains
- 3.3.1. Complexity in Managing the Cloud Environments; Inadequate Budgets in SMEs and Lack of Technical Expertise
- 3.4. Market Trends
- 3.4.1. Rising Adoption of the Hybrid Cloud Technology Applications may Drive the Market Growth
- 4. Market Factor Analysis
- 4.1. Porters Five Forces
- 4.2. Supply/Value Chain
- 4.3. PESTEL analysis
- 4.4. Market Entropy
- 4.5. Patent/Trademark Analysis
- 5. Global Container Security Industry Analysis, Insights and Forecast, 2019-2031
- 5.1. Market Analysis, Insights and Forecast - by Organisation Size
- 5.1.1. Large Enterprises
- 5.1.2. Small & Medium Enterprises
- 5.2. Market Analysis, Insights and Forecast - by Deployment
- 5.2.1. Cloud-based
- 5.2.2. On-premise
- 5.3. Market Analysis, Insights and Forecast - by End-user Industry
- 5.3.1. IT & ITES
- 5.3.2. BFSI
- 5.3.3. Retail
- 5.3.4. Healthcare
- 5.3.5. Industrial
- 5.3.6. Other End-user Industries
- 5.4. Market Analysis, Insights and Forecast - by Region
- 5.4.1. North America
- 5.4.2. Europe
- 5.4.3. Asia Pacific
- 5.4.4. Rest of the World
- 5.1. Market Analysis, Insights and Forecast - by Organisation Size
- 6. North America Container Security Industry Analysis, Insights and Forecast, 2019-2031
- 6.1. Market Analysis, Insights and Forecast - by Organisation Size
- 6.1.1. Large Enterprises
- 6.1.2. Small & Medium Enterprises
- 6.2. Market Analysis, Insights and Forecast - by Deployment
- 6.2.1. Cloud-based
- 6.2.2. On-premise
- 6.3. Market Analysis, Insights and Forecast - by End-user Industry
- 6.3.1. IT & ITES
- 6.3.2. BFSI
- 6.3.3. Retail
- 6.3.4. Healthcare
- 6.3.5. Industrial
- 6.3.6. Other End-user Industries
- 6.1. Market Analysis, Insights and Forecast - by Organisation Size
- 7. Europe Container Security Industry Analysis, Insights and Forecast, 2019-2031
- 7.1. Market Analysis, Insights and Forecast - by Organisation Size
- 7.1.1. Large Enterprises
- 7.1.2. Small & Medium Enterprises
- 7.2. Market Analysis, Insights and Forecast - by Deployment
- 7.2.1. Cloud-based
- 7.2.2. On-premise
- 7.3. Market Analysis, Insights and Forecast - by End-user Industry
- 7.3.1. IT & ITES
- 7.3.2. BFSI
- 7.3.3. Retail
- 7.3.4. Healthcare
- 7.3.5. Industrial
- 7.3.6. Other End-user Industries
- 7.1. Market Analysis, Insights and Forecast - by Organisation Size
- 8. Asia Pacific Container Security Industry Analysis, Insights and Forecast, 2019-2031
- 8.1. Market Analysis, Insights and Forecast - by Organisation Size
- 8.1.1. Large Enterprises
- 8.1.2. Small & Medium Enterprises
- 8.2. Market Analysis, Insights and Forecast - by Deployment
- 8.2.1. Cloud-based
- 8.2.2. On-premise
- 8.3. Market Analysis, Insights and Forecast - by End-user Industry
- 8.3.1. IT & ITES
- 8.3.2. BFSI
- 8.3.3. Retail
- 8.3.4. Healthcare
- 8.3.5. Industrial
- 8.3.6. Other End-user Industries
- 8.1. Market Analysis, Insights and Forecast - by Organisation Size
- 9. Rest of the World Container Security Industry Analysis, Insights and Forecast, 2019-2031
- 9.1. Market Analysis, Insights and Forecast - by Organisation Size
- 9.1.1. Large Enterprises
- 9.1.2. Small & Medium Enterprises
- 9.2. Market Analysis, Insights and Forecast - by Deployment
- 9.2.1. Cloud-based
- 9.2.2. On-premise
- 9.3. Market Analysis, Insights and Forecast - by End-user Industry
- 9.3.1. IT & ITES
- 9.3.2. BFSI
- 9.3.3. Retail
- 9.3.4. Healthcare
- 9.3.5. Industrial
- 9.3.6. Other End-user Industries
- 9.1. Market Analysis, Insights and Forecast - by Organisation Size
- 10. North America Container Security Industry Analysis, Insights and Forecast, 2019-2031
- 10.1. Market Analysis, Insights and Forecast - By Country/Sub-region
- 10.1.1 United States
- 10.1.2 Canada
- 10.1.3 Mexico
- 11. Europe Container Security Industry Analysis, Insights and Forecast, 2019-2031
- 11.1. Market Analysis, Insights and Forecast - By Country/Sub-region
- 11.1.1 Germany
- 11.1.2 United Kingdom
- 11.1.3 France
- 11.1.4 Spain
- 11.1.5 Italy
- 11.1.6 Spain
- 11.1.7 Belgium
- 11.1.8 Netherland
- 11.1.9 Nordics
- 11.1.10 Rest of Europe
- 12. Asia Pacific Container Security Industry Analysis, Insights and Forecast, 2019-2031
- 12.1. Market Analysis, Insights and Forecast - By Country/Sub-region
- 12.1.1 China
- 12.1.2 Japan
- 12.1.3 India
- 12.1.4 South Korea
- 12.1.5 Southeast Asia
- 12.1.6 Australia
- 12.1.7 Indonesia
- 12.1.8 Phillipes
- 12.1.9 Singapore
- 12.1.10 Thailandc
- 12.1.11 Rest of Asia Pacific
- 13. South America Container Security Industry Analysis, Insights and Forecast, 2019-2031
- 13.1. Market Analysis, Insights and Forecast - By Country/Sub-region
- 13.1.1 Brazil
- 13.1.2 Argentina
- 13.1.3 Peru
- 13.1.4 Chile
- 13.1.5 Colombia
- 13.1.6 Ecuador
- 13.1.7 Venezuela
- 13.1.8 Rest of South America
- 14. North America Container Security Industry Analysis, Insights and Forecast, 2019-2031
- 14.1. Market Analysis, Insights and Forecast - By Country/Sub-region
- 14.1.1 United States
- 14.1.2 Canada
- 14.1.3 Mexico
- 15. MEA Container Security Industry Analysis, Insights and Forecast, 2019-2031
- 15.1. Market Analysis, Insights and Forecast - By Country/Sub-region
- 15.1.1 United Arab Emirates
- 15.1.2 Saudi Arabia
- 15.1.3 South Africa
- 15.1.4 Rest of Middle East and Africa
- 16. Competitive Analysis
- 16.1. Global Market Share Analysis 2024
- 16.2. Company Profiles
- 16.2.1 Thales eSecurity (Thales Group)
- 16.2.1.1. Overview
- 16.2.1.2. Products
- 16.2.1.3. SWOT Analysis
- 16.2.1.4. Recent Developments
- 16.2.1.5. Financials (Based on Availability)
- 16.2.2 NeuVector Inc (SUSE Software Solutions Germany GmbH)
- 16.2.2.1. Overview
- 16.2.2.2. Products
- 16.2.2.3. SWOT Analysis
- 16.2.2.4. Recent Developments
- 16.2.2.5. Financials (Based on Availability)
- 16.2.3 Mirantis Inc (Docker Inc )
- 16.2.3.1. Overview
- 16.2.3.2. Products
- 16.2.3.3. SWOT Analysis
- 16.2.3.4. Recent Developments
- 16.2.3.5. Financials (Based on Availability)
- 16.2.4 Google LLC (Alphabet Inc )
- 16.2.4.1. Overview
- 16.2.4.2. Products
- 16.2.4.3. SWOT Analysis
- 16.2.4.4. Recent Developments
- 16.2.4.5. Financials (Based on Availability)
- 16.2.5 Fidelis Cybersecurity Inc
- 16.2.5.1. Overview
- 16.2.5.2. Products
- 16.2.5.3. SWOT Analysis
- 16.2.5.4. Recent Developments
- 16.2.5.5. Financials (Based on Availability)
- 16.2.6 Red Hat Inc
- 16.2.6.1. Overview
- 16.2.6.2. Products
- 16.2.6.3. SWOT Analysis
- 16.2.6.4. Recent Developments
- 16.2.6.5. Financials (Based on Availability)
- 16.2.7 Trend Micro Incorporated
- 16.2.7.1. Overview
- 16.2.7.2. Products
- 16.2.7.3. SWOT Analysis
- 16.2.7.4. Recent Developments
- 16.2.7.5. Financials (Based on Availability)
- 16.2.8 Rapid7 Inc
- 16.2.8.1. Overview
- 16.2.8.2. Products
- 16.2.8.3. SWOT Analysis
- 16.2.8.4. Recent Developments
- 16.2.8.5. Financials (Based on Availability)
- 16.2.9 Qualys Inc
- 16.2.9.1. Overview
- 16.2.9.2. Products
- 16.2.9.3. SWOT Analysis
- 16.2.9.4. Recent Developments
- 16.2.9.5. Financials (Based on Availability)
- 16.2.10 Aqua Security Software Ltd
- 16.2.10.1. Overview
- 16.2.10.2. Products
- 16.2.10.3. SWOT Analysis
- 16.2.10.4. Recent Developments
- 16.2.10.5. Financials (Based on Availability)
- 16.2.11 Palo Alto Networks Inc
- 16.2.11.1. Overview
- 16.2.11.2. Products
- 16.2.11.3. SWOT Analysis
- 16.2.11.4. Recent Developments
- 16.2.11.5. Financials (Based on Availability)
- 16.2.1 Thales eSecurity (Thales Group)
List of Figures
- Figure 1: Global Container Security Industry Revenue Breakdown (Million, %) by Region 2024 & 2032
- Figure 2: Global Container Security Industry Volume Breakdown (K Unit, %) by Region 2024 & 2032
- Figure 3: North America Container Security Industry Revenue (Million), by Country 2024 & 2032
- Figure 4: North America Container Security Industry Volume (K Unit), by Country 2024 & 2032
- Figure 5: North America Container Security Industry Revenue Share (%), by Country 2024 & 2032
- Figure 6: North America Container Security Industry Volume Share (%), by Country 2024 & 2032
- Figure 7: Europe Container Security Industry Revenue (Million), by Country 2024 & 2032
- Figure 8: Europe Container Security Industry Volume (K Unit), by Country 2024 & 2032
- Figure 9: Europe Container Security Industry Revenue Share (%), by Country 2024 & 2032
- Figure 10: Europe Container Security Industry Volume Share (%), by Country 2024 & 2032
- Figure 11: Asia Pacific Container Security Industry Revenue (Million), by Country 2024 & 2032
- Figure 12: Asia Pacific Container Security Industry Volume (K Unit), by Country 2024 & 2032
- Figure 13: Asia Pacific Container Security Industry Revenue Share (%), by Country 2024 & 2032
- Figure 14: Asia Pacific Container Security Industry Volume Share (%), by Country 2024 & 2032
- Figure 15: South America Container Security Industry Revenue (Million), by Country 2024 & 2032
- Figure 16: South America Container Security Industry Volume (K Unit), by Country 2024 & 2032
- Figure 17: South America Container Security Industry Revenue Share (%), by Country 2024 & 2032
- Figure 18: South America Container Security Industry Volume Share (%), by Country 2024 & 2032
- Figure 19: North America Container Security Industry Revenue (Million), by Country 2024 & 2032
- Figure 20: North America Container Security Industry Volume (K Unit), by Country 2024 & 2032
- Figure 21: North America Container Security Industry Revenue Share (%), by Country 2024 & 2032
- Figure 22: North America Container Security Industry Volume Share (%), by Country 2024 & 2032
- Figure 23: MEA Container Security Industry Revenue (Million), by Country 2024 & 2032
- Figure 24: MEA Container Security Industry Volume (K Unit), by Country 2024 & 2032
- Figure 25: MEA Container Security Industry Revenue Share (%), by Country 2024 & 2032
- Figure 26: MEA Container Security Industry Volume Share (%), by Country 2024 & 2032
- Figure 27: North America Container Security Industry Revenue (Million), by Organisation Size 2024 & 2032
- Figure 28: North America Container Security Industry Volume (K Unit), by Organisation Size 2024 & 2032
- Figure 29: North America Container Security Industry Revenue Share (%), by Organisation Size 2024 & 2032
- Figure 30: North America Container Security Industry Volume Share (%), by Organisation Size 2024 & 2032
- Figure 31: North America Container Security Industry Revenue (Million), by Deployment 2024 & 2032
- Figure 32: North America Container Security Industry Volume (K Unit), by Deployment 2024 & 2032
- Figure 33: North America Container Security Industry Revenue Share (%), by Deployment 2024 & 2032
- Figure 34: North America Container Security Industry Volume Share (%), by Deployment 2024 & 2032
- Figure 35: North America Container Security Industry Revenue (Million), by End-user Industry 2024 & 2032
- Figure 36: North America Container Security Industry Volume (K Unit), by End-user Industry 2024 & 2032
- Figure 37: North America Container Security Industry Revenue Share (%), by End-user Industry 2024 & 2032
- Figure 38: North America Container Security Industry Volume Share (%), by End-user Industry 2024 & 2032
- Figure 39: North America Container Security Industry Revenue (Million), by Country 2024 & 2032
- Figure 40: North America Container Security Industry Volume (K Unit), by Country 2024 & 2032
- Figure 41: North America Container Security Industry Revenue Share (%), by Country 2024 & 2032
- Figure 42: North America Container Security Industry Volume Share (%), by Country 2024 & 2032
- Figure 43: Europe Container Security Industry Revenue (Million), by Organisation Size 2024 & 2032
- Figure 44: Europe Container Security Industry Volume (K Unit), by Organisation Size 2024 & 2032
- Figure 45: Europe Container Security Industry Revenue Share (%), by Organisation Size 2024 & 2032
- Figure 46: Europe Container Security Industry Volume Share (%), by Organisation Size 2024 & 2032
- Figure 47: Europe Container Security Industry Revenue (Million), by Deployment 2024 & 2032
- Figure 48: Europe Container Security Industry Volume (K Unit), by Deployment 2024 & 2032
- Figure 49: Europe Container Security Industry Revenue Share (%), by Deployment 2024 & 2032
- Figure 50: Europe Container Security Industry Volume Share (%), by Deployment 2024 & 2032
- Figure 51: Europe Container Security Industry Revenue (Million), by End-user Industry 2024 & 2032
- Figure 52: Europe Container Security Industry Volume (K Unit), by End-user Industry 2024 & 2032
- Figure 53: Europe Container Security Industry Revenue Share (%), by End-user Industry 2024 & 2032
- Figure 54: Europe Container Security Industry Volume Share (%), by End-user Industry 2024 & 2032
- Figure 55: Europe Container Security Industry Revenue (Million), by Country 2024 & 2032
- Figure 56: Europe Container Security Industry Volume (K Unit), by Country 2024 & 2032
- Figure 57: Europe Container Security Industry Revenue Share (%), by Country 2024 & 2032
- Figure 58: Europe Container Security Industry Volume Share (%), by Country 2024 & 2032
- Figure 59: Asia Pacific Container Security Industry Revenue (Million), by Organisation Size 2024 & 2032
- Figure 60: Asia Pacific Container Security Industry Volume (K Unit), by Organisation Size 2024 & 2032
- Figure 61: Asia Pacific Container Security Industry Revenue Share (%), by Organisation Size 2024 & 2032
- Figure 62: Asia Pacific Container Security Industry Volume Share (%), by Organisation Size 2024 & 2032
- Figure 63: Asia Pacific Container Security Industry Revenue (Million), by Deployment 2024 & 2032
- Figure 64: Asia Pacific Container Security Industry Volume (K Unit), by Deployment 2024 & 2032
- Figure 65: Asia Pacific Container Security Industry Revenue Share (%), by Deployment 2024 & 2032
- Figure 66: Asia Pacific Container Security Industry Volume Share (%), by Deployment 2024 & 2032
- Figure 67: Asia Pacific Container Security Industry Revenue (Million), by End-user Industry 2024 & 2032
- Figure 68: Asia Pacific Container Security Industry Volume (K Unit), by End-user Industry 2024 & 2032
- Figure 69: Asia Pacific Container Security Industry Revenue Share (%), by End-user Industry 2024 & 2032
- Figure 70: Asia Pacific Container Security Industry Volume Share (%), by End-user Industry 2024 & 2032
- Figure 71: Asia Pacific Container Security Industry Revenue (Million), by Country 2024 & 2032
- Figure 72: Asia Pacific Container Security Industry Volume (K Unit), by Country 2024 & 2032
- Figure 73: Asia Pacific Container Security Industry Revenue Share (%), by Country 2024 & 2032
- Figure 74: Asia Pacific Container Security Industry Volume Share (%), by Country 2024 & 2032
- Figure 75: Rest of the World Container Security Industry Revenue (Million), by Organisation Size 2024 & 2032
- Figure 76: Rest of the World Container Security Industry Volume (K Unit), by Organisation Size 2024 & 2032
- Figure 77: Rest of the World Container Security Industry Revenue Share (%), by Organisation Size 2024 & 2032
- Figure 78: Rest of the World Container Security Industry Volume Share (%), by Organisation Size 2024 & 2032
- Figure 79: Rest of the World Container Security Industry Revenue (Million), by Deployment 2024 & 2032
- Figure 80: Rest of the World Container Security Industry Volume (K Unit), by Deployment 2024 & 2032
- Figure 81: Rest of the World Container Security Industry Revenue Share (%), by Deployment 2024 & 2032
- Figure 82: Rest of the World Container Security Industry Volume Share (%), by Deployment 2024 & 2032
- Figure 83: Rest of the World Container Security Industry Revenue (Million), by End-user Industry 2024 & 2032
- Figure 84: Rest of the World Container Security Industry Volume (K Unit), by End-user Industry 2024 & 2032
- Figure 85: Rest of the World Container Security Industry Revenue Share (%), by End-user Industry 2024 & 2032
- Figure 86: Rest of the World Container Security Industry Volume Share (%), by End-user Industry 2024 & 2032
- Figure 87: Rest of the World Container Security Industry Revenue (Million), by Country 2024 & 2032
- Figure 88: Rest of the World Container Security Industry Volume (K Unit), by Country 2024 & 2032
- Figure 89: Rest of the World Container Security Industry Revenue Share (%), by Country 2024 & 2032
- Figure 90: Rest of the World Container Security Industry Volume Share (%), by Country 2024 & 2032
List of Tables
- Table 1: Global Container Security Industry Revenue Million Forecast, by Region 2019 & 2032
- Table 2: Global Container Security Industry Volume K Unit Forecast, by Region 2019 & 2032
- Table 3: Global Container Security Industry Revenue Million Forecast, by Organisation Size 2019 & 2032
- Table 4: Global Container Security Industry Volume K Unit Forecast, by Organisation Size 2019 & 2032
- Table 5: Global Container Security Industry Revenue Million Forecast, by Deployment 2019 & 2032
- Table 6: Global Container Security Industry Volume K Unit Forecast, by Deployment 2019 & 2032
- Table 7: Global Container Security Industry Revenue Million Forecast, by End-user Industry 2019 & 2032
- Table 8: Global Container Security Industry Volume K Unit Forecast, by End-user Industry 2019 & 2032
- Table 9: Global Container Security Industry Revenue Million Forecast, by Region 2019 & 2032
- Table 10: Global Container Security Industry Volume K Unit Forecast, by Region 2019 & 2032
- Table 11: Global Container Security Industry Revenue Million Forecast, by Country 2019 & 2032
- Table 12: Global Container Security Industry Volume K Unit Forecast, by Country 2019 & 2032
- Table 13: United States Container Security Industry Revenue (Million) Forecast, by Application 2019 & 2032
- Table 14: United States Container Security Industry Volume (K Unit) Forecast, by Application 2019 & 2032
- Table 15: Canada Container Security Industry Revenue (Million) Forecast, by Application 2019 & 2032
- Table 16: Canada Container Security Industry Volume (K Unit) Forecast, by Application 2019 & 2032
- Table 17: Mexico Container Security Industry Revenue (Million) Forecast, by Application 2019 & 2032
- Table 18: Mexico Container Security Industry Volume (K Unit) Forecast, by Application 2019 & 2032
- Table 19: Global Container Security Industry Revenue Million Forecast, by Country 2019 & 2032
- Table 20: Global Container Security Industry Volume K Unit Forecast, by Country 2019 & 2032
- Table 21: Germany Container Security Industry Revenue (Million) Forecast, by Application 2019 & 2032
- Table 22: Germany Container Security Industry Volume (K Unit) Forecast, by Application 2019 & 2032
- Table 23: United Kingdom Container Security Industry Revenue (Million) Forecast, by Application 2019 & 2032
- Table 24: United Kingdom Container Security Industry Volume (K Unit) Forecast, by Application 2019 & 2032
- Table 25: France Container Security Industry Revenue (Million) Forecast, by Application 2019 & 2032
- Table 26: France Container Security Industry Volume (K Unit) Forecast, by Application 2019 & 2032
- Table 27: Spain Container Security Industry Revenue (Million) Forecast, by Application 2019 & 2032
- Table 28: Spain Container Security Industry Volume (K Unit) Forecast, by Application 2019 & 2032
- Table 29: Italy Container Security Industry Revenue (Million) Forecast, by Application 2019 & 2032
- Table 30: Italy Container Security Industry Volume (K Unit) Forecast, by Application 2019 & 2032
- Table 31: Spain Container Security Industry Revenue (Million) Forecast, by Application 2019 & 2032
- Table 32: Spain Container Security Industry Volume (K Unit) Forecast, by Application 2019 & 2032
- Table 33: Belgium Container Security Industry Revenue (Million) Forecast, by Application 2019 & 2032
- Table 34: Belgium Container Security Industry Volume (K Unit) Forecast, by Application 2019 & 2032
- Table 35: Netherland Container Security Industry Revenue (Million) Forecast, by Application 2019 & 2032
- Table 36: Netherland Container Security Industry Volume (K Unit) Forecast, by Application 2019 & 2032
- Table 37: Nordics Container Security Industry Revenue (Million) Forecast, by Application 2019 & 2032
- Table 38: Nordics Container Security Industry Volume (K Unit) Forecast, by Application 2019 & 2032
- Table 39: Rest of Europe Container Security Industry Revenue (Million) Forecast, by Application 2019 & 2032
- Table 40: Rest of Europe Container Security Industry Volume (K Unit) Forecast, by Application 2019 & 2032
- Table 41: Global Container Security Industry Revenue Million Forecast, by Country 2019 & 2032
- Table 42: Global Container Security Industry Volume K Unit Forecast, by Country 2019 & 2032
- Table 43: China Container Security Industry Revenue (Million) Forecast, by Application 2019 & 2032
- Table 44: China Container Security Industry Volume (K Unit) Forecast, by Application 2019 & 2032
- Table 45: Japan Container Security Industry Revenue (Million) Forecast, by Application 2019 & 2032
- Table 46: Japan Container Security Industry Volume (K Unit) Forecast, by Application 2019 & 2032
- Table 47: India Container Security Industry Revenue (Million) Forecast, by Application 2019 & 2032
- Table 48: India Container Security Industry Volume (K Unit) Forecast, by Application 2019 & 2032
- Table 49: South Korea Container Security Industry Revenue (Million) Forecast, by Application 2019 & 2032
- Table 50: South Korea Container Security Industry Volume (K Unit) Forecast, by Application 2019 & 2032
- Table 51: Southeast Asia Container Security Industry Revenue (Million) Forecast, by Application 2019 & 2032
- Table 52: Southeast Asia Container Security Industry Volume (K Unit) Forecast, by Application 2019 & 2032
- Table 53: Australia Container Security Industry Revenue (Million) Forecast, by Application 2019 & 2032
- Table 54: Australia Container Security Industry Volume (K Unit) Forecast, by Application 2019 & 2032
- Table 55: Indonesia Container Security Industry Revenue (Million) Forecast, by Application 2019 & 2032
- Table 56: Indonesia Container Security Industry Volume (K Unit) Forecast, by Application 2019 & 2032
- Table 57: Phillipes Container Security Industry Revenue (Million) Forecast, by Application 2019 & 2032
- Table 58: Phillipes Container Security Industry Volume (K Unit) Forecast, by Application 2019 & 2032
- Table 59: Singapore Container Security Industry Revenue (Million) Forecast, by Application 2019 & 2032
- Table 60: Singapore Container Security Industry Volume (K Unit) Forecast, by Application 2019 & 2032
- Table 61: Thailandc Container Security Industry Revenue (Million) Forecast, by Application 2019 & 2032
- Table 62: Thailandc Container Security Industry Volume (K Unit) Forecast, by Application 2019 & 2032
- Table 63: Rest of Asia Pacific Container Security Industry Revenue (Million) Forecast, by Application 2019 & 2032
- Table 64: Rest of Asia Pacific Container Security Industry Volume (K Unit) Forecast, by Application 2019 & 2032
- Table 65: Global Container Security Industry Revenue Million Forecast, by Country 2019 & 2032
- Table 66: Global Container Security Industry Volume K Unit Forecast, by Country 2019 & 2032
- Table 67: Brazil Container Security Industry Revenue (Million) Forecast, by Application 2019 & 2032
- Table 68: Brazil Container Security Industry Volume (K Unit) Forecast, by Application 2019 & 2032
- Table 69: Argentina Container Security Industry Revenue (Million) Forecast, by Application 2019 & 2032
- Table 70: Argentina Container Security Industry Volume (K Unit) Forecast, by Application 2019 & 2032
- Table 71: Peru Container Security Industry Revenue (Million) Forecast, by Application 2019 & 2032
- Table 72: Peru Container Security Industry Volume (K Unit) Forecast, by Application 2019 & 2032
- Table 73: Chile Container Security Industry Revenue (Million) Forecast, by Application 2019 & 2032
- Table 74: Chile Container Security Industry Volume (K Unit) Forecast, by Application 2019 & 2032
- Table 75: Colombia Container Security Industry Revenue (Million) Forecast, by Application 2019 & 2032
- Table 76: Colombia Container Security Industry Volume (K Unit) Forecast, by Application 2019 & 2032
- Table 77: Ecuador Container Security Industry Revenue (Million) Forecast, by Application 2019 & 2032
- Table 78: Ecuador Container Security Industry Volume (K Unit) Forecast, by Application 2019 & 2032
- Table 79: Venezuela Container Security Industry Revenue (Million) Forecast, by Application 2019 & 2032
- Table 80: Venezuela Container Security Industry Volume (K Unit) Forecast, by Application 2019 & 2032
- Table 81: Rest of South America Container Security Industry Revenue (Million) Forecast, by Application 2019 & 2032
- Table 82: Rest of South America Container Security Industry Volume (K Unit) Forecast, by Application 2019 & 2032
- Table 83: Global Container Security Industry Revenue Million Forecast, by Country 2019 & 2032
- Table 84: Global Container Security Industry Volume K Unit Forecast, by Country 2019 & 2032
- Table 85: United States Container Security Industry Revenue (Million) Forecast, by Application 2019 & 2032
- Table 86: United States Container Security Industry Volume (K Unit) Forecast, by Application 2019 & 2032
- Table 87: Canada Container Security Industry Revenue (Million) Forecast, by Application 2019 & 2032
- Table 88: Canada Container Security Industry Volume (K Unit) Forecast, by Application 2019 & 2032
- Table 89: Mexico Container Security Industry Revenue (Million) Forecast, by Application 2019 & 2032
- Table 90: Mexico Container Security Industry Volume (K Unit) Forecast, by Application 2019 & 2032
- Table 91: Global Container Security Industry Revenue Million Forecast, by Country 2019 & 2032
- Table 92: Global Container Security Industry Volume K Unit Forecast, by Country 2019 & 2032
- Table 93: United Arab Emirates Container Security Industry Revenue (Million) Forecast, by Application 2019 & 2032
- Table 94: United Arab Emirates Container Security Industry Volume (K Unit) Forecast, by Application 2019 & 2032
- Table 95: Saudi Arabia Container Security Industry Revenue (Million) Forecast, by Application 2019 & 2032
- Table 96: Saudi Arabia Container Security Industry Volume (K Unit) Forecast, by Application 2019 & 2032
- Table 97: South Africa Container Security Industry Revenue (Million) Forecast, by Application 2019 & 2032
- Table 98: South Africa Container Security Industry Volume (K Unit) Forecast, by Application 2019 & 2032
- Table 99: Rest of Middle East and Africa Container Security Industry Revenue (Million) Forecast, by Application 2019 & 2032
- Table 100: Rest of Middle East and Africa Container Security Industry Volume (K Unit) Forecast, by Application 2019 & 2032
- Table 101: Global Container Security Industry Revenue Million Forecast, by Organisation Size 2019 & 2032
- Table 102: Global Container Security Industry Volume K Unit Forecast, by Organisation Size 2019 & 2032
- Table 103: Global Container Security Industry Revenue Million Forecast, by Deployment 2019 & 2032
- Table 104: Global Container Security Industry Volume K Unit Forecast, by Deployment 2019 & 2032
- Table 105: Global Container Security Industry Revenue Million Forecast, by End-user Industry 2019 & 2032
- Table 106: Global Container Security Industry Volume K Unit Forecast, by End-user Industry 2019 & 2032
- Table 107: Global Container Security Industry Revenue Million Forecast, by Country 2019 & 2032
- Table 108: Global Container Security Industry Volume K Unit Forecast, by Country 2019 & 2032
- Table 109: United States Container Security Industry Revenue (Million) Forecast, by Application 2019 & 2032
- Table 110: United States Container Security Industry Volume (K Unit) Forecast, by Application 2019 & 2032
- Table 111: Canada Container Security Industry Revenue (Million) Forecast, by Application 2019 & 2032
- Table 112: Canada Container Security Industry Volume (K Unit) Forecast, by Application 2019 & 2032
- Table 113: Global Container Security Industry Revenue Million Forecast, by Organisation Size 2019 & 2032
- Table 114: Global Container Security Industry Volume K Unit Forecast, by Organisation Size 2019 & 2032
- Table 115: Global Container Security Industry Revenue Million Forecast, by Deployment 2019 & 2032
- Table 116: Global Container Security Industry Volume K Unit Forecast, by Deployment 2019 & 2032
- Table 117: Global Container Security Industry Revenue Million Forecast, by End-user Industry 2019 & 2032
- Table 118: Global Container Security Industry Volume K Unit Forecast, by End-user Industry 2019 & 2032
- Table 119: Global Container Security Industry Revenue Million Forecast, by Country 2019 & 2032
- Table 120: Global Container Security Industry Volume K Unit Forecast, by Country 2019 & 2032
- Table 121: United Kingdom Container Security Industry Revenue (Million) Forecast, by Application 2019 & 2032
- Table 122: United Kingdom Container Security Industry Volume (K Unit) Forecast, by Application 2019 & 2032
- Table 123: Germany Container Security Industry Revenue (Million) Forecast, by Application 2019 & 2032
- Table 124: Germany Container Security Industry Volume (K Unit) Forecast, by Application 2019 & 2032
- Table 125: Rest of Europe Container Security Industry Revenue (Million) Forecast, by Application 2019 & 2032
- Table 126: Rest of Europe Container Security Industry Volume (K Unit) Forecast, by Application 2019 & 2032
- Table 127: Global Container Security Industry Revenue Million Forecast, by Organisation Size 2019 & 2032
- Table 128: Global Container Security Industry Volume K Unit Forecast, by Organisation Size 2019 & 2032
- Table 129: Global Container Security Industry Revenue Million Forecast, by Deployment 2019 & 2032
- Table 130: Global Container Security Industry Volume K Unit Forecast, by Deployment 2019 & 2032
- Table 131: Global Container Security Industry Revenue Million Forecast, by End-user Industry 2019 & 2032
- Table 132: Global Container Security Industry Volume K Unit Forecast, by End-user Industry 2019 & 2032
- Table 133: Global Container Security Industry Revenue Million Forecast, by Country 2019 & 2032
- Table 134: Global Container Security Industry Volume K Unit Forecast, by Country 2019 & 2032
- Table 135: China Container Security Industry Revenue (Million) Forecast, by Application 2019 & 2032
- Table 136: China Container Security Industry Volume (K Unit) Forecast, by Application 2019 & 2032
- Table 137: Japan Container Security Industry Revenue (Million) Forecast, by Application 2019 & 2032
- Table 138: Japan Container Security Industry Volume (K Unit) Forecast, by Application 2019 & 2032
- Table 139: Rest of Asia Pacific Container Security Industry Revenue (Million) Forecast, by Application 2019 & 2032
- Table 140: Rest of Asia Pacific Container Security Industry Volume (K Unit) Forecast, by Application 2019 & 2032
- Table 141: Global Container Security Industry Revenue Million Forecast, by Organisation Size 2019 & 2032
- Table 142: Global Container Security Industry Volume K Unit Forecast, by Organisation Size 2019 & 2032
- Table 143: Global Container Security Industry Revenue Million Forecast, by Deployment 2019 & 2032
- Table 144: Global Container Security Industry Volume K Unit Forecast, by Deployment 2019 & 2032
- Table 145: Global Container Security Industry Revenue Million Forecast, by End-user Industry 2019 & 2032
- Table 146: Global Container Security Industry Volume K Unit Forecast, by End-user Industry 2019 & 2032
- Table 147: Global Container Security Industry Revenue Million Forecast, by Country 2019 & 2032
- Table 148: Global Container Security Industry Volume K Unit Forecast, by Country 2019 & 2032
- Table 149: Latin America Container Security Industry Revenue (Million) Forecast, by Application 2019 & 2032
- Table 150: Latin America Container Security Industry Volume (K Unit) Forecast, by Application 2019 & 2032
- Table 151: Middle East Container Security Industry Revenue (Million) Forecast, by Application 2019 & 2032
- Table 152: Middle East Container Security Industry Volume (K Unit) Forecast, by Application 2019 & 2032
Frequently Asked Questions
1. What is the projected Compound Annual Growth Rate (CAGR) of the Container Security Industry?
The projected CAGR is approximately 22.54%.
2. Which companies are prominent players in the Container Security Industry?
Key companies in the market include Thales eSecurity (Thales Group), NeuVector Inc (SUSE Software Solutions Germany GmbH), Mirantis Inc (Docker Inc ), Google LLC (Alphabet Inc ), Fidelis Cybersecurity Inc , Red Hat Inc, Trend Micro Incorporated, Rapid7 Inc, Qualys Inc, Aqua Security Software Ltd, Palo Alto Networks Inc.
3. What are the main segments of the Container Security Industry?
The market segments include Organisation Size, Deployment, End-user Industry.
4. Can you provide details about the market size?
The market size is estimated to be USD 3.28 Million as of 2022.
5. What are some drivers contributing to market growth?
Rising Adoption of the Hybrid Cloud Technology Applications; Growing Vulnerability Concern across the Container Architecture.
6. What are the notable trends driving market growth?
Rising Adoption of the Hybrid Cloud Technology Applications may Drive the Market Growth.
7. Are there any restraints impacting market growth?
Complexity in Managing the Cloud Environments; Inadequate Budgets in SMEs and Lack of Technical Expertise.
8. Can you provide examples of recent developments in the market?
October 2022: Veracode, a prominent global supplier of application security testing solutions, announced the addition of container security to its Continuous Software Security Platform. Existing clients can now participate in the Veracode Container Security early access program. The new Veracode Container Security service addresses the need for vulnerability scanning, secure configuration, and secrets management for container images.
9. What pricing options are available for accessing the report?
Pricing options include single-user, multi-user, and enterprise licenses priced at USD 4750, USD 5250, and USD 8750 respectively.
10. Is the market size provided in terms of value or volume?
The market size is provided in terms of value, measured in Million and volume, measured in K Unit.
11. Are there any specific market keywords associated with the report?
Yes, the market keyword associated with the report is "Container Security Industry," which aids in identifying and referencing the specific market segment covered.
12. How do I determine which pricing option suits my needs best?
The pricing options vary based on user requirements and access needs. Individual users may opt for single-user licenses, while businesses requiring broader access may choose multi-user or enterprise licenses for cost-effective access to the report.
13. Are there any additional resources or data provided in the Container Security Industry report?
While the report offers comprehensive insights, it's advisable to review the specific contents or supplementary materials provided to ascertain if additional resources or data are available.
14. How can I stay updated on further developments or reports in the Container Security Industry?
To stay informed about further developments, trends, and reports in the Container Security Industry, consider subscribing to industry newsletters, following relevant companies and organizations, or regularly checking reputable industry news sources and publications.
Methodology
Step 1 - Identification of Relevant Samples Size from Population Database


Step 2 - Approaches for Defining Global Market Size (Value, Volume* & Price*)

Note*: In applicable scenarios
Step 3 - Data Sources
Primary Research
- Web Analytics
- Survey Reports
- Research Institute
- Latest Research Reports
- Opinion Leaders
Secondary Research
- Annual Reports
- White Paper
- Latest Press Release
- Industry Association
- Paid Database
- Investor Presentations

Step 4 - Data Triangulation
Involves using different sources of information in order to increase the validity of a study
These sources are likely to be stakeholders in a program - participants, other researchers, program staff, other community members, and so on.
Then we put all data in single framework & apply various statistical tools to find out the dynamic on the market.
During the analysis stage, feedback from the stakeholder groups would be compared to determine areas of agreement as well as areas of divergence


