
Key Insights
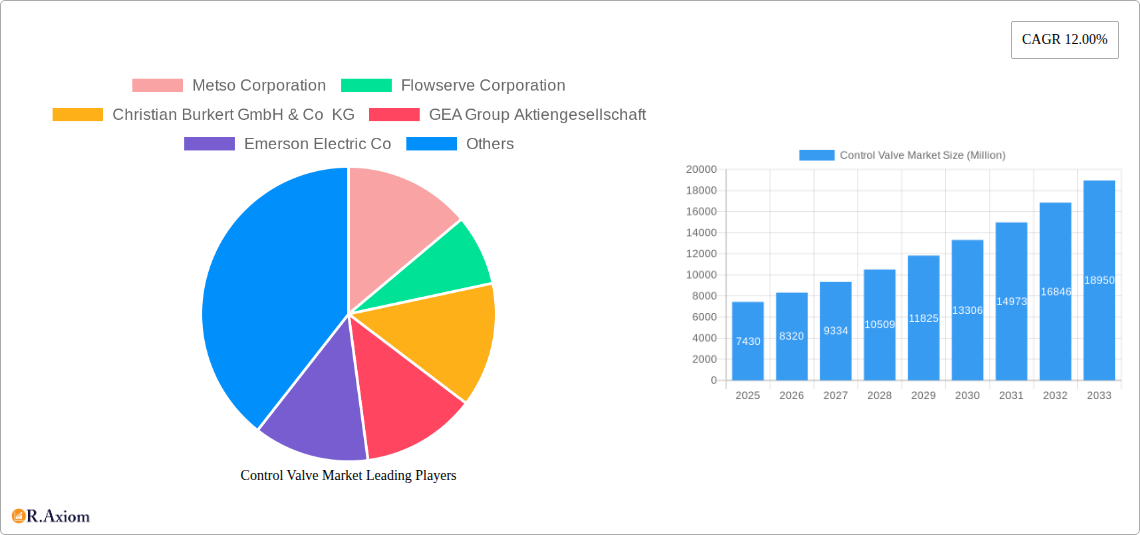
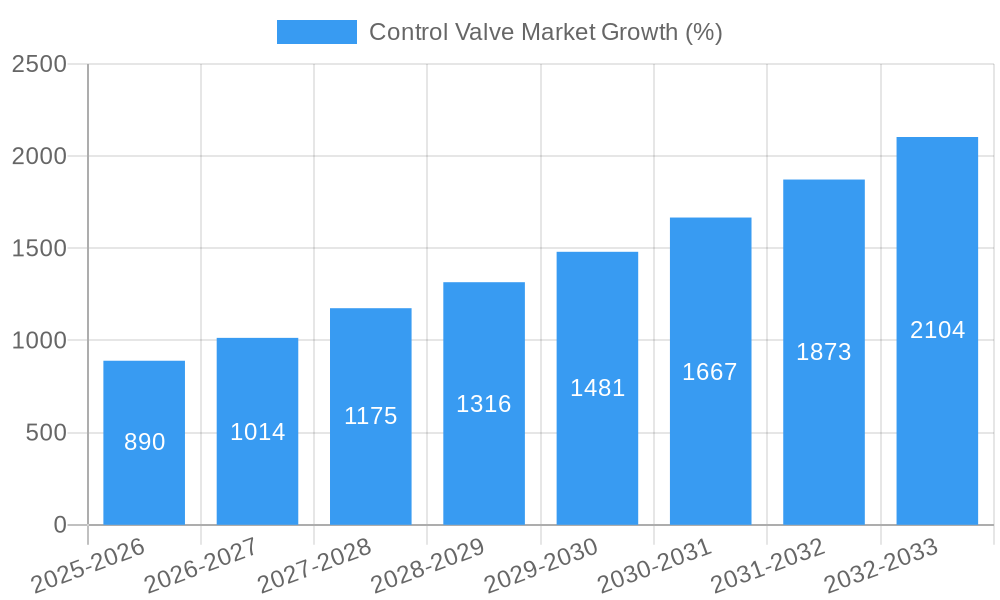
The global control valve market, valued at $7.43 billion in 2025, is projected to experience robust growth, driven by a compound annual growth rate (CAGR) of 12% from 2025 to 2033. This expansion is fueled by several key factors. The increasing demand for automation and process optimization across various industries, particularly in oil and gas, chemical processing, and water treatment, is a significant driver. Furthermore, stringent environmental regulations promoting efficient resource management are bolstering the adoption of advanced control valves. Technological advancements, including the integration of smart sensors and digital technologies for predictive maintenance and improved process control, are further accelerating market growth. The market is segmented by valve type (globe, ball, butterfly, plug, diaphragm, and others) and end-user industry, with oil and gas, chemical, and energy sectors representing substantial market shares. Competition is intense, with major players like Metso Corporation, Flowserve Corporation, and Emerson Electric Co vying for market share through innovation and strategic partnerships. Geographic expansion, particularly in rapidly developing economies in Asia and the Middle East, presents significant growth opportunities.
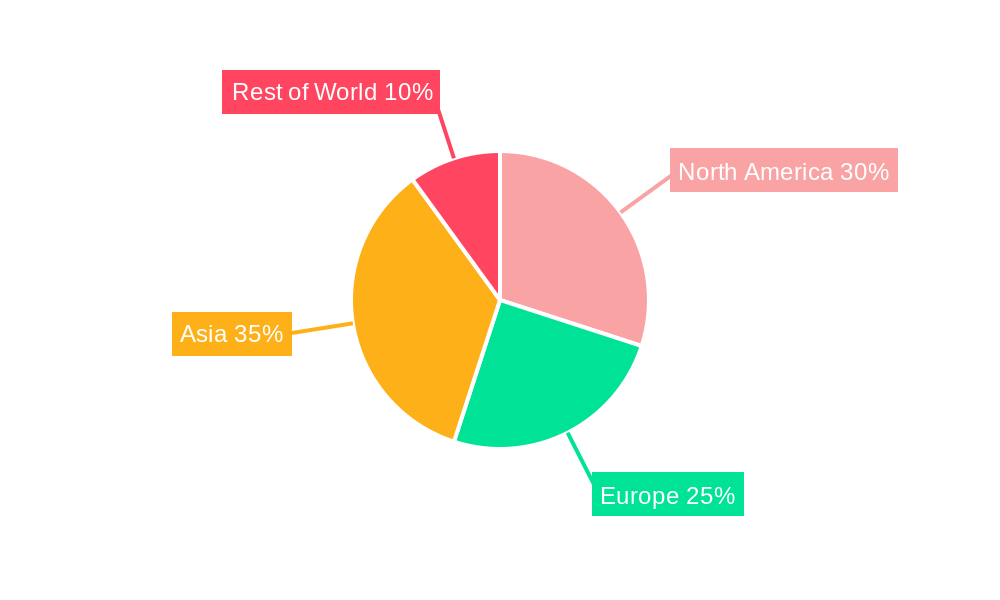
Growth is expected to be particularly strong in regions experiencing rapid industrialization and infrastructure development. Asia, specifically China and India, is anticipated to witness significant market expansion due to burgeoning industrial activities and investments in energy and water infrastructure projects. North America and Europe, while mature markets, will continue to see growth driven by upgrades and replacements of existing valve systems with more efficient and technologically advanced solutions. The market faces some challenges, including fluctuating raw material prices and potential supply chain disruptions. However, the long-term outlook remains positive, fueled by consistent demand for process automation and sustainable industrial practices across the globe. The market's diverse applications and ongoing technological advancements ensure its continued expansion throughout the forecast period.
Control Valve Market: A Comprehensive Report (2019-2033)
This comprehensive report provides an in-depth analysis of the global Control Valve Market, offering valuable insights for stakeholders across the industry. Covering the period from 2019 to 2033, with a focus on 2025, this report meticulously examines market trends, competitive dynamics, and future growth potential. The global Control Valve market size is projected to reach xx Million by 2033.
Control Valve Market Market Concentration & Innovation
The Control Valve market exhibits a moderately concentrated landscape, with several major players holding significant market share. Metso Corporation, Flowserve Corporation, Emerson Electric Co, and Baker Hughes Company are among the leading companies, collectively accounting for an estimated xx% of the global market in 2025. However, the market also features numerous smaller players and regional manufacturers, leading to competitive intensity.
Market innovation is driven by the increasing demand for enhanced efficiency, precision, and durability in various end-use industries. Technological advancements, such as the adoption of smart valves with integrated sensors and data analytics capabilities, are reshaping the market landscape. Stringent environmental regulations, particularly concerning emissions and energy efficiency, further propel innovation.
Product substitution is limited, with the choice of valve type (globe, ball, butterfly, etc.) largely determined by specific application requirements. However, advancements in materials science and manufacturing processes continuously improve existing valve types, leading to better performance and cost-effectiveness. Mergers and acquisitions (M&A) activity has been moderate in recent years, with deal values typically ranging from xx Million to xx Million, driven primarily by strategic expansions and technological integration.
- Key Players Market Share (2025 Estimate): Metso Corporation (xx%), Flowserve Corporation (xx%), Emerson Electric Co (xx%), Baker Hughes Company (xx%), Others (xx%).
- Recent M&A Activity: While specific deal values aren't publicly available for all transactions, the average deal value is estimated at xx Million.
Control Valve Market Industry Trends & Insights
The Control Valve market is experiencing robust growth, driven by several key factors. The increasing demand from the Oil and Gas sector, coupled with expansion in the chemical and petrochemical industries, significantly boosts market size. Technological advancements such as the integration of smart sensors and automation technologies are transforming the industry. The rising adoption of predictive maintenance strategies reduces downtime and operational costs, driving market growth. Consumer preference shifts towards energy-efficient and sustainable solutions further accelerate market expansion. The market is witnessing intense competition among established players and new entrants, leading to continuous product innovation and price optimization. The Compound Annual Growth Rate (CAGR) for the forecast period (2025-2033) is projected at xx%. Market penetration is highest in developed economies, but developing countries are witnessing rapid growth due to infrastructure development.
Dominant Markets & Segments in Control Valve Market
The Oil and Gas sector remains the dominant end-user industry for control valves globally, accounting for an estimated xx% of the market in 2025. This is driven by the ongoing demand for efficient and reliable process control in upstream, midstream, and downstream operations. The Chemical, Petrochemical, and Fertilizer industries are the second largest consumer segment. Geographically, North America and Europe hold significant market share due to the presence of established industrial bases and robust infrastructure. However, the Asia-Pacific region is expected to exhibit the fastest growth rate during the forecast period due to rapid industrialization and infrastructural development.
Key Drivers by Segment:
- Oil and Gas: High capital expenditure in exploration and production, stringent safety regulations.
- Chemical, Petrochemical, and Fertilizer: Growing demand for chemical products, increasing investments in new plant construction.
- Energy and Power: Expansion of renewable energy sources requiring sophisticated control systems.
- Globe Valves: This segment dominates the market due to their versatility and wide range of applications.
Dominance Analysis: North America’s dominance stems from its mature industrial sector and early adoption of advanced control technologies. However, Asia-Pacific's rapid industrialization is poised to challenge this dominance in the coming years.
Control Valve Market Product Developments
Recent innovations in control valves focus on enhancing efficiency, precision, and reducing noise levels. Emerson's Fisher Whisper Trim Technology, launched in November 2023, exemplifies this trend by utilizing additive manufacturing to improve valve performance. Furthermore, the integration of smart sensors and digital technologies facilitates remote monitoring and predictive maintenance, enabling optimized operations. These advancements provide significant competitive advantages by enhancing operational efficiency, reducing maintenance costs, and improving overall reliability.
Report Scope & Segmentation Analysis
This report segments the control valve market by type (Globe, Ball, Butterfly, Plug, Diaphragm, Other Types of Valves) and by end-user industry (Oil and Gas, Chemical, Petrochemical, and Fertilizer, Energy and Power, Water and Wastewater Treatment, Metal and Mining, Other End-user Industries). Each segment is analyzed in terms of its market size, growth projections, and competitive dynamics. For example, the Globe valve segment is expected to maintain its dominance due to its versatility, while the Oil and Gas segment will continue driving market expansion.
Key Drivers of Control Valve Market Growth
Several factors fuel the Control Valve market's growth. Technological advancements in automation and digitalization lead to increased efficiency and reduced operational costs. Stringent environmental regulations are pushing adoption of energy-efficient valves. Expansion in key end-user industries, particularly Oil & Gas and Chemicals, also contributes to market expansion. Government incentives and investments in infrastructure projects further bolster market growth.
Challenges in the Control Valve Market Sector
The Control Valve market faces several challenges. Fluctuations in raw material prices and supply chain disruptions can impact profitability. Intense competition and price pressures from both established and new market entrants present obstacles. Stringent regulatory compliance requirements add to operational complexities. These challenges can result in reduced profit margins and slow market expansion in certain regions.
Emerging Opportunities in Control Valve Market
Emerging opportunities include the growth of renewable energy sectors requiring advanced control solutions, the increasing demand for smart valves with integrated monitoring capabilities, and expansion into new geographic markets, especially in developing economies. The development of sustainable and energy-efficient valve designs also presents significant opportunities for innovation and market penetration.
Leading Players in the Control Valve Market Market
- Metso Corporation
- Flowserve Corporation
- Christian Burkert GmbH & Co KG
- GEA Group Aktiengesellschaft
- Emerson Electric Co
- CIRCOR International Inc
- Baker Hughes Company
- Neway Valve (Suzhou) Co Lt
- IMI PLC
Key Developments in Control Valve Market Industry
- November 2023: Emerson announced its innovative Fisher Whisper Trim Technology, enhancing its rotary and globe valve offerings.
- March 2024: Precision Pump & Valve (PPV) partnered with Beaumont Manufacturing & Distribution (BMD) to expand its reach in the oil and gas surface production market.
Strategic Outlook for Control Valve Market Market
The Control Valve market is poised for continued growth driven by technological advancements, increasing industrialization, and rising demand from key end-user sectors. Strategic investments in research and development, expansion into emerging markets, and partnerships to enhance distribution networks are crucial for sustaining growth in this competitive landscape. The focus on sustainability and energy efficiency will further shape market dynamics in the coming years.
Control Valve Market Segmentation
-
1. Type
- 1.1. Globe
- 1.2. Ball
- 1.3. Butterfly
- 1.4. Plug
- 1.5. Diaphragm
- 1.6. Other Types of Valves
-
2. End-user Industry
- 2.1. Oil and Gas
- 2.2. Chemical, Petrochemical, and Fertilizer
- 2.3. Energy and Power
- 2.4. Water and Wastewater Treatment
- 2.5. Metal and Mining
- 2.6. Other
Control Valve Market Segmentation By Geography
-
1. North America
- 1.1. United States
- 1.2. Canada
-
2. Europe
- 2.1. United Kingdom
- 2.2. Germany
- 2.3. France
- 2.4. Italy
-
3. Asia
- 3.1. China
- 3.2. Japan
- 3.3. India
- 3.4. South Korea
- 4. Australia and New Zealand
- 5. Latin America
- 6. Middle East and Africa
Control Valve Market REPORT HIGHLIGHTS
| Aspects | Details |
|---|---|
| Study Period | 2019-2033 |
| Base Year | 2024 |
| Estimated Year | 2025 |
| Forecast Period | 2025-2033 |
| Historical Period | 2019-2024 |
| Growth Rate | CAGR of 12.00% from 2019-2033 |
| Segmentation |
|
Table of Contents
- 1. Introduction
- 1.1. Research Scope
- 1.2. Market Segmentation
- 1.3. Research Methodology
- 1.4. Definitions and Assumptions
- 2. Executive Summary
- 2.1. Introduction
- 3. Market Dynamics
- 3.1. Introduction
- 3.2. Market Drivers
- 3.2.1. Growing emphasis on Power and Water and Wastewater in Emerging Markets; Focus of End Users on Environmental Issues and Refurbishment of Aging Infrastructure to Stay Competitive
- 3.3. Market Restrains
- 3.3.1. ; High Capital Investment and Increasing Use of Fiber Optic Transmission Cables; Regulatory Constraints and Limited Orbital Locations
- 3.4. Market Trends
- 3.4.1. The Oil and Gas Segment is Expected to Drive the Market
- 4. Market Factor Analysis
- 4.1. Porters Five Forces
- 4.2. Supply/Value Chain
- 4.3. PESTEL analysis
- 4.4. Market Entropy
- 4.5. Patent/Trademark Analysis
- 5. Global Control Valve Market Analysis, Insights and Forecast, 2019-2031
- 5.1. Market Analysis, Insights and Forecast - by Type
- 5.1.1. Globe
- 5.1.2. Ball
- 5.1.3. Butterfly
- 5.1.4. Plug
- 5.1.5. Diaphragm
- 5.1.6. Other Types of Valves
- 5.2. Market Analysis, Insights and Forecast - by End-user Industry
- 5.2.1. Oil and Gas
- 5.2.2. Chemical, Petrochemical, and Fertilizer
- 5.2.3. Energy and Power
- 5.2.4. Water and Wastewater Treatment
- 5.2.5. Metal and Mining
- 5.2.6. Other
- 5.3. Market Analysis, Insights and Forecast - by Region
- 5.3.1. North America
- 5.3.2. Europe
- 5.3.3. Asia
- 5.3.4. Australia and New Zealand
- 5.3.5. Latin America
- 5.3.6. Middle East and Africa
- 5.1. Market Analysis, Insights and Forecast - by Type
- 6. North America Control Valve Market Analysis, Insights and Forecast, 2019-2031
- 6.1. Market Analysis, Insights and Forecast - by Type
- 6.1.1. Globe
- 6.1.2. Ball
- 6.1.3. Butterfly
- 6.1.4. Plug
- 6.1.5. Diaphragm
- 6.1.6. Other Types of Valves
- 6.2. Market Analysis, Insights and Forecast - by End-user Industry
- 6.2.1. Oil and Gas
- 6.2.2. Chemical, Petrochemical, and Fertilizer
- 6.2.3. Energy and Power
- 6.2.4. Water and Wastewater Treatment
- 6.2.5. Metal and Mining
- 6.2.6. Other
- 6.1. Market Analysis, Insights and Forecast - by Type
- 7. Europe Control Valve Market Analysis, Insights and Forecast, 2019-2031
- 7.1. Market Analysis, Insights and Forecast - by Type
- 7.1.1. Globe
- 7.1.2. Ball
- 7.1.3. Butterfly
- 7.1.4. Plug
- 7.1.5. Diaphragm
- 7.1.6. Other Types of Valves
- 7.2. Market Analysis, Insights and Forecast - by End-user Industry
- 7.2.1. Oil and Gas
- 7.2.2. Chemical, Petrochemical, and Fertilizer
- 7.2.3. Energy and Power
- 7.2.4. Water and Wastewater Treatment
- 7.2.5. Metal and Mining
- 7.2.6. Other
- 7.1. Market Analysis, Insights and Forecast - by Type
- 8. Asia Control Valve Market Analysis, Insights and Forecast, 2019-2031
- 8.1. Market Analysis, Insights and Forecast - by Type
- 8.1.1. Globe
- 8.1.2. Ball
- 8.1.3. Butterfly
- 8.1.4. Plug
- 8.1.5. Diaphragm
- 8.1.6. Other Types of Valves
- 8.2. Market Analysis, Insights and Forecast - by End-user Industry
- 8.2.1. Oil and Gas
- 8.2.2. Chemical, Petrochemical, and Fertilizer
- 8.2.3. Energy and Power
- 8.2.4. Water and Wastewater Treatment
- 8.2.5. Metal and Mining
- 8.2.6. Other
- 8.1. Market Analysis, Insights and Forecast - by Type
- 9. Australia and New Zealand Control Valve Market Analysis, Insights and Forecast, 2019-2031
- 9.1. Market Analysis, Insights and Forecast - by Type
- 9.1.1. Globe
- 9.1.2. Ball
- 9.1.3. Butterfly
- 9.1.4. Plug
- 9.1.5. Diaphragm
- 9.1.6. Other Types of Valves
- 9.2. Market Analysis, Insights and Forecast - by End-user Industry
- 9.2.1. Oil and Gas
- 9.2.2. Chemical, Petrochemical, and Fertilizer
- 9.2.3. Energy and Power
- 9.2.4. Water and Wastewater Treatment
- 9.2.5. Metal and Mining
- 9.2.6. Other
- 9.1. Market Analysis, Insights and Forecast - by Type
- 10. Latin America Control Valve Market Analysis, Insights and Forecast, 2019-2031
- 10.1. Market Analysis, Insights and Forecast - by Type
- 10.1.1. Globe
- 10.1.2. Ball
- 10.1.3. Butterfly
- 10.1.4. Plug
- 10.1.5. Diaphragm
- 10.1.6. Other Types of Valves
- 10.2. Market Analysis, Insights and Forecast - by End-user Industry
- 10.2.1. Oil and Gas
- 10.2.2. Chemical, Petrochemical, and Fertilizer
- 10.2.3. Energy and Power
- 10.2.4. Water and Wastewater Treatment
- 10.2.5. Metal and Mining
- 10.2.6. Other
- 10.1. Market Analysis, Insights and Forecast - by Type
- 11. Middle East and Africa Control Valve Market Analysis, Insights and Forecast, 2019-2031
- 11.1. Market Analysis, Insights and Forecast - by Type
- 11.1.1. Globe
- 11.1.2. Ball
- 11.1.3. Butterfly
- 11.1.4. Plug
- 11.1.5. Diaphragm
- 11.1.6. Other Types of Valves
- 11.2. Market Analysis, Insights and Forecast - by End-user Industry
- 11.2.1. Oil and Gas
- 11.2.2. Chemical, Petrochemical, and Fertilizer
- 11.2.3. Energy and Power
- 11.2.4. Water and Wastewater Treatment
- 11.2.5. Metal and Mining
- 11.2.6. Other
- 11.1. Market Analysis, Insights and Forecast - by Type
- 12. North America Control Valve Market Analysis, Insights and Forecast, 2019-2031
- 12.1. Market Analysis, Insights and Forecast - By Country/Sub-region
- 12.1.1 United States
- 12.1.2 Canada
- 13. Europe Control Valve Market Analysis, Insights and Forecast, 2019-2031
- 13.1. Market Analysis, Insights and Forecast - By Country/Sub-region
- 13.1.1 United Kingdom
- 13.1.2 Germany
- 13.1.3 France
- 13.1.4 Italy
- 14. Asia Control Valve Market Analysis, Insights and Forecast, 2019-2031
- 14.1. Market Analysis, Insights and Forecast - By Country/Sub-region
- 14.1.1 China
- 14.1.2 Japan
- 14.1.3 India
- 14.1.4 South Korea
- 15. Australia and New Zealand Control Valve Market Analysis, Insights and Forecast, 2019-2031
- 15.1. Market Analysis, Insights and Forecast - By Country/Sub-region
- 15.1.1.
- 16. Latin America Control Valve Market Analysis, Insights and Forecast, 2019-2031
- 16.1. Market Analysis, Insights and Forecast - By Country/Sub-region
- 16.1.1.
- 17. Middle East and Africa Control Valve Market Analysis, Insights and Forecast, 2019-2031
- 17.1. Market Analysis, Insights and Forecast - By Country/Sub-region
- 17.1.1.
- 18. Competitive Analysis
- 18.1. Global Market Share Analysis 2024
- 18.2. Company Profiles
- 18.2.1 Metso Corporation
- 18.2.1.1. Overview
- 18.2.1.2. Products
- 18.2.1.3. SWOT Analysis
- 18.2.1.4. Recent Developments
- 18.2.1.5. Financials (Based on Availability)
- 18.2.2 Flowserve Corporation
- 18.2.2.1. Overview
- 18.2.2.2. Products
- 18.2.2.3. SWOT Analysis
- 18.2.2.4. Recent Developments
- 18.2.2.5. Financials (Based on Availability)
- 18.2.3 Christian Burkert GmbH & Co KG
- 18.2.3.1. Overview
- 18.2.3.2. Products
- 18.2.3.3. SWOT Analysis
- 18.2.3.4. Recent Developments
- 18.2.3.5. Financials (Based on Availability)
- 18.2.4 GEA Group Aktiengesellschaft
- 18.2.4.1. Overview
- 18.2.4.2. Products
- 18.2.4.3. SWOT Analysis
- 18.2.4.4. Recent Developments
- 18.2.4.5. Financials (Based on Availability)
- 18.2.5 Emerson Electric Co
- 18.2.5.1. Overview
- 18.2.5.2. Products
- 18.2.5.3. SWOT Analysis
- 18.2.5.4. Recent Developments
- 18.2.5.5. Financials (Based on Availability)
- 18.2.6 CIRCOR International Inc
- 18.2.6.1. Overview
- 18.2.6.2. Products
- 18.2.6.3. SWOT Analysis
- 18.2.6.4. Recent Developments
- 18.2.6.5. Financials (Based on Availability)
- 18.2.7 Baker Hughes Company
- 18.2.7.1. Overview
- 18.2.7.2. Products
- 18.2.7.3. SWOT Analysis
- 18.2.7.4. Recent Developments
- 18.2.7.5. Financials (Based on Availability)
- 18.2.8 Neway Valve (Suzhou) Co Lt
- 18.2.8.1. Overview
- 18.2.8.2. Products
- 18.2.8.3. SWOT Analysis
- 18.2.8.4. Recent Developments
- 18.2.8.5. Financials (Based on Availability)
- 18.2.9 IMI PLC
- 18.2.9.1. Overview
- 18.2.9.2. Products
- 18.2.9.3. SWOT Analysis
- 18.2.9.4. Recent Developments
- 18.2.9.5. Financials (Based on Availability)
- 18.2.1 Metso Corporation
List of Figures
- Figure 1: Global Control Valve Market Revenue Breakdown (Million, %) by Region 2024 & 2032
- Figure 2: North America Control Valve Market Revenue (Million), by Country 2024 & 2032
- Figure 3: North America Control Valve Market Revenue Share (%), by Country 2024 & 2032
- Figure 4: Europe Control Valve Market Revenue (Million), by Country 2024 & 2032
- Figure 5: Europe Control Valve Market Revenue Share (%), by Country 2024 & 2032
- Figure 6: Asia Control Valve Market Revenue (Million), by Country 2024 & 2032
- Figure 7: Asia Control Valve Market Revenue Share (%), by Country 2024 & 2032
- Figure 8: Australia and New Zealand Control Valve Market Revenue (Million), by Country 2024 & 2032
- Figure 9: Australia and New Zealand Control Valve Market Revenue Share (%), by Country 2024 & 2032
- Figure 10: Latin America Control Valve Market Revenue (Million), by Country 2024 & 2032
- Figure 11: Latin America Control Valve Market Revenue Share (%), by Country 2024 & 2032
- Figure 12: Middle East and Africa Control Valve Market Revenue (Million), by Country 2024 & 2032
- Figure 13: Middle East and Africa Control Valve Market Revenue Share (%), by Country 2024 & 2032
- Figure 14: North America Control Valve Market Revenue (Million), by Type 2024 & 2032
- Figure 15: North America Control Valve Market Revenue Share (%), by Type 2024 & 2032
- Figure 16: North America Control Valve Market Revenue (Million), by End-user Industry 2024 & 2032
- Figure 17: North America Control Valve Market Revenue Share (%), by End-user Industry 2024 & 2032
- Figure 18: North America Control Valve Market Revenue (Million), by Country 2024 & 2032
- Figure 19: North America Control Valve Market Revenue Share (%), by Country 2024 & 2032
- Figure 20: Europe Control Valve Market Revenue (Million), by Type 2024 & 2032
- Figure 21: Europe Control Valve Market Revenue Share (%), by Type 2024 & 2032
- Figure 22: Europe Control Valve Market Revenue (Million), by End-user Industry 2024 & 2032
- Figure 23: Europe Control Valve Market Revenue Share (%), by End-user Industry 2024 & 2032
- Figure 24: Europe Control Valve Market Revenue (Million), by Country 2024 & 2032
- Figure 25: Europe Control Valve Market Revenue Share (%), by Country 2024 & 2032
- Figure 26: Asia Control Valve Market Revenue (Million), by Type 2024 & 2032
- Figure 27: Asia Control Valve Market Revenue Share (%), by Type 2024 & 2032
- Figure 28: Asia Control Valve Market Revenue (Million), by End-user Industry 2024 & 2032
- Figure 29: Asia Control Valve Market Revenue Share (%), by End-user Industry 2024 & 2032
- Figure 30: Asia Control Valve Market Revenue (Million), by Country 2024 & 2032
- Figure 31: Asia Control Valve Market Revenue Share (%), by Country 2024 & 2032
- Figure 32: Australia and New Zealand Control Valve Market Revenue (Million), by Type 2024 & 2032
- Figure 33: Australia and New Zealand Control Valve Market Revenue Share (%), by Type 2024 & 2032
- Figure 34: Australia and New Zealand Control Valve Market Revenue (Million), by End-user Industry 2024 & 2032
- Figure 35: Australia and New Zealand Control Valve Market Revenue Share (%), by End-user Industry 2024 & 2032
- Figure 36: Australia and New Zealand Control Valve Market Revenue (Million), by Country 2024 & 2032
- Figure 37: Australia and New Zealand Control Valve Market Revenue Share (%), by Country 2024 & 2032
- Figure 38: Latin America Control Valve Market Revenue (Million), by Type 2024 & 2032
- Figure 39: Latin America Control Valve Market Revenue Share (%), by Type 2024 & 2032
- Figure 40: Latin America Control Valve Market Revenue (Million), by End-user Industry 2024 & 2032
- Figure 41: Latin America Control Valve Market Revenue Share (%), by End-user Industry 2024 & 2032
- Figure 42: Latin America Control Valve Market Revenue (Million), by Country 2024 & 2032
- Figure 43: Latin America Control Valve Market Revenue Share (%), by Country 2024 & 2032
- Figure 44: Middle East and Africa Control Valve Market Revenue (Million), by Type 2024 & 2032
- Figure 45: Middle East and Africa Control Valve Market Revenue Share (%), by Type 2024 & 2032
- Figure 46: Middle East and Africa Control Valve Market Revenue (Million), by End-user Industry 2024 & 2032
- Figure 47: Middle East and Africa Control Valve Market Revenue Share (%), by End-user Industry 2024 & 2032
- Figure 48: Middle East and Africa Control Valve Market Revenue (Million), by Country 2024 & 2032
- Figure 49: Middle East and Africa Control Valve Market Revenue Share (%), by Country 2024 & 2032
List of Tables
- Table 1: Global Control Valve Market Revenue Million Forecast, by Region 2019 & 2032
- Table 2: Global Control Valve Market Revenue Million Forecast, by Type 2019 & 2032
- Table 3: Global Control Valve Market Revenue Million Forecast, by End-user Industry 2019 & 2032
- Table 4: Global Control Valve Market Revenue Million Forecast, by Region 2019 & 2032
- Table 5: Global Control Valve Market Revenue Million Forecast, by Country 2019 & 2032
- Table 6: United States Control Valve Market Revenue (Million) Forecast, by Application 2019 & 2032
- Table 7: Canada Control Valve Market Revenue (Million) Forecast, by Application 2019 & 2032
- Table 8: Global Control Valve Market Revenue Million Forecast, by Country 2019 & 2032
- Table 9: United Kingdom Control Valve Market Revenue (Million) Forecast, by Application 2019 & 2032
- Table 10: Germany Control Valve Market Revenue (Million) Forecast, by Application 2019 & 2032
- Table 11: France Control Valve Market Revenue (Million) Forecast, by Application 2019 & 2032
- Table 12: Italy Control Valve Market Revenue (Million) Forecast, by Application 2019 & 2032
- Table 13: Global Control Valve Market Revenue Million Forecast, by Country 2019 & 2032
- Table 14: China Control Valve Market Revenue (Million) Forecast, by Application 2019 & 2032
- Table 15: Japan Control Valve Market Revenue (Million) Forecast, by Application 2019 & 2032
- Table 16: India Control Valve Market Revenue (Million) Forecast, by Application 2019 & 2032
- Table 17: South Korea Control Valve Market Revenue (Million) Forecast, by Application 2019 & 2032
- Table 18: Global Control Valve Market Revenue Million Forecast, by Country 2019 & 2032
- Table 19: Control Valve Market Revenue (Million) Forecast, by Application 2019 & 2032
- Table 20: Global Control Valve Market Revenue Million Forecast, by Country 2019 & 2032
- Table 21: Control Valve Market Revenue (Million) Forecast, by Application 2019 & 2032
- Table 22: Global Control Valve Market Revenue Million Forecast, by Country 2019 & 2032
- Table 23: Control Valve Market Revenue (Million) Forecast, by Application 2019 & 2032
- Table 24: Global Control Valve Market Revenue Million Forecast, by Type 2019 & 2032
- Table 25: Global Control Valve Market Revenue Million Forecast, by End-user Industry 2019 & 2032
- Table 26: Global Control Valve Market Revenue Million Forecast, by Country 2019 & 2032
- Table 27: United States Control Valve Market Revenue (Million) Forecast, by Application 2019 & 2032
- Table 28: Canada Control Valve Market Revenue (Million) Forecast, by Application 2019 & 2032
- Table 29: Global Control Valve Market Revenue Million Forecast, by Type 2019 & 2032
- Table 30: Global Control Valve Market Revenue Million Forecast, by End-user Industry 2019 & 2032
- Table 31: Global Control Valve Market Revenue Million Forecast, by Country 2019 & 2032
- Table 32: United Kingdom Control Valve Market Revenue (Million) Forecast, by Application 2019 & 2032
- Table 33: Germany Control Valve Market Revenue (Million) Forecast, by Application 2019 & 2032
- Table 34: France Control Valve Market Revenue (Million) Forecast, by Application 2019 & 2032
- Table 35: Italy Control Valve Market Revenue (Million) Forecast, by Application 2019 & 2032
- Table 36: Global Control Valve Market Revenue Million Forecast, by Type 2019 & 2032
- Table 37: Global Control Valve Market Revenue Million Forecast, by End-user Industry 2019 & 2032
- Table 38: Global Control Valve Market Revenue Million Forecast, by Country 2019 & 2032
- Table 39: China Control Valve Market Revenue (Million) Forecast, by Application 2019 & 2032
- Table 40: Japan Control Valve Market Revenue (Million) Forecast, by Application 2019 & 2032
- Table 41: India Control Valve Market Revenue (Million) Forecast, by Application 2019 & 2032
- Table 42: South Korea Control Valve Market Revenue (Million) Forecast, by Application 2019 & 2032
- Table 43: Global Control Valve Market Revenue Million Forecast, by Type 2019 & 2032
- Table 44: Global Control Valve Market Revenue Million Forecast, by End-user Industry 2019 & 2032
- Table 45: Global Control Valve Market Revenue Million Forecast, by Country 2019 & 2032
- Table 46: Global Control Valve Market Revenue Million Forecast, by Type 2019 & 2032
- Table 47: Global Control Valve Market Revenue Million Forecast, by End-user Industry 2019 & 2032
- Table 48: Global Control Valve Market Revenue Million Forecast, by Country 2019 & 2032
- Table 49: Global Control Valve Market Revenue Million Forecast, by Type 2019 & 2032
- Table 50: Global Control Valve Market Revenue Million Forecast, by End-user Industry 2019 & 2032
- Table 51: Global Control Valve Market Revenue Million Forecast, by Country 2019 & 2032
Frequently Asked Questions
1. What is the projected Compound Annual Growth Rate (CAGR) of the Control Valve Market?
The projected CAGR is approximately 12.00%.
2. Which companies are prominent players in the Control Valve Market?
Key companies in the market include Metso Corporation, Flowserve Corporation, Christian Burkert GmbH & Co KG, GEA Group Aktiengesellschaft, Emerson Electric Co, CIRCOR International Inc, Baker Hughes Company, Neway Valve (Suzhou) Co Lt, IMI PLC.
3. What are the main segments of the Control Valve Market?
The market segments include Type, End-user Industry.
4. Can you provide details about the market size?
The market size is estimated to be USD 7.43 Million as of 2022.
5. What are some drivers contributing to market growth?
Growing emphasis on Power and Water and Wastewater in Emerging Markets; Focus of End Users on Environmental Issues and Refurbishment of Aging Infrastructure to Stay Competitive.
6. What are the notable trends driving market growth?
The Oil and Gas Segment is Expected to Drive the Market.
7. Are there any restraints impacting market growth?
; High Capital Investment and Increasing Use of Fiber Optic Transmission Cables; Regulatory Constraints and Limited Orbital Locations.
8. Can you provide examples of recent developments in the market?
March 2024: Precision Pump & Valve ("PPV") announced a partnership with Beaumont Manufacturing & Distribution ("BMD"). The new partnership will allow PPV to further serve customers in the oil and gas surface production market, including midstream and upstream users, fabrication shops, and others. The partnership will allow PPV to provide all BMD products to oil producers across the United States.
9. What pricing options are available for accessing the report?
Pricing options include single-user, multi-user, and enterprise licenses priced at USD 4750, USD 5250, and USD 8750 respectively.
10. Is the market size provided in terms of value or volume?
The market size is provided in terms of value, measured in Million.
11. Are there any specific market keywords associated with the report?
Yes, the market keyword associated with the report is "Control Valve Market," which aids in identifying and referencing the specific market segment covered.
12. How do I determine which pricing option suits my needs best?
The pricing options vary based on user requirements and access needs. Individual users may opt for single-user licenses, while businesses requiring broader access may choose multi-user or enterprise licenses for cost-effective access to the report.
13. Are there any additional resources or data provided in the Control Valve Market report?
While the report offers comprehensive insights, it's advisable to review the specific contents or supplementary materials provided to ascertain if additional resources or data are available.
14. How can I stay updated on further developments or reports in the Control Valve Market?
To stay informed about further developments, trends, and reports in the Control Valve Market, consider subscribing to industry newsletters, following relevant companies and organizations, or regularly checking reputable industry news sources and publications.
Methodology
Step 1 - Identification of Relevant Samples Size from Population Database


Step 2 - Approaches for Defining Global Market Size (Value, Volume* & Price*)

Note*: In applicable scenarios
Step 3 - Data Sources
Primary Research
- Web Analytics
- Survey Reports
- Research Institute
- Latest Research Reports
- Opinion Leaders
Secondary Research
- Annual Reports
- White Paper
- Latest Press Release
- Industry Association
- Paid Database
- Investor Presentations

Step 4 - Data Triangulation
Involves using different sources of information in order to increase the validity of a study
These sources are likely to be stakeholders in a program - participants, other researchers, program staff, other community members, and so on.
Then we put all data in single framework & apply various statistical tools to find out the dynamic on the market.
During the analysis stage, feedback from the stakeholder groups would be compared to determine areas of agreement as well as areas of divergence


