
Key Insights
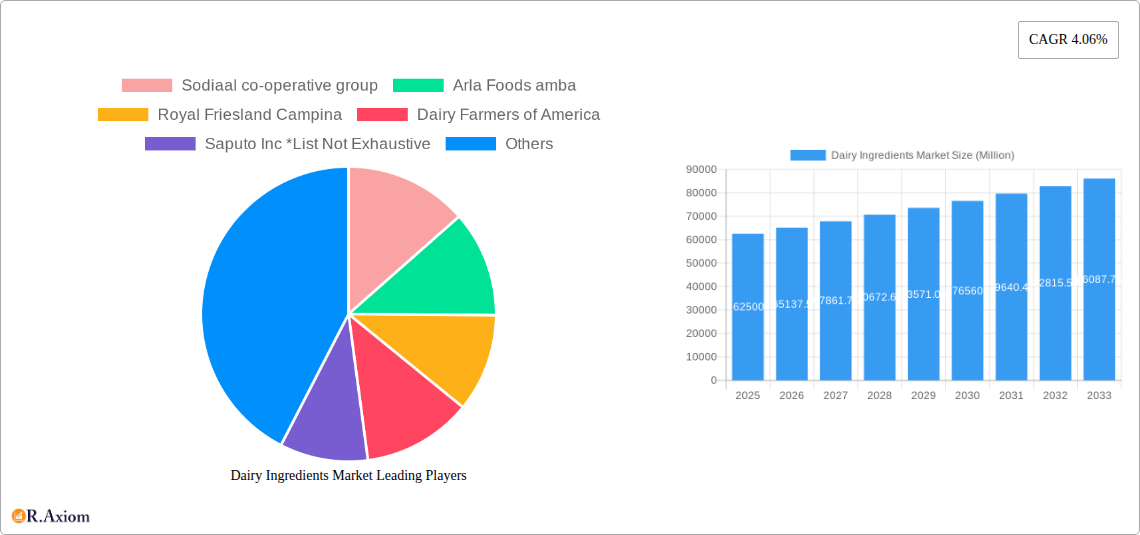
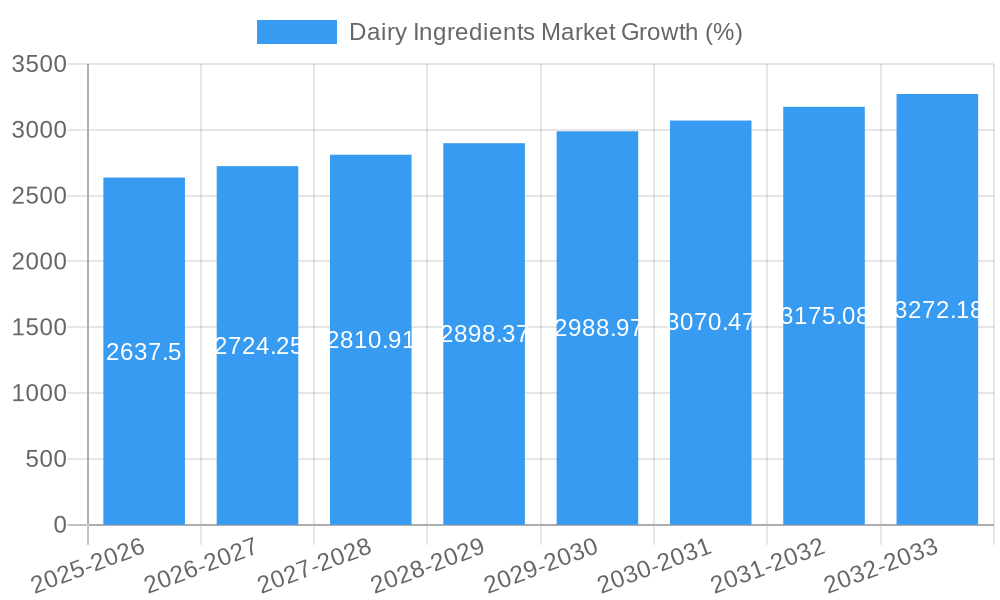
The global dairy ingredients market, valued at $62.50 billion in 2025, is projected to experience steady growth, exhibiting a Compound Annual Growth Rate (CAGR) of 4.06% from 2025 to 2033. This growth is driven by several key factors. The increasing demand for convenient and nutritious food products fuels the consumption of dairy ingredients across various applications, particularly in the bakery and confectionery, dairy products, and infant formula sectors. The rising global population and increasing disposable incomes in developing economies further contribute to market expansion. Health and wellness trends are also playing a significant role, with consumers increasingly seeking products with added protein and functional benefits, leading to a greater demand for whey protein isolates and concentrates. Innovation in dairy ingredient processing technologies enhances product quality and functionality, attracting new applications and boosting market growth. While supply chain disruptions and fluctuations in milk prices can pose challenges, the overall market outlook remains positive due to the consistent demand and ongoing product diversification.
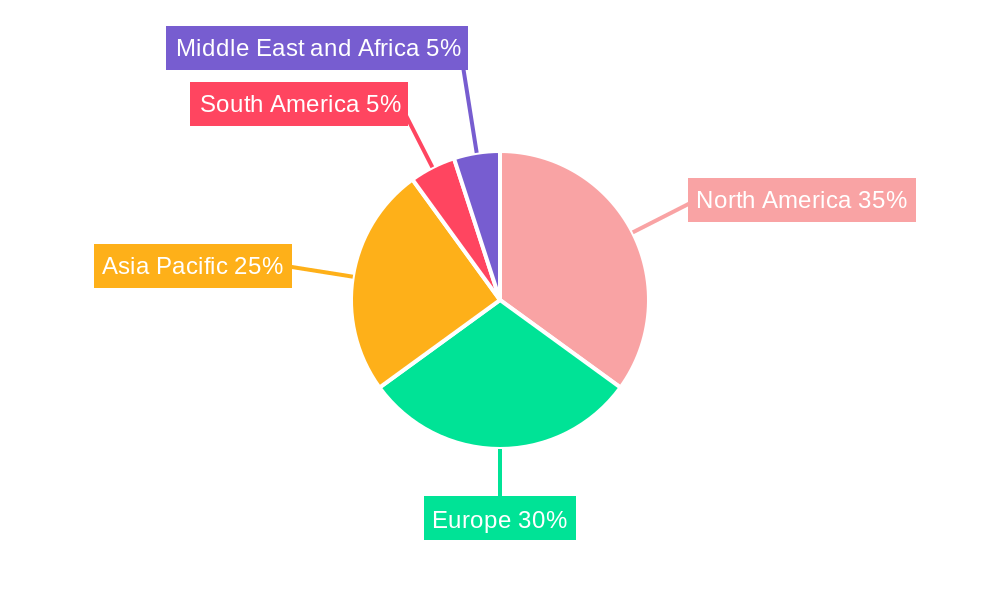
The market segmentation reveals a diverse landscape. Hydrolyzed whey protein (HWP), lactose, and casein derivatives dominate the ingredient segment, reflecting their widespread use in various applications. The application segment is led by bakery and confectionery, driven by the rising popularity of convenience foods and processed snacks. The sports and clinical nutrition sector demonstrates significant growth potential due to increasing health consciousness. Geographical distribution shows North America and Europe holding substantial market shares, reflecting established dairy industries and high per capita consumption. However, the Asia-Pacific region is anticipated to exhibit the fastest growth rate, driven by rapid urbanization, increasing consumer spending, and changing dietary habits. Key players like Sodiaal, Arla Foods, and Fonterra are consolidating their market positions through strategic partnerships, acquisitions, and product innovations, shaping the competitive dynamics of this evolving market.
Dairy Ingredients Market: A Comprehensive Report (2019-2033)
This in-depth report provides a comprehensive analysis of the Dairy Ingredients Market, covering the period 2019-2033, with a focus on market trends, growth drivers, competitive landscape, and future outlook. The report uses 2025 as its base year and offers valuable insights for industry stakeholders, including manufacturers, suppliers, distributors, and investors. The market is projected to reach xx Million by 2033, exhibiting a CAGR of xx% during the forecast period (2025-2033).
Dairy Ingredients Market Market Concentration & Innovation
The global dairy ingredients market is moderately concentrated, with several major players holding significant market share. Sodiaal co-operative group, Arla Foods amba, Royal Friesland Campina, Dairy Farmers of America, and Saputo Inc. are among the leading companies, though the market also includes numerous smaller, specialized firms like Kerry Group PLC, Volac International Ltd, Fonterra Co-Operative Group Limited, Groupe Lactalis, Hoogwegt International BV, and Kanegrade Ltd. Precise market share data for each company varies depending on the specific ingredient and region, but competitive dynamics are intense.
Innovation is a key driver in this market, fueled by the demand for functional ingredients, improved processing technologies, and the development of sustainable and ethically sourced products. Regulatory frameworks, particularly concerning food safety and labeling, significantly influence market dynamics. The presence of substitutes, such as plant-based alternatives, creates competitive pressure. End-user trends, such as the growing demand for convenience foods and healthier options, are shaping product development. Mergers and acquisitions (M&A) activity has been relatively high in recent years, with deal values ranging from xx Million to xx Million, reflecting consolidation within the industry and efforts to expand product portfolios.
- Market Concentration: Moderately concentrated, with a few dominant players and numerous smaller firms.
- Innovation Drivers: Functional ingredients, sustainable sourcing, improved processing.
- Regulatory Frameworks: Stringent food safety and labeling regulations impacting market dynamics.
- Product Substitutes: Plant-based alternatives posing competitive pressure.
- End-User Trends: Demand for convenience and healthier foods driving innovation.
- M&A Activity: Significant M&A activity with deal values ranging from xx Million to xx Million.
Dairy Ingredients Market Industry Trends & Insights
The dairy ingredients market is witnessing robust growth driven by several factors. The rising global population and increasing disposable incomes, particularly in developing economies, are boosting demand for dairy products, which in turn fuels the market for dairy ingredients. Technological advancements in processing and formulation are enabling the development of novel dairy ingredients with enhanced functionality, improved shelf life, and tailored nutritional profiles. Consumer preferences are shifting towards healthier and more convenient food options, creating demand for dairy ingredients that cater to these preferences, for example, high-protein dairy ingredients for sports nutrition or lactose-free options. Furthermore, the growing awareness of the health benefits of dairy products is driving consumption, further expanding the market. The competitive landscape is characterized by both intense competition and collaborations, with companies investing heavily in research and development, capacity expansion, and strategic partnerships to gain a competitive edge. The market is expected to witness a significant expansion in the coming years, with a projected CAGR of xx%. Market penetration rates vary considerably across different dairy ingredients and geographical regions, but overall, the market exhibits significant growth potential.
Dominant Markets & Segments in Dairy Ingredients Market
The dairy ingredients market shows significant regional variations in dominance. While precise figures are proprietary, regions like North America and Europe currently hold a substantial share, owing to their high dairy consumption and advanced food processing industries. However, emerging economies in Asia-Pacific and Latin America are experiencing rapid growth, driven by increasing disposable incomes and changing dietary habits. Within segments, Whey Ingredients (including Whey Protein Concentrates and Isolates) and Milk Powders (including Whole Milk Powders) command substantial shares, reflecting their widespread applications across various food and beverage categories. The Infant Milk Formula application segment demonstrates strong growth, driven by rising birth rates and increasing demand for specialized infant nutrition products.
- Leading Regions: North America and Europe hold significant market share, with Asia-Pacific and Latin America showing rapid growth.
- Key Drivers for Leading Regions:
- North America & Europe: Established dairy industry, advanced processing technologies, high dairy consumption.
- Asia-Pacific & Latin America: Rising disposable incomes, increasing population, changing dietary habits.
- Dominant Segments: Whey Ingredients and Milk Powders hold largest market shares due to wide applications.
- High-Growth Segments: Infant Milk Formula segment demonstrates rapid expansion due to high demand.
Further Segmentation Analysis:
- By Type: Milk Powders (Whole Milk Powders, Skim Milk Powders), Whey Ingredients (Whey Protein Concentrates, Whey Protein Isolates, Whey Permeate), Casein and Caseinates, Lactose and Derivatives, Other Types.
- By Application: Bakery and Confectionery, Dairy Products, Infant Milk Formula, Sports and Clinical Nutrition, Other Applications.
- By Hydrolyzed Whey Protein (HWP): This specific segment shows notable growth based on functional properties.
Dairy Ingredients Market Product Developments
Recent years have witnessed significant product innovations in the dairy ingredients market. Companies are focusing on developing functional dairy ingredients with enhanced nutritional profiles, improved processing properties, and extended shelf life. This includes the development of specialized whey proteins for sports nutrition, lactose-free dairy ingredients for consumers with lactose intolerance, and tailored ingredients for specific food applications. Technological advancements such as membrane filtration, enzymatic hydrolysis, and microencapsulation are being utilized to improve product quality and functionality. These innovations allow for creating ingredients that better meet the evolving needs and preferences of consumers and food manufacturers, driving market growth and competitiveness.
Report Scope & Segmentation Analysis
This report offers a granular view of the dairy ingredients market, segmented by type (Milk Powders, Whey Ingredients, Casein and Caseinates, Lactose and Derivatives, Other Types), application (Bakery and Confectionery, Dairy Products, Infant Milk Formula, Sports and Clinical Nutrition, Other Applications), and geography. Each segment's growth projection, market size, and competitive landscape are detailed, allowing for a thorough understanding of the market's structure and future trajectory. For example, the Whey Ingredients segment is projected to grow at xx% CAGR, while the Infant Milk Formula application segment is expected to show a higher growth rate of xx% CAGR due to specific market drivers. Competitive dynamics within each segment vary, with some exhibiting high levels of competition and others characterized by niche players.
Key Drivers of Dairy Ingredients Market Growth
Several factors contribute to the growth of the dairy ingredients market. Technological advancements in processing and formulation lead to improved product quality and functionality, meeting diverse consumer demands. The rising global population and increasing disposable incomes are expanding the market for dairy products, consequently driving demand for ingredients. Favorable economic conditions and government support for the dairy industry in various regions also support growth. Furthermore, increasing awareness of the health benefits of dairy products is fueling consumption and strengthening the market.
Challenges in the Dairy Ingredients Market Sector
The dairy ingredients market faces several challenges. Fluctuations in milk production and prices create supply chain volatility, impacting ingredient availability and costs. Stringent food safety and labeling regulations add complexity and increase compliance costs. Intense competition among established players and the emergence of plant-based alternatives put pressure on pricing and profitability. These factors can impact the overall growth trajectory and require companies to implement robust strategies for risk management and cost optimization.
Emerging Opportunities in Dairy Ingredients Market
Several opportunities exist in the dairy ingredients market. The increasing demand for functional foods and beverages opens avenues for developing specialized dairy ingredients with added health benefits. The rise of personalized nutrition and customized food products creates a demand for specialized dairy ingredients. The growing interest in sustainable and ethically sourced dairy products presents opportunities for companies committed to responsible practices. Expansion into emerging markets with high growth potential and the development of innovative products tailored to regional preferences can lead to significant market penetration.
Leading Players in the Dairy Ingredients Market Market
- Sodiaal co-operative group
- Arla Foods amba
- Royal Friesland Campina
- Dairy Farmers of America
- Saputo Inc
- Kerry Group PLC
- Volac International Ltd
- Fonterra Co-Operative Group Limited
- Groupe Lactalis
- Hoogwegt International BV
- Kanegrade Ltd
Key Developments in Dairy Ingredients Market Industry
- July 2022: NZMP, Fonterra's global ingredient business, launched Pro-OptimaTM, a grade A functional whey protein concentrate (fWPC), through a joint venture, expanding its product portfolio and market reach.
- May 2022: Arla Foods invested EUR 190 Million to expand its Pronsfeld Dairy in Germany, increasing milk powder production capacity to meet growing international demand. This significant investment highlights the growing demand for dairy products and the company's commitment to meeting this demand.
- May 2022: Fonterra launched myNZMP, a new online platform to enhance customer experience and streamline ingredient ordering, improving convenience and accessibility for its customers.
Strategic Outlook for Dairy Ingredients Market Market
The future of the dairy ingredients market appears bright, driven by continuous innovation, increasing health consciousness, and expanding global demand. Opportunities lie in developing specialized ingredients catering to specific dietary needs and health trends. Companies focusing on sustainability and ethical sourcing will gain a competitive advantage. Strategic partnerships and acquisitions will likely continue shaping the market landscape. The market's long-term potential remains substantial, with consistent growth projected for the foreseeable future.
Dairy Ingredients Market Segmentation
- 1. Production Analysis
- 2. Consumption Analysis
- 3. Import Market Analysis (Value & Volume)
- 4. Export Market Analysis (Value & Volume)
- 5. Price Trend Analysis
Dairy Ingredients Market Segmentation By Geography
-
1. North America
- 1.1. United States
- 1.2. Canada
- 1.3. Mexico
- 1.4. Rest of North America
-
2. Europe
- 2.1. United Kingdom
- 2.2. Germany
- 2.3. France
- 2.4. Russia
- 2.5. Italy
- 2.6. Spain
- 2.7. Rest of Europe
-
3. Asia Pacific
- 3.1. India
- 3.2. China
- 3.3. Japan
- 3.4. Australia
- 3.5. Rest of Asia Pacific
-
4. South America
- 4.1. Brazil
- 4.2. Argentina
- 4.3. Rest of South America
-
5. Middle East and Africa
- 5.1. United Arab Emirates
- 5.2. South Africa
- 5.3. Rest of Middle East and Africa
Dairy Ingredients Market REPORT HIGHLIGHTS
| Aspects | Details |
|---|---|
| Study Period | 2019-2033 |
| Base Year | 2024 |
| Estimated Year | 2025 |
| Forecast Period | 2025-2033 |
| Historical Period | 2019-2024 |
| Growth Rate | CAGR of 4.06% from 2019-2033 |
| Segmentation |
|
Table of Contents
- 1. Introduction
- 1.1. Research Scope
- 1.2. Market Segmentation
- 1.3. Research Methodology
- 1.4. Definitions and Assumptions
- 2. Executive Summary
- 2.1. Introduction
- 3. Market Dynamics
- 3.1. Introduction
- 3.2. Market Drivers
- 3.2.1. Increasing demand for sports nutritional supplements
- 3.3. Market Restrains
- 3.3.1. Rising demand for plant-based protein
- 3.4. Market Trends
- 3.4.1. Increasing Milk Production Supporting the Demand for Dairy Ingredients
- 4. Market Factor Analysis
- 4.1. Porters Five Forces
- 4.2. Supply/Value Chain
- 4.3. PESTEL analysis
- 4.4. Market Entropy
- 4.5. Patent/Trademark Analysis
- 5. Global Dairy Ingredients Market Analysis, Insights and Forecast, 2019-2031
- 5.1. Market Analysis, Insights and Forecast - by Production Analysis
- 5.2. Market Analysis, Insights and Forecast - by Consumption Analysis
- 5.3. Market Analysis, Insights and Forecast - by Import Market Analysis (Value & Volume)
- 5.4. Market Analysis, Insights and Forecast - by Export Market Analysis (Value & Volume)
- 5.5. Market Analysis, Insights and Forecast - by Price Trend Analysis
- 5.6. Market Analysis, Insights and Forecast - by Region
- 5.6.1. North America
- 5.6.2. Europe
- 5.6.3. Asia Pacific
- 5.6.4. South America
- 5.6.5. Middle East and Africa
- 5.1. Market Analysis, Insights and Forecast - by Production Analysis
- 6. North America Dairy Ingredients Market Analysis, Insights and Forecast, 2019-2031
- 6.1. Market Analysis, Insights and Forecast - by Production Analysis
- 6.2. Market Analysis, Insights and Forecast - by Consumption Analysis
- 6.3. Market Analysis, Insights and Forecast - by Import Market Analysis (Value & Volume)
- 6.4. Market Analysis, Insights and Forecast - by Export Market Analysis (Value & Volume)
- 6.5. Market Analysis, Insights and Forecast - by Price Trend Analysis
- 6.1. Market Analysis, Insights and Forecast - by Production Analysis
- 7. Europe Dairy Ingredients Market Analysis, Insights and Forecast, 2019-2031
- 7.1. Market Analysis, Insights and Forecast - by Production Analysis
- 7.2. Market Analysis, Insights and Forecast - by Consumption Analysis
- 7.3. Market Analysis, Insights and Forecast - by Import Market Analysis (Value & Volume)
- 7.4. Market Analysis, Insights and Forecast - by Export Market Analysis (Value & Volume)
- 7.5. Market Analysis, Insights and Forecast - by Price Trend Analysis
- 7.1. Market Analysis, Insights and Forecast - by Production Analysis
- 8. Asia Pacific Dairy Ingredients Market Analysis, Insights and Forecast, 2019-2031
- 8.1. Market Analysis, Insights and Forecast - by Production Analysis
- 8.2. Market Analysis, Insights and Forecast - by Consumption Analysis
- 8.3. Market Analysis, Insights and Forecast - by Import Market Analysis (Value & Volume)
- 8.4. Market Analysis, Insights and Forecast - by Export Market Analysis (Value & Volume)
- 8.5. Market Analysis, Insights and Forecast - by Price Trend Analysis
- 8.1. Market Analysis, Insights and Forecast - by Production Analysis
- 9. South America Dairy Ingredients Market Analysis, Insights and Forecast, 2019-2031
- 9.1. Market Analysis, Insights and Forecast - by Production Analysis
- 9.2. Market Analysis, Insights and Forecast - by Consumption Analysis
- 9.3. Market Analysis, Insights and Forecast - by Import Market Analysis (Value & Volume)
- 9.4. Market Analysis, Insights and Forecast - by Export Market Analysis (Value & Volume)
- 9.5. Market Analysis, Insights and Forecast - by Price Trend Analysis
- 9.1. Market Analysis, Insights and Forecast - by Production Analysis
- 10. Middle East and Africa Dairy Ingredients Market Analysis, Insights and Forecast, 2019-2031
- 10.1. Market Analysis, Insights and Forecast - by Production Analysis
- 10.2. Market Analysis, Insights and Forecast - by Consumption Analysis
- 10.3. Market Analysis, Insights and Forecast - by Import Market Analysis (Value & Volume)
- 10.4. Market Analysis, Insights and Forecast - by Export Market Analysis (Value & Volume)
- 10.5. Market Analysis, Insights and Forecast - by Price Trend Analysis
- 10.1. Market Analysis, Insights and Forecast - by Production Analysis
- 11. North America Dairy Ingredients Market Analysis, Insights and Forecast, 2019-2031
- 11.1. Market Analysis, Insights and Forecast - By Country/Sub-region
- 11.1.1 United States
- 11.1.2 Canada
- 11.1.3 Mexico
- 11.1.4 Rest of North America
- 12. Europe Dairy Ingredients Market Analysis, Insights and Forecast, 2019-2031
- 12.1. Market Analysis, Insights and Forecast - By Country/Sub-region
- 12.1.1 United Kingdom
- 12.1.2 Germany
- 12.1.3 France
- 12.1.4 Russia
- 12.1.5 Italy
- 12.1.6 Spain
- 12.1.7 Rest of Europe
- 13. Asia Pacific Dairy Ingredients Market Analysis, Insights and Forecast, 2019-2031
- 13.1. Market Analysis, Insights and Forecast - By Country/Sub-region
- 13.1.1 India
- 13.1.2 China
- 13.1.3 Japan
- 13.1.4 Australia
- 13.1.5 Rest of Asia Pacific
- 14. South America Dairy Ingredients Market Analysis, Insights and Forecast, 2019-2031
- 14.1. Market Analysis, Insights and Forecast - By Country/Sub-region
- 14.1.1 Brazil
- 14.1.2 Argentina
- 14.1.3 Rest of South America
- 15. Middle East and Africa Dairy Ingredients Market Analysis, Insights and Forecast, 2019-2031
- 15.1. Market Analysis, Insights and Forecast - By Country/Sub-region
- 15.1.1 United Arab Emirates
- 15.1.2 South Africa
- 15.1.3 Rest of Middle East and Africa
- 16. Competitive Analysis
- 16.1. Global Market Share Analysis 2024
- 16.2. Company Profiles
- 16.2.1 Sodiaal co-operative group
- 16.2.1.1. Overview
- 16.2.1.2. Products
- 16.2.1.3. SWOT Analysis
- 16.2.1.4. Recent Developments
- 16.2.1.5. Financials (Based on Availability)
- 16.2.2 Arla Foods amba
- 16.2.2.1. Overview
- 16.2.2.2. Products
- 16.2.2.3. SWOT Analysis
- 16.2.2.4. Recent Developments
- 16.2.2.5. Financials (Based on Availability)
- 16.2.3 Royal Friesland Campina
- 16.2.3.1. Overview
- 16.2.3.2. Products
- 16.2.3.3. SWOT Analysis
- 16.2.3.4. Recent Developments
- 16.2.3.5. Financials (Based on Availability)
- 16.2.4 Dairy Farmers of America
- 16.2.4.1. Overview
- 16.2.4.2. Products
- 16.2.4.3. SWOT Analysis
- 16.2.4.4. Recent Developments
- 16.2.4.5. Financials (Based on Availability)
- 16.2.5 Saputo Inc *List Not Exhaustive
- 16.2.5.1. Overview
- 16.2.5.2. Products
- 16.2.5.3. SWOT Analysis
- 16.2.5.4. Recent Developments
- 16.2.5.5. Financials (Based on Availability)
- 16.2.6 Kerry Group PLC
- 16.2.6.1. Overview
- 16.2.6.2. Products
- 16.2.6.3. SWOT Analysis
- 16.2.6.4. Recent Developments
- 16.2.6.5. Financials (Based on Availability)
- 16.2.7 Volac International Ltd
- 16.2.7.1. Overview
- 16.2.7.2. Products
- 16.2.7.3. SWOT Analysis
- 16.2.7.4. Recent Developments
- 16.2.7.5. Financials (Based on Availability)
- 16.2.8 Fonterra Co-Operative Group Limited
- 16.2.8.1. Overview
- 16.2.8.2. Products
- 16.2.8.3. SWOT Analysis
- 16.2.8.4. Recent Developments
- 16.2.8.5. Financials (Based on Availability)
- 16.2.9 Groupe Lactalis
- 16.2.9.1. Overview
- 16.2.9.2. Products
- 16.2.9.3. SWOT Analysis
- 16.2.9.4. Recent Developments
- 16.2.9.5. Financials (Based on Availability)
- 16.2.10 Hoogwegt International BV
- 16.2.10.1. Overview
- 16.2.10.2. Products
- 16.2.10.3. SWOT Analysis
- 16.2.10.4. Recent Developments
- 16.2.10.5. Financials (Based on Availability)
- 16.2.11 Kanegrade Ltd
- 16.2.11.1. Overview
- 16.2.11.2. Products
- 16.2.11.3. SWOT Analysis
- 16.2.11.4. Recent Developments
- 16.2.11.5. Financials (Based on Availability)
- 16.2.1 Sodiaal co-operative group
List of Figures
- Figure 1: Global Dairy Ingredients Market Revenue Breakdown (Million, %) by Region 2024 & 2032
- Figure 2: Global Dairy Ingredients Market Volume Breakdown (K Tons, %) by Region 2024 & 2032
- Figure 3: North America Dairy Ingredients Market Revenue (Million), by Country 2024 & 2032
- Figure 4: North America Dairy Ingredients Market Volume (K Tons), by Country 2024 & 2032
- Figure 5: North America Dairy Ingredients Market Revenue Share (%), by Country 2024 & 2032
- Figure 6: North America Dairy Ingredients Market Volume Share (%), by Country 2024 & 2032
- Figure 7: Europe Dairy Ingredients Market Revenue (Million), by Country 2024 & 2032
- Figure 8: Europe Dairy Ingredients Market Volume (K Tons), by Country 2024 & 2032
- Figure 9: Europe Dairy Ingredients Market Revenue Share (%), by Country 2024 & 2032
- Figure 10: Europe Dairy Ingredients Market Volume Share (%), by Country 2024 & 2032
- Figure 11: Asia Pacific Dairy Ingredients Market Revenue (Million), by Country 2024 & 2032
- Figure 12: Asia Pacific Dairy Ingredients Market Volume (K Tons), by Country 2024 & 2032
- Figure 13: Asia Pacific Dairy Ingredients Market Revenue Share (%), by Country 2024 & 2032
- Figure 14: Asia Pacific Dairy Ingredients Market Volume Share (%), by Country 2024 & 2032
- Figure 15: South America Dairy Ingredients Market Revenue (Million), by Country 2024 & 2032
- Figure 16: South America Dairy Ingredients Market Volume (K Tons), by Country 2024 & 2032
- Figure 17: South America Dairy Ingredients Market Revenue Share (%), by Country 2024 & 2032
- Figure 18: South America Dairy Ingredients Market Volume Share (%), by Country 2024 & 2032
- Figure 19: Middle East and Africa Dairy Ingredients Market Revenue (Million), by Country 2024 & 2032
- Figure 20: Middle East and Africa Dairy Ingredients Market Volume (K Tons), by Country 2024 & 2032
- Figure 21: Middle East and Africa Dairy Ingredients Market Revenue Share (%), by Country 2024 & 2032
- Figure 22: Middle East and Africa Dairy Ingredients Market Volume Share (%), by Country 2024 & 2032
- Figure 23: North America Dairy Ingredients Market Revenue (Million), by Production Analysis 2024 & 2032
- Figure 24: North America Dairy Ingredients Market Volume (K Tons), by Production Analysis 2024 & 2032
- Figure 25: North America Dairy Ingredients Market Revenue Share (%), by Production Analysis 2024 & 2032
- Figure 26: North America Dairy Ingredients Market Volume Share (%), by Production Analysis 2024 & 2032
- Figure 27: North America Dairy Ingredients Market Revenue (Million), by Consumption Analysis 2024 & 2032
- Figure 28: North America Dairy Ingredients Market Volume (K Tons), by Consumption Analysis 2024 & 2032
- Figure 29: North America Dairy Ingredients Market Revenue Share (%), by Consumption Analysis 2024 & 2032
- Figure 30: North America Dairy Ingredients Market Volume Share (%), by Consumption Analysis 2024 & 2032
- Figure 31: North America Dairy Ingredients Market Revenue (Million), by Import Market Analysis (Value & Volume) 2024 & 2032
- Figure 32: North America Dairy Ingredients Market Volume (K Tons), by Import Market Analysis (Value & Volume) 2024 & 2032
- Figure 33: North America Dairy Ingredients Market Revenue Share (%), by Import Market Analysis (Value & Volume) 2024 & 2032
- Figure 34: North America Dairy Ingredients Market Volume Share (%), by Import Market Analysis (Value & Volume) 2024 & 2032
- Figure 35: North America Dairy Ingredients Market Revenue (Million), by Export Market Analysis (Value & Volume) 2024 & 2032
- Figure 36: North America Dairy Ingredients Market Volume (K Tons), by Export Market Analysis (Value & Volume) 2024 & 2032
- Figure 37: North America Dairy Ingredients Market Revenue Share (%), by Export Market Analysis (Value & Volume) 2024 & 2032
- Figure 38: North America Dairy Ingredients Market Volume Share (%), by Export Market Analysis (Value & Volume) 2024 & 2032
- Figure 39: North America Dairy Ingredients Market Revenue (Million), by Price Trend Analysis 2024 & 2032
- Figure 40: North America Dairy Ingredients Market Volume (K Tons), by Price Trend Analysis 2024 & 2032
- Figure 41: North America Dairy Ingredients Market Revenue Share (%), by Price Trend Analysis 2024 & 2032
- Figure 42: North America Dairy Ingredients Market Volume Share (%), by Price Trend Analysis 2024 & 2032
- Figure 43: North America Dairy Ingredients Market Revenue (Million), by Country 2024 & 2032
- Figure 44: North America Dairy Ingredients Market Volume (K Tons), by Country 2024 & 2032
- Figure 45: North America Dairy Ingredients Market Revenue Share (%), by Country 2024 & 2032
- Figure 46: North America Dairy Ingredients Market Volume Share (%), by Country 2024 & 2032
- Figure 47: Europe Dairy Ingredients Market Revenue (Million), by Production Analysis 2024 & 2032
- Figure 48: Europe Dairy Ingredients Market Volume (K Tons), by Production Analysis 2024 & 2032
- Figure 49: Europe Dairy Ingredients Market Revenue Share (%), by Production Analysis 2024 & 2032
- Figure 50: Europe Dairy Ingredients Market Volume Share (%), by Production Analysis 2024 & 2032
- Figure 51: Europe Dairy Ingredients Market Revenue (Million), by Consumption Analysis 2024 & 2032
- Figure 52: Europe Dairy Ingredients Market Volume (K Tons), by Consumption Analysis 2024 & 2032
- Figure 53: Europe Dairy Ingredients Market Revenue Share (%), by Consumption Analysis 2024 & 2032
- Figure 54: Europe Dairy Ingredients Market Volume Share (%), by Consumption Analysis 2024 & 2032
- Figure 55: Europe Dairy Ingredients Market Revenue (Million), by Import Market Analysis (Value & Volume) 2024 & 2032
- Figure 56: Europe Dairy Ingredients Market Volume (K Tons), by Import Market Analysis (Value & Volume) 2024 & 2032
- Figure 57: Europe Dairy Ingredients Market Revenue Share (%), by Import Market Analysis (Value & Volume) 2024 & 2032
- Figure 58: Europe Dairy Ingredients Market Volume Share (%), by Import Market Analysis (Value & Volume) 2024 & 2032
- Figure 59: Europe Dairy Ingredients Market Revenue (Million), by Export Market Analysis (Value & Volume) 2024 & 2032
- Figure 60: Europe Dairy Ingredients Market Volume (K Tons), by Export Market Analysis (Value & Volume) 2024 & 2032
- Figure 61: Europe Dairy Ingredients Market Revenue Share (%), by Export Market Analysis (Value & Volume) 2024 & 2032
- Figure 62: Europe Dairy Ingredients Market Volume Share (%), by Export Market Analysis (Value & Volume) 2024 & 2032
- Figure 63: Europe Dairy Ingredients Market Revenue (Million), by Price Trend Analysis 2024 & 2032
- Figure 64: Europe Dairy Ingredients Market Volume (K Tons), by Price Trend Analysis 2024 & 2032
- Figure 65: Europe Dairy Ingredients Market Revenue Share (%), by Price Trend Analysis 2024 & 2032
- Figure 66: Europe Dairy Ingredients Market Volume Share (%), by Price Trend Analysis 2024 & 2032
- Figure 67: Europe Dairy Ingredients Market Revenue (Million), by Country 2024 & 2032
- Figure 68: Europe Dairy Ingredients Market Volume (K Tons), by Country 2024 & 2032
- Figure 69: Europe Dairy Ingredients Market Revenue Share (%), by Country 2024 & 2032
- Figure 70: Europe Dairy Ingredients Market Volume Share (%), by Country 2024 & 2032
- Figure 71: Asia Pacific Dairy Ingredients Market Revenue (Million), by Production Analysis 2024 & 2032
- Figure 72: Asia Pacific Dairy Ingredients Market Volume (K Tons), by Production Analysis 2024 & 2032
- Figure 73: Asia Pacific Dairy Ingredients Market Revenue Share (%), by Production Analysis 2024 & 2032
- Figure 74: Asia Pacific Dairy Ingredients Market Volume Share (%), by Production Analysis 2024 & 2032
- Figure 75: Asia Pacific Dairy Ingredients Market Revenue (Million), by Consumption Analysis 2024 & 2032
- Figure 76: Asia Pacific Dairy Ingredients Market Volume (K Tons), by Consumption Analysis 2024 & 2032
- Figure 77: Asia Pacific Dairy Ingredients Market Revenue Share (%), by Consumption Analysis 2024 & 2032
- Figure 78: Asia Pacific Dairy Ingredients Market Volume Share (%), by Consumption Analysis 2024 & 2032
- Figure 79: Asia Pacific Dairy Ingredients Market Revenue (Million), by Import Market Analysis (Value & Volume) 2024 & 2032
- Figure 80: Asia Pacific Dairy Ingredients Market Volume (K Tons), by Import Market Analysis (Value & Volume) 2024 & 2032
- Figure 81: Asia Pacific Dairy Ingredients Market Revenue Share (%), by Import Market Analysis (Value & Volume) 2024 & 2032
- Figure 82: Asia Pacific Dairy Ingredients Market Volume Share (%), by Import Market Analysis (Value & Volume) 2024 & 2032
- Figure 83: Asia Pacific Dairy Ingredients Market Revenue (Million), by Export Market Analysis (Value & Volume) 2024 & 2032
- Figure 84: Asia Pacific Dairy Ingredients Market Volume (K Tons), by Export Market Analysis (Value & Volume) 2024 & 2032
- Figure 85: Asia Pacific Dairy Ingredients Market Revenue Share (%), by Export Market Analysis (Value & Volume) 2024 & 2032
- Figure 86: Asia Pacific Dairy Ingredients Market Volume Share (%), by Export Market Analysis (Value & Volume) 2024 & 2032
- Figure 87: Asia Pacific Dairy Ingredients Market Revenue (Million), by Price Trend Analysis 2024 & 2032
- Figure 88: Asia Pacific Dairy Ingredients Market Volume (K Tons), by Price Trend Analysis 2024 & 2032
- Figure 89: Asia Pacific Dairy Ingredients Market Revenue Share (%), by Price Trend Analysis 2024 & 2032
- Figure 90: Asia Pacific Dairy Ingredients Market Volume Share (%), by Price Trend Analysis 2024 & 2032
- Figure 91: Asia Pacific Dairy Ingredients Market Revenue (Million), by Country 2024 & 2032
- Figure 92: Asia Pacific Dairy Ingredients Market Volume (K Tons), by Country 2024 & 2032
- Figure 93: Asia Pacific Dairy Ingredients Market Revenue Share (%), by Country 2024 & 2032
- Figure 94: Asia Pacific Dairy Ingredients Market Volume Share (%), by Country 2024 & 2032
- Figure 95: South America Dairy Ingredients Market Revenue (Million), by Production Analysis 2024 & 2032
- Figure 96: South America Dairy Ingredients Market Volume (K Tons), by Production Analysis 2024 & 2032
- Figure 97: South America Dairy Ingredients Market Revenue Share (%), by Production Analysis 2024 & 2032
- Figure 98: South America Dairy Ingredients Market Volume Share (%), by Production Analysis 2024 & 2032
- Figure 99: South America Dairy Ingredients Market Revenue (Million), by Consumption Analysis 2024 & 2032
- Figure 100: South America Dairy Ingredients Market Volume (K Tons), by Consumption Analysis 2024 & 2032
- Figure 101: South America Dairy Ingredients Market Revenue Share (%), by Consumption Analysis 2024 & 2032
- Figure 102: South America Dairy Ingredients Market Volume Share (%), by Consumption Analysis 2024 & 2032
- Figure 103: South America Dairy Ingredients Market Revenue (Million), by Import Market Analysis (Value & Volume) 2024 & 2032
- Figure 104: South America Dairy Ingredients Market Volume (K Tons), by Import Market Analysis (Value & Volume) 2024 & 2032
- Figure 105: South America Dairy Ingredients Market Revenue Share (%), by Import Market Analysis (Value & Volume) 2024 & 2032
- Figure 106: South America Dairy Ingredients Market Volume Share (%), by Import Market Analysis (Value & Volume) 2024 & 2032
- Figure 107: South America Dairy Ingredients Market Revenue (Million), by Export Market Analysis (Value & Volume) 2024 & 2032
- Figure 108: South America Dairy Ingredients Market Volume (K Tons), by Export Market Analysis (Value & Volume) 2024 & 2032
- Figure 109: South America Dairy Ingredients Market Revenue Share (%), by Export Market Analysis (Value & Volume) 2024 & 2032
- Figure 110: South America Dairy Ingredients Market Volume Share (%), by Export Market Analysis (Value & Volume) 2024 & 2032
- Figure 111: South America Dairy Ingredients Market Revenue (Million), by Price Trend Analysis 2024 & 2032
- Figure 112: South America Dairy Ingredients Market Volume (K Tons), by Price Trend Analysis 2024 & 2032
- Figure 113: South America Dairy Ingredients Market Revenue Share (%), by Price Trend Analysis 2024 & 2032
- Figure 114: South America Dairy Ingredients Market Volume Share (%), by Price Trend Analysis 2024 & 2032
- Figure 115: South America Dairy Ingredients Market Revenue (Million), by Country 2024 & 2032
- Figure 116: South America Dairy Ingredients Market Volume (K Tons), by Country 2024 & 2032
- Figure 117: South America Dairy Ingredients Market Revenue Share (%), by Country 2024 & 2032
- Figure 118: South America Dairy Ingredients Market Volume Share (%), by Country 2024 & 2032
- Figure 119: Middle East and Africa Dairy Ingredients Market Revenue (Million), by Production Analysis 2024 & 2032
- Figure 120: Middle East and Africa Dairy Ingredients Market Volume (K Tons), by Production Analysis 2024 & 2032
- Figure 121: Middle East and Africa Dairy Ingredients Market Revenue Share (%), by Production Analysis 2024 & 2032
- Figure 122: Middle East and Africa Dairy Ingredients Market Volume Share (%), by Production Analysis 2024 & 2032
- Figure 123: Middle East and Africa Dairy Ingredients Market Revenue (Million), by Consumption Analysis 2024 & 2032
- Figure 124: Middle East and Africa Dairy Ingredients Market Volume (K Tons), by Consumption Analysis 2024 & 2032
- Figure 125: Middle East and Africa Dairy Ingredients Market Revenue Share (%), by Consumption Analysis 2024 & 2032
- Figure 126: Middle East and Africa Dairy Ingredients Market Volume Share (%), by Consumption Analysis 2024 & 2032
- Figure 127: Middle East and Africa Dairy Ingredients Market Revenue (Million), by Import Market Analysis (Value & Volume) 2024 & 2032
- Figure 128: Middle East and Africa Dairy Ingredients Market Volume (K Tons), by Import Market Analysis (Value & Volume) 2024 & 2032
- Figure 129: Middle East and Africa Dairy Ingredients Market Revenue Share (%), by Import Market Analysis (Value & Volume) 2024 & 2032
- Figure 130: Middle East and Africa Dairy Ingredients Market Volume Share (%), by Import Market Analysis (Value & Volume) 2024 & 2032
- Figure 131: Middle East and Africa Dairy Ingredients Market Revenue (Million), by Export Market Analysis (Value & Volume) 2024 & 2032
- Figure 132: Middle East and Africa Dairy Ingredients Market Volume (K Tons), by Export Market Analysis (Value & Volume) 2024 & 2032
- Figure 133: Middle East and Africa Dairy Ingredients Market Revenue Share (%), by Export Market Analysis (Value & Volume) 2024 & 2032
- Figure 134: Middle East and Africa Dairy Ingredients Market Volume Share (%), by Export Market Analysis (Value & Volume) 2024 & 2032
- Figure 135: Middle East and Africa Dairy Ingredients Market Revenue (Million), by Price Trend Analysis 2024 & 2032
- Figure 136: Middle East and Africa Dairy Ingredients Market Volume (K Tons), by Price Trend Analysis 2024 & 2032
- Figure 137: Middle East and Africa Dairy Ingredients Market Revenue Share (%), by Price Trend Analysis 2024 & 2032
- Figure 138: Middle East and Africa Dairy Ingredients Market Volume Share (%), by Price Trend Analysis 2024 & 2032
- Figure 139: Middle East and Africa Dairy Ingredients Market Revenue (Million), by Country 2024 & 2032
- Figure 140: Middle East and Africa Dairy Ingredients Market Volume (K Tons), by Country 2024 & 2032
- Figure 141: Middle East and Africa Dairy Ingredients Market Revenue Share (%), by Country 2024 & 2032
- Figure 142: Middle East and Africa Dairy Ingredients Market Volume Share (%), by Country 2024 & 2032
List of Tables
- Table 1: Global Dairy Ingredients Market Revenue Million Forecast, by Region 2019 & 2032
- Table 2: Global Dairy Ingredients Market Volume K Tons Forecast, by Region 2019 & 2032
- Table 3: Global Dairy Ingredients Market Revenue Million Forecast, by Production Analysis 2019 & 2032
- Table 4: Global Dairy Ingredients Market Volume K Tons Forecast, by Production Analysis 2019 & 2032
- Table 5: Global Dairy Ingredients Market Revenue Million Forecast, by Consumption Analysis 2019 & 2032
- Table 6: Global Dairy Ingredients Market Volume K Tons Forecast, by Consumption Analysis 2019 & 2032
- Table 7: Global Dairy Ingredients Market Revenue Million Forecast, by Import Market Analysis (Value & Volume) 2019 & 2032
- Table 8: Global Dairy Ingredients Market Volume K Tons Forecast, by Import Market Analysis (Value & Volume) 2019 & 2032
- Table 9: Global Dairy Ingredients Market Revenue Million Forecast, by Export Market Analysis (Value & Volume) 2019 & 2032
- Table 10: Global Dairy Ingredients Market Volume K Tons Forecast, by Export Market Analysis (Value & Volume) 2019 & 2032
- Table 11: Global Dairy Ingredients Market Revenue Million Forecast, by Price Trend Analysis 2019 & 2032
- Table 12: Global Dairy Ingredients Market Volume K Tons Forecast, by Price Trend Analysis 2019 & 2032
- Table 13: Global Dairy Ingredients Market Revenue Million Forecast, by Region 2019 & 2032
- Table 14: Global Dairy Ingredients Market Volume K Tons Forecast, by Region 2019 & 2032
- Table 15: Global Dairy Ingredients Market Revenue Million Forecast, by Country 2019 & 2032
- Table 16: Global Dairy Ingredients Market Volume K Tons Forecast, by Country 2019 & 2032
- Table 17: United States Dairy Ingredients Market Revenue (Million) Forecast, by Application 2019 & 2032
- Table 18: United States Dairy Ingredients Market Volume (K Tons) Forecast, by Application 2019 & 2032
- Table 19: Canada Dairy Ingredients Market Revenue (Million) Forecast, by Application 2019 & 2032
- Table 20: Canada Dairy Ingredients Market Volume (K Tons) Forecast, by Application 2019 & 2032
- Table 21: Mexico Dairy Ingredients Market Revenue (Million) Forecast, by Application 2019 & 2032
- Table 22: Mexico Dairy Ingredients Market Volume (K Tons) Forecast, by Application 2019 & 2032
- Table 23: Rest of North America Dairy Ingredients Market Revenue (Million) Forecast, by Application 2019 & 2032
- Table 24: Rest of North America Dairy Ingredients Market Volume (K Tons) Forecast, by Application 2019 & 2032
- Table 25: Global Dairy Ingredients Market Revenue Million Forecast, by Country 2019 & 2032
- Table 26: Global Dairy Ingredients Market Volume K Tons Forecast, by Country 2019 & 2032
- Table 27: United Kingdom Dairy Ingredients Market Revenue (Million) Forecast, by Application 2019 & 2032
- Table 28: United Kingdom Dairy Ingredients Market Volume (K Tons) Forecast, by Application 2019 & 2032
- Table 29: Germany Dairy Ingredients Market Revenue (Million) Forecast, by Application 2019 & 2032
- Table 30: Germany Dairy Ingredients Market Volume (K Tons) Forecast, by Application 2019 & 2032
- Table 31: France Dairy Ingredients Market Revenue (Million) Forecast, by Application 2019 & 2032
- Table 32: France Dairy Ingredients Market Volume (K Tons) Forecast, by Application 2019 & 2032
- Table 33: Russia Dairy Ingredients Market Revenue (Million) Forecast, by Application 2019 & 2032
- Table 34: Russia Dairy Ingredients Market Volume (K Tons) Forecast, by Application 2019 & 2032
- Table 35: Italy Dairy Ingredients Market Revenue (Million) Forecast, by Application 2019 & 2032
- Table 36: Italy Dairy Ingredients Market Volume (K Tons) Forecast, by Application 2019 & 2032
- Table 37: Spain Dairy Ingredients Market Revenue (Million) Forecast, by Application 2019 & 2032
- Table 38: Spain Dairy Ingredients Market Volume (K Tons) Forecast, by Application 2019 & 2032
- Table 39: Rest of Europe Dairy Ingredients Market Revenue (Million) Forecast, by Application 2019 & 2032
- Table 40: Rest of Europe Dairy Ingredients Market Volume (K Tons) Forecast, by Application 2019 & 2032
- Table 41: Global Dairy Ingredients Market Revenue Million Forecast, by Country 2019 & 2032
- Table 42: Global Dairy Ingredients Market Volume K Tons Forecast, by Country 2019 & 2032
- Table 43: India Dairy Ingredients Market Revenue (Million) Forecast, by Application 2019 & 2032
- Table 44: India Dairy Ingredients Market Volume (K Tons) Forecast, by Application 2019 & 2032
- Table 45: China Dairy Ingredients Market Revenue (Million) Forecast, by Application 2019 & 2032
- Table 46: China Dairy Ingredients Market Volume (K Tons) Forecast, by Application 2019 & 2032
- Table 47: Japan Dairy Ingredients Market Revenue (Million) Forecast, by Application 2019 & 2032
- Table 48: Japan Dairy Ingredients Market Volume (K Tons) Forecast, by Application 2019 & 2032
- Table 49: Australia Dairy Ingredients Market Revenue (Million) Forecast, by Application 2019 & 2032
- Table 50: Australia Dairy Ingredients Market Volume (K Tons) Forecast, by Application 2019 & 2032
- Table 51: Rest of Asia Pacific Dairy Ingredients Market Revenue (Million) Forecast, by Application 2019 & 2032
- Table 52: Rest of Asia Pacific Dairy Ingredients Market Volume (K Tons) Forecast, by Application 2019 & 2032
- Table 53: Global Dairy Ingredients Market Revenue Million Forecast, by Country 2019 & 2032
- Table 54: Global Dairy Ingredients Market Volume K Tons Forecast, by Country 2019 & 2032
- Table 55: Brazil Dairy Ingredients Market Revenue (Million) Forecast, by Application 2019 & 2032
- Table 56: Brazil Dairy Ingredients Market Volume (K Tons) Forecast, by Application 2019 & 2032
- Table 57: Argentina Dairy Ingredients Market Revenue (Million) Forecast, by Application 2019 & 2032
- Table 58: Argentina Dairy Ingredients Market Volume (K Tons) Forecast, by Application 2019 & 2032
- Table 59: Rest of South America Dairy Ingredients Market Revenue (Million) Forecast, by Application 2019 & 2032
- Table 60: Rest of South America Dairy Ingredients Market Volume (K Tons) Forecast, by Application 2019 & 2032
- Table 61: Global Dairy Ingredients Market Revenue Million Forecast, by Country 2019 & 2032
- Table 62: Global Dairy Ingredients Market Volume K Tons Forecast, by Country 2019 & 2032
- Table 63: United Arab Emirates Dairy Ingredients Market Revenue (Million) Forecast, by Application 2019 & 2032
- Table 64: United Arab Emirates Dairy Ingredients Market Volume (K Tons) Forecast, by Application 2019 & 2032
- Table 65: South Africa Dairy Ingredients Market Revenue (Million) Forecast, by Application 2019 & 2032
- Table 66: South Africa Dairy Ingredients Market Volume (K Tons) Forecast, by Application 2019 & 2032
- Table 67: Rest of Middle East and Africa Dairy Ingredients Market Revenue (Million) Forecast, by Application 2019 & 2032
- Table 68: Rest of Middle East and Africa Dairy Ingredients Market Volume (K Tons) Forecast, by Application 2019 & 2032
- Table 69: Global Dairy Ingredients Market Revenue Million Forecast, by Production Analysis 2019 & 2032
- Table 70: Global Dairy Ingredients Market Volume K Tons Forecast, by Production Analysis 2019 & 2032
- Table 71: Global Dairy Ingredients Market Revenue Million Forecast, by Consumption Analysis 2019 & 2032
- Table 72: Global Dairy Ingredients Market Volume K Tons Forecast, by Consumption Analysis 2019 & 2032
- Table 73: Global Dairy Ingredients Market Revenue Million Forecast, by Import Market Analysis (Value & Volume) 2019 & 2032
- Table 74: Global Dairy Ingredients Market Volume K Tons Forecast, by Import Market Analysis (Value & Volume) 2019 & 2032
- Table 75: Global Dairy Ingredients Market Revenue Million Forecast, by Export Market Analysis (Value & Volume) 2019 & 2032
- Table 76: Global Dairy Ingredients Market Volume K Tons Forecast, by Export Market Analysis (Value & Volume) 2019 & 2032
- Table 77: Global Dairy Ingredients Market Revenue Million Forecast, by Price Trend Analysis 2019 & 2032
- Table 78: Global Dairy Ingredients Market Volume K Tons Forecast, by Price Trend Analysis 2019 & 2032
- Table 79: Global Dairy Ingredients Market Revenue Million Forecast, by Country 2019 & 2032
- Table 80: Global Dairy Ingredients Market Volume K Tons Forecast, by Country 2019 & 2032
- Table 81: United States Dairy Ingredients Market Revenue (Million) Forecast, by Application 2019 & 2032
- Table 82: United States Dairy Ingredients Market Volume (K Tons) Forecast, by Application 2019 & 2032
- Table 83: Canada Dairy Ingredients Market Revenue (Million) Forecast, by Application 2019 & 2032
- Table 84: Canada Dairy Ingredients Market Volume (K Tons) Forecast, by Application 2019 & 2032
- Table 85: Mexico Dairy Ingredients Market Revenue (Million) Forecast, by Application 2019 & 2032
- Table 86: Mexico Dairy Ingredients Market Volume (K Tons) Forecast, by Application 2019 & 2032
- Table 87: Rest of North America Dairy Ingredients Market Revenue (Million) Forecast, by Application 2019 & 2032
- Table 88: Rest of North America Dairy Ingredients Market Volume (K Tons) Forecast, by Application 2019 & 2032
- Table 89: Global Dairy Ingredients Market Revenue Million Forecast, by Production Analysis 2019 & 2032
- Table 90: Global Dairy Ingredients Market Volume K Tons Forecast, by Production Analysis 2019 & 2032
- Table 91: Global Dairy Ingredients Market Revenue Million Forecast, by Consumption Analysis 2019 & 2032
- Table 92: Global Dairy Ingredients Market Volume K Tons Forecast, by Consumption Analysis 2019 & 2032
- Table 93: Global Dairy Ingredients Market Revenue Million Forecast, by Import Market Analysis (Value & Volume) 2019 & 2032
- Table 94: Global Dairy Ingredients Market Volume K Tons Forecast, by Import Market Analysis (Value & Volume) 2019 & 2032
- Table 95: Global Dairy Ingredients Market Revenue Million Forecast, by Export Market Analysis (Value & Volume) 2019 & 2032
- Table 96: Global Dairy Ingredients Market Volume K Tons Forecast, by Export Market Analysis (Value & Volume) 2019 & 2032
- Table 97: Global Dairy Ingredients Market Revenue Million Forecast, by Price Trend Analysis 2019 & 2032
- Table 98: Global Dairy Ingredients Market Volume K Tons Forecast, by Price Trend Analysis 2019 & 2032
- Table 99: Global Dairy Ingredients Market Revenue Million Forecast, by Country 2019 & 2032
- Table 100: Global Dairy Ingredients Market Volume K Tons Forecast, by Country 2019 & 2032
- Table 101: United Kingdom Dairy Ingredients Market Revenue (Million) Forecast, by Application 2019 & 2032
- Table 102: United Kingdom Dairy Ingredients Market Volume (K Tons) Forecast, by Application 2019 & 2032
- Table 103: Germany Dairy Ingredients Market Revenue (Million) Forecast, by Application 2019 & 2032
- Table 104: Germany Dairy Ingredients Market Volume (K Tons) Forecast, by Application 2019 & 2032
- Table 105: France Dairy Ingredients Market Revenue (Million) Forecast, by Application 2019 & 2032
- Table 106: France Dairy Ingredients Market Volume (K Tons) Forecast, by Application 2019 & 2032
- Table 107: Russia Dairy Ingredients Market Revenue (Million) Forecast, by Application 2019 & 2032
- Table 108: Russia Dairy Ingredients Market Volume (K Tons) Forecast, by Application 2019 & 2032
- Table 109: Italy Dairy Ingredients Market Revenue (Million) Forecast, by Application 2019 & 2032
- Table 110: Italy Dairy Ingredients Market Volume (K Tons) Forecast, by Application 2019 & 2032
- Table 111: Spain Dairy Ingredients Market Revenue (Million) Forecast, by Application 2019 & 2032
- Table 112: Spain Dairy Ingredients Market Volume (K Tons) Forecast, by Application 2019 & 2032
- Table 113: Rest of Europe Dairy Ingredients Market Revenue (Million) Forecast, by Application 2019 & 2032
- Table 114: Rest of Europe Dairy Ingredients Market Volume (K Tons) Forecast, by Application 2019 & 2032
- Table 115: Global Dairy Ingredients Market Revenue Million Forecast, by Production Analysis 2019 & 2032
- Table 116: Global Dairy Ingredients Market Volume K Tons Forecast, by Production Analysis 2019 & 2032
- Table 117: Global Dairy Ingredients Market Revenue Million Forecast, by Consumption Analysis 2019 & 2032
- Table 118: Global Dairy Ingredients Market Volume K Tons Forecast, by Consumption Analysis 2019 & 2032
- Table 119: Global Dairy Ingredients Market Revenue Million Forecast, by Import Market Analysis (Value & Volume) 2019 & 2032
- Table 120: Global Dairy Ingredients Market Volume K Tons Forecast, by Import Market Analysis (Value & Volume) 2019 & 2032
- Table 121: Global Dairy Ingredients Market Revenue Million Forecast, by Export Market Analysis (Value & Volume) 2019 & 2032
- Table 122: Global Dairy Ingredients Market Volume K Tons Forecast, by Export Market Analysis (Value & Volume) 2019 & 2032
- Table 123: Global Dairy Ingredients Market Revenue Million Forecast, by Price Trend Analysis 2019 & 2032
- Table 124: Global Dairy Ingredients Market Volume K Tons Forecast, by Price Trend Analysis 2019 & 2032
- Table 125: Global Dairy Ingredients Market Revenue Million Forecast, by Country 2019 & 2032
- Table 126: Global Dairy Ingredients Market Volume K Tons Forecast, by Country 2019 & 2032
- Table 127: India Dairy Ingredients Market Revenue (Million) Forecast, by Application 2019 & 2032
- Table 128: India Dairy Ingredients Market Volume (K Tons) Forecast, by Application 2019 & 2032
- Table 129: China Dairy Ingredients Market Revenue (Million) Forecast, by Application 2019 & 2032
- Table 130: China Dairy Ingredients Market Volume (K Tons) Forecast, by Application 2019 & 2032
- Table 131: Japan Dairy Ingredients Market Revenue (Million) Forecast, by Application 2019 & 2032
- Table 132: Japan Dairy Ingredients Market Volume (K Tons) Forecast, by Application 2019 & 2032
- Table 133: Australia Dairy Ingredients Market Revenue (Million) Forecast, by Application 2019 & 2032
- Table 134: Australia Dairy Ingredients Market Volume (K Tons) Forecast, by Application 2019 & 2032
- Table 135: Rest of Asia Pacific Dairy Ingredients Market Revenue (Million) Forecast, by Application 2019 & 2032
- Table 136: Rest of Asia Pacific Dairy Ingredients Market Volume (K Tons) Forecast, by Application 2019 & 2032
- Table 137: Global Dairy Ingredients Market Revenue Million Forecast, by Production Analysis 2019 & 2032
- Table 138: Global Dairy Ingredients Market Volume K Tons Forecast, by Production Analysis 2019 & 2032
- Table 139: Global Dairy Ingredients Market Revenue Million Forecast, by Consumption Analysis 2019 & 2032
- Table 140: Global Dairy Ingredients Market Volume K Tons Forecast, by Consumption Analysis 2019 & 2032
- Table 141: Global Dairy Ingredients Market Revenue Million Forecast, by Import Market Analysis (Value & Volume) 2019 & 2032
- Table 142: Global Dairy Ingredients Market Volume K Tons Forecast, by Import Market Analysis (Value & Volume) 2019 & 2032
- Table 143: Global Dairy Ingredients Market Revenue Million Forecast, by Export Market Analysis (Value & Volume) 2019 & 2032
- Table 144: Global Dairy Ingredients Market Volume K Tons Forecast, by Export Market Analysis (Value & Volume) 2019 & 2032
- Table 145: Global Dairy Ingredients Market Revenue Million Forecast, by Price Trend Analysis 2019 & 2032
- Table 146: Global Dairy Ingredients Market Volume K Tons Forecast, by Price Trend Analysis 2019 & 2032
- Table 147: Global Dairy Ingredients Market Revenue Million Forecast, by Country 2019 & 2032
- Table 148: Global Dairy Ingredients Market Volume K Tons Forecast, by Country 2019 & 2032
- Table 149: Brazil Dairy Ingredients Market Revenue (Million) Forecast, by Application 2019 & 2032
- Table 150: Brazil Dairy Ingredients Market Volume (K Tons) Forecast, by Application 2019 & 2032
- Table 151: Argentina Dairy Ingredients Market Revenue (Million) Forecast, by Application 2019 & 2032
- Table 152: Argentina Dairy Ingredients Market Volume (K Tons) Forecast, by Application 2019 & 2032
- Table 153: Rest of South America Dairy Ingredients Market Revenue (Million) Forecast, by Application 2019 & 2032
- Table 154: Rest of South America Dairy Ingredients Market Volume (K Tons) Forecast, by Application 2019 & 2032
- Table 155: Global Dairy Ingredients Market Revenue Million Forecast, by Production Analysis 2019 & 2032
- Table 156: Global Dairy Ingredients Market Volume K Tons Forecast, by Production Analysis 2019 & 2032
- Table 157: Global Dairy Ingredients Market Revenue Million Forecast, by Consumption Analysis 2019 & 2032
- Table 158: Global Dairy Ingredients Market Volume K Tons Forecast, by Consumption Analysis 2019 & 2032
- Table 159: Global Dairy Ingredients Market Revenue Million Forecast, by Import Market Analysis (Value & Volume) 2019 & 2032
- Table 160: Global Dairy Ingredients Market Volume K Tons Forecast, by Import Market Analysis (Value & Volume) 2019 & 2032
- Table 161: Global Dairy Ingredients Market Revenue Million Forecast, by Export Market Analysis (Value & Volume) 2019 & 2032
- Table 162: Global Dairy Ingredients Market Volume K Tons Forecast, by Export Market Analysis (Value & Volume) 2019 & 2032
- Table 163: Global Dairy Ingredients Market Revenue Million Forecast, by Price Trend Analysis 2019 & 2032
- Table 164: Global Dairy Ingredients Market Volume K Tons Forecast, by Price Trend Analysis 2019 & 2032
- Table 165: Global Dairy Ingredients Market Revenue Million Forecast, by Country 2019 & 2032
- Table 166: Global Dairy Ingredients Market Volume K Tons Forecast, by Country 2019 & 2032
- Table 167: United Arab Emirates Dairy Ingredients Market Revenue (Million) Forecast, by Application 2019 & 2032
- Table 168: United Arab Emirates Dairy Ingredients Market Volume (K Tons) Forecast, by Application 2019 & 2032
- Table 169: South Africa Dairy Ingredients Market Revenue (Million) Forecast, by Application 2019 & 2032
- Table 170: South Africa Dairy Ingredients Market Volume (K Tons) Forecast, by Application 2019 & 2032
- Table 171: Rest of Middle East and Africa Dairy Ingredients Market Revenue (Million) Forecast, by Application 2019 & 2032
- Table 172: Rest of Middle East and Africa Dairy Ingredients Market Volume (K Tons) Forecast, by Application 2019 & 2032
Frequently Asked Questions
1. What is the projected Compound Annual Growth Rate (CAGR) of the Dairy Ingredients Market?
The projected CAGR is approximately 4.06%.
2. Which companies are prominent players in the Dairy Ingredients Market?
Key companies in the market include Sodiaal co-operative group, Arla Foods amba, Royal Friesland Campina, Dairy Farmers of America, Saputo Inc *List Not Exhaustive, Kerry Group PLC, Volac International Ltd, Fonterra Co-Operative Group Limited, Groupe Lactalis, Hoogwegt International BV, Kanegrade Ltd.
3. What are the main segments of the Dairy Ingredients Market?
The market segments include Production Analysis, Consumption Analysis, Import Market Analysis (Value & Volume), Export Market Analysis (Value & Volume), Price Trend Analysis.
4. Can you provide details about the market size?
The market size is estimated to be USD 62.50 Million as of 2022.
5. What are some drivers contributing to market growth?
Increasing demand for sports nutritional supplements.
6. What are the notable trends driving market growth?
Increasing Milk Production Supporting the Demand for Dairy Ingredients.
7. Are there any restraints impacting market growth?
Rising demand for plant-based protein.
8. Can you provide examples of recent developments in the market?
July 2022: NZMP, Fonterra's global ingredient business, entered into a joint venture with Tillamook County Creamery Association (TCAA) and Three Mile Canyon Farms in the US to launch Pro-OptimaTM, a grade A functional whey protein concentrate (fWPC), to the market.
9. What pricing options are available for accessing the report?
Pricing options include single-user, multi-user, and enterprise licenses priced at USD 4750, USD 5250, and USD 8750 respectively.
10. Is the market size provided in terms of value or volume?
The market size is provided in terms of value, measured in Million and volume, measured in K Tons.
11. Are there any specific market keywords associated with the report?
Yes, the market keyword associated with the report is "Dairy Ingredients Market," which aids in identifying and referencing the specific market segment covered.
12. How do I determine which pricing option suits my needs best?
The pricing options vary based on user requirements and access needs. Individual users may opt for single-user licenses, while businesses requiring broader access may choose multi-user or enterprise licenses for cost-effective access to the report.
13. Are there any additional resources or data provided in the Dairy Ingredients Market report?
While the report offers comprehensive insights, it's advisable to review the specific contents or supplementary materials provided to ascertain if additional resources or data are available.
14. How can I stay updated on further developments or reports in the Dairy Ingredients Market?
To stay informed about further developments, trends, and reports in the Dairy Ingredients Market, consider subscribing to industry newsletters, following relevant companies and organizations, or regularly checking reputable industry news sources and publications.
Methodology
Step 1 - Identification of Relevant Samples Size from Population Database


Step 2 - Approaches for Defining Global Market Size (Value, Volume* & Price*)

Note*: In applicable scenarios
Step 3 - Data Sources
Primary Research
- Web Analytics
- Survey Reports
- Research Institute
- Latest Research Reports
- Opinion Leaders
Secondary Research
- Annual Reports
- White Paper
- Latest Press Release
- Industry Association
- Paid Database
- Investor Presentations

Step 4 - Data Triangulation
Involves using different sources of information in order to increase the validity of a study
These sources are likely to be stakeholders in a program - participants, other researchers, program staff, other community members, and so on.
Then we put all data in single framework & apply various statistical tools to find out the dynamic on the market.
During the analysis stage, feedback from the stakeholder groups would be compared to determine areas of agreement as well as areas of divergence


