
Key Insights
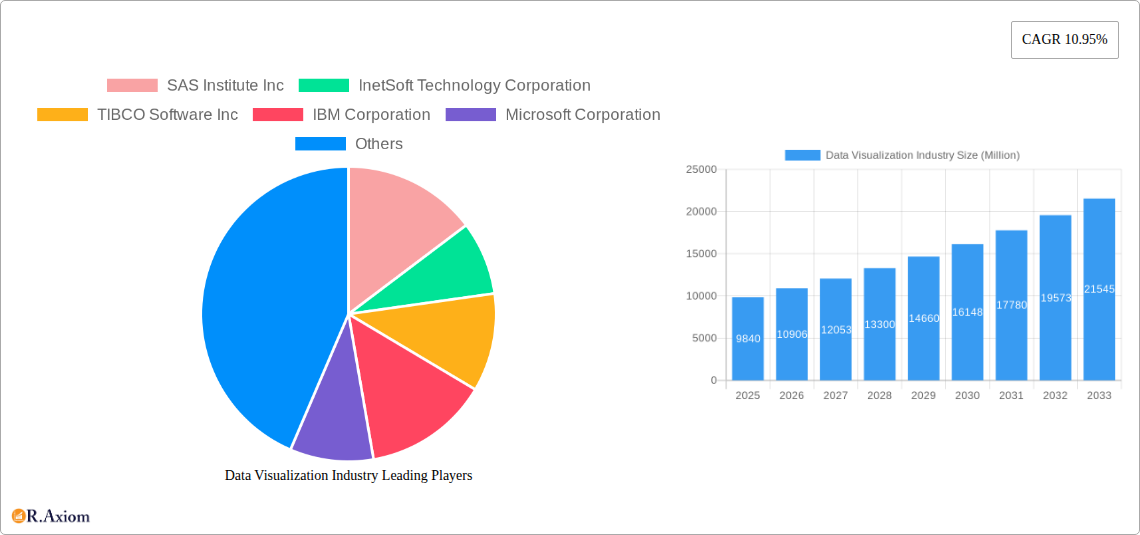
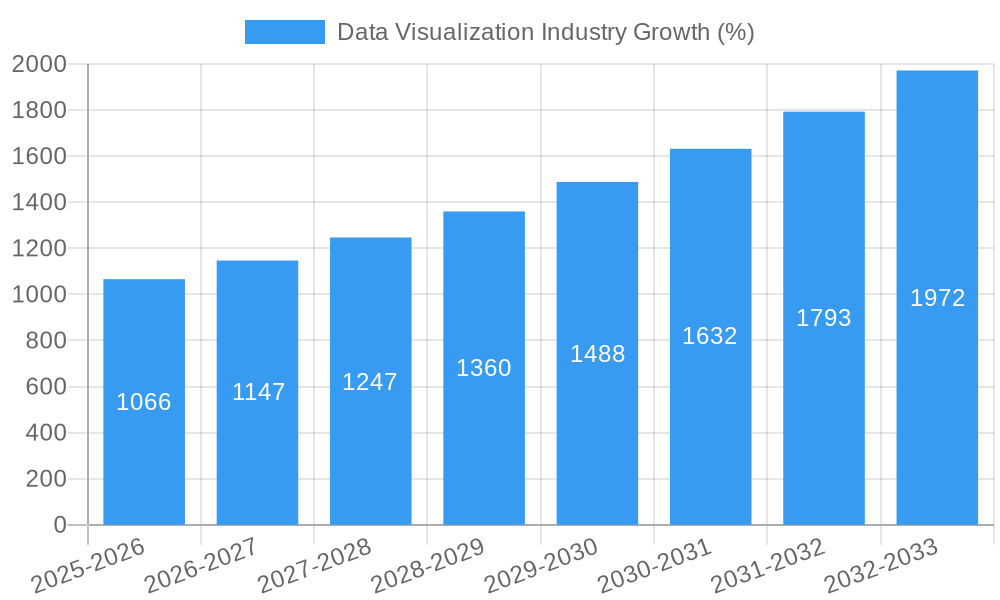
The global data visualization market, currently valued at $9.84 billion in 2025, is experiencing robust growth, projected to expand at a Compound Annual Growth Rate (CAGR) of 10.95% from 2025 to 2033. This surge is driven by several key factors. The increasing volume and complexity of data generated by businesses across all sectors necessitate effective visualization tools for insightful analysis and strategic decision-making. Furthermore, the rising adoption of cloud-based solutions offers scalability, accessibility, and cost-effectiveness, fueling market expansion. Advancements in artificial intelligence (AI) and machine learning (ML) are further enhancing the capabilities of data visualization platforms, enabling automated insights and predictive analytics. The strong demand across diverse end-user industries like BFSI (Banking, Financial Services, and Insurance), IT and Telecommunications, and Retail/E-commerce significantly contributes to market growth. Competitive landscape is characterized by both established players like SAS, IBM, and Microsoft, and emerging innovative companies, fostering continuous improvement and innovation in the sector. While data security concerns and the need for skilled professionals pose challenges, the overall market outlook remains overwhelmingly positive.
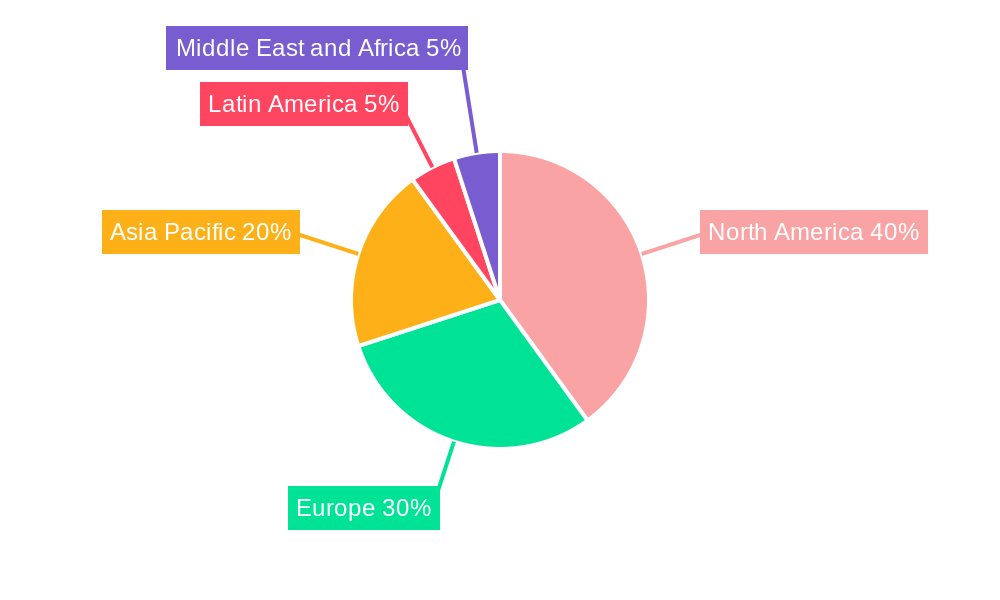
The market segmentation reveals significant opportunities across various organizational departments. Executive management leverages data visualization for high-level strategic planning, while marketing relies on it for campaign performance analysis. Operations uses it for process optimization, finance for financial modeling, and sales for performance tracking. The preference for cloud/on-demand deployment models reflects the growing adoption of flexible and scalable solutions. Geographically, North America currently holds a significant market share, but the Asia-Pacific region is expected to witness substantial growth driven by increasing digitalization and technological advancements. The continued integration of data visualization into business intelligence (BI) and analytics platforms will further solidify its position as an indispensable tool for data-driven decision making in the coming years.
Data Visualization Industry: Market Analysis & Forecast 2019-2033
This comprehensive report provides a detailed analysis of the Data Visualization industry, offering invaluable insights for stakeholders, investors, and industry professionals. The study period covers 2019-2033, with a base year of 2025 and a forecast period of 2025-2033. The report utilizes a robust methodology, incorporating historical data (2019-2024) and advanced forecasting models to provide accurate market estimations. The total market size is projected to reach $xx Million by 2033, exhibiting a CAGR of xx% during the forecast period.
Data Visualization Industry Market Concentration & Innovation
The Data Visualization market exhibits a moderately concentrated landscape, with a few major players holding significant market share. Key players like SAS Institute Inc, IBM Corporation, Microsoft Corporation, Oracle Corporation, Salesforce.com Inc (Tableau Software Inc), SAP SE, and MicroStrategy Inc dominate the market. However, numerous smaller companies and niche players contribute to market dynamism.
Market concentration is influenced by factors such as:
- Technological innovation: Constant advancements in AI, machine learning, and big data analytics are driving innovation, leading to more sophisticated visualization tools.
- Mergers and Acquisitions (M&A): The industry witnesses frequent M&A activity, with larger companies acquiring smaller ones to expand their product portfolios and market reach. Deal values have varied significantly, ranging from $xx Million to $xx Million in recent years. For example, the acquisition of X company by Y company in 2023 valued at $xx Million exemplifies this trend.
- Regulatory frameworks: Data privacy regulations (GDPR, CCPA) influence product development and market access, favoring solutions that prioritize data security.
- Product substitutes: The rise of open-source visualization tools presents a challenge to commercial vendors, increasing competition and potentially reducing market concentration.
- End-user trends: The increasing demand for self-service BI and cloud-based solutions is transforming the market, favouring providers that offer scalable and user-friendly platforms.
Data Visualization Industry Industry Trends & Insights
The Data Visualization market is experiencing robust growth driven by several factors. The increasing volume and complexity of data, coupled with the need for insightful data-driven decision-making, fuels the demand for advanced visualization tools. The global market is estimated at $xx Million in 2025, with a projected CAGR of xx% between 2025 and 2033. Key factors driving market expansion include:
- Rise of big data and analytics: Organizations generate massive amounts of data, necessitating effective tools to visualize and interpret it.
- Growing adoption of cloud computing: Cloud-based visualization platforms offer scalability, accessibility, and cost-effectiveness.
- Increased focus on data-driven decision making: Businesses are increasingly reliant on data insights to optimize operations and improve decision-making processes.
- Advancements in artificial intelligence (AI) and machine learning (ML): AI and ML are enhancing the capabilities of data visualization tools, enabling more sophisticated analysis and insights.
- Growing demand for interactive dashboards and self-service BI: User-friendly tools empower business users to explore data independently, reducing reliance on IT departments.
- Increased competition: The market is competitive, pushing innovation and driving down prices, making visualization tools more accessible.
- Market penetration: The penetration of data visualization tools across various industries is increasing, with adoption rates particularly high in sectors like BFSI and IT & Telecommunications.
Dominant Markets & Segments in Data Visualization Industry
The North American region currently holds the largest market share in the Data Visualization industry, driven by factors such as strong technological advancements, high adoption rates across various sectors, and a mature market for business intelligence solutions.
Within market segments:
- Organizational Department: Executive management and marketing departments show highest adoption and spending, signifying prioritization of strategic decision-making and marketing effectiveness.
- Deployment Mode: Cloud/On-demand deployment is gaining traction due to its flexibility, scalability, and reduced IT infrastructure costs.
- End User: BFSI and IT & Telecommunications sectors demonstrate significant adoption, driven by their dependence on data-driven decision making and operational efficiency. The growth is expected to continue in the Manufacturing sector as well.
Key Drivers:
- Robust economic growth: A healthy economy fuels business investments in data analytics and visualization.
- Developed IT infrastructure: Advanced IT infrastructure facilitates the implementation and adoption of data visualization solutions.
- Favorable government policies: Government initiatives promoting digital transformation and data-driven decision making drive market growth.
Data Visualization Industry Product Developments
Recent product innovations include AI-powered dashboards that automate data analysis and generate predictive insights. For example, SymphonyAI Industrial's KPI 360 and INT's IVAAP platform exemplify this trend, offering real-time data monitoring and visualization capabilities tailored for specific industries (manufacturing and energy, respectively). These advancements create significant competitive advantages, empowering companies to leverage data for improved efficiency and decision-making.
Report Scope & Segmentation Analysis
This report segments the Data Visualization market based on organizational department (Executive Management, Marketing, Operations, Finance, Sales, Other), deployment mode (On-premise, Cloud/On-demand), and end-user (BFSI, IT & Telecommunication, Retail/E-commerce, Education, Manufacturing, Government, Other). Each segment's growth is analyzed based on market size, growth rate, and competitive dynamics. For instance, the Cloud/On-demand segment is expected to witness the highest growth rate during the forecast period due to its inherent advantages. Similarly, BFSI and IT & Telecommunications sectors will continue to dominate end-user segment.
Key Drivers of Data Visualization Industry Growth
The Data Visualization industry's growth is fueled by increasing data volumes, advancements in AI and ML, the rise of cloud computing, and the need for data-driven decision-making across various industries. Government regulations mandating data transparency and accessibility also stimulate the market. The demand for user-friendly, self-service tools further accelerates growth.
Challenges in the Data Visualization Industry Sector
Challenges include ensuring data security and privacy compliance, managing the complexity of integrating diverse data sources, and navigating the competitive landscape. High implementation costs and the need for specialized skills to effectively utilize data visualization tools also pose obstacles. The industry is also facing the challenge of data silos preventing a holistic view of information and making it difficult to implement unified data visualization solutions.
Emerging Opportunities in Data Visualization Industry
Emerging opportunities lie in the growing demand for immersive visualization (VR/AR), the integration of data visualization with IoT devices, and the development of advanced analytics capabilities embedded within visualization tools. Expanding into new markets (e.g., healthcare, agriculture) and developing solutions tailored to specific industry needs also present promising avenues for growth.
Leading Players in the Data Visualization Industry Market
- SAS Institute Inc
- InetSoft Technology Corporation
- TIBCO Software Inc
- IBM Corporation
- Microsoft Corporation
- Pentaho Corporation
- Dundas Data Visualization Inc
- Information Builders
- Oracle Corporation
- Salesforce.com Inc (Tableau Software Inc)
- SAP SE
- MicroStrategy Inc
Key Developments in Data Visualization Industry Industry
- September 2022: SymphonyAI Industrial unveils KPI 360, an AI-driven solution for real-time manufacturing data visualization. This significantly improves operational visibility and decision-making within the manufacturing sector.
- January 2022: INT releases an updated IVAAP platform, enhancing subsurface data visualization capabilities for the energy sector. The improved 3D and 2D visualization features boost efficiency in exploration and production.
Strategic Outlook for Data Visualization Industry Market
The Data Visualization market is poised for continued growth, driven by technological advancements, expanding data volumes, and increased demand for data-driven insights. Companies that prioritize innovation, user experience, and data security will be best positioned to capitalize on future opportunities. The focus will shift towards AI-powered, self-service platforms and tailored solutions for specific industry verticals.
Data Visualization Industry Segmentation
-
1. Organizational Department
- 1.1. Executive Management
- 1.2. Marketing
- 1.3. Operations
- 1.4. Finance
- 1.5. Sales
- 1.6. Other Organizational Departments
-
2. Deployment Mode
- 2.1. On-premise
- 2.2. Cloud/On-demand
-
3. End User
- 3.1. BFSI
- 3.2. IT and Telecommunication
- 3.3. Retail/E-commerce
- 3.4. Education
- 3.5. Manufacturing
- 3.6. Government
- 3.7. Other End Users
Data Visualization Industry Segmentation By Geography
- 1. North America
- 2. Europe
- 3. Asia Pacific
- 4. Latin America
- 5. Middle East and Africa
Data Visualization Industry REPORT HIGHLIGHTS
| Aspects | Details |
|---|---|
| Study Period | 2019-2033 |
| Base Year | 2024 |
| Estimated Year | 2025 |
| Forecast Period | 2025-2033 |
| Historical Period | 2019-2024 |
| Growth Rate | CAGR of 10.95% from 2019-2033 |
| Segmentation |
|
Table of Contents
- 1. Introduction
- 1.1. Research Scope
- 1.2. Market Segmentation
- 1.3. Research Methodology
- 1.4. Definitions and Assumptions
- 2. Executive Summary
- 2.1. Introduction
- 3. Market Dynamics
- 3.1. Introduction
- 3.2. Market Drivers
- 3.2.1. Cloud Deployment of Data Visualization Solutions; Increasing Need for Quick Decision Making
- 3.3. Market Restrains
- 3.3.1. Lack of Tech Savvy and Skilled Workforce/Inability
- 3.4. Market Trends
- 3.4.1. Retail Segment to Witness Significant Growth
- 4. Market Factor Analysis
- 4.1. Porters Five Forces
- 4.2. Supply/Value Chain
- 4.3. PESTEL analysis
- 4.4. Market Entropy
- 4.5. Patent/Trademark Analysis
- 5. Global Data Visualization Industry Analysis, Insights and Forecast, 2019-2031
- 5.1. Market Analysis, Insights and Forecast - by Organizational Department
- 5.1.1. Executive Management
- 5.1.2. Marketing
- 5.1.3. Operations
- 5.1.4. Finance
- 5.1.5. Sales
- 5.1.6. Other Organizational Departments
- 5.2. Market Analysis, Insights and Forecast - by Deployment Mode
- 5.2.1. On-premise
- 5.2.2. Cloud/On-demand
- 5.3. Market Analysis, Insights and Forecast - by End User
- 5.3.1. BFSI
- 5.3.2. IT and Telecommunication
- 5.3.3. Retail/E-commerce
- 5.3.4. Education
- 5.3.5. Manufacturing
- 5.3.6. Government
- 5.3.7. Other End Users
- 5.4. Market Analysis, Insights and Forecast - by Region
- 5.4.1. North America
- 5.4.2. Europe
- 5.4.3. Asia Pacific
- 5.4.4. Latin America
- 5.4.5. Middle East and Africa
- 5.1. Market Analysis, Insights and Forecast - by Organizational Department
- 6. North America Data Visualization Industry Analysis, Insights and Forecast, 2019-2031
- 6.1. Market Analysis, Insights and Forecast - by Organizational Department
- 6.1.1. Executive Management
- 6.1.2. Marketing
- 6.1.3. Operations
- 6.1.4. Finance
- 6.1.5. Sales
- 6.1.6. Other Organizational Departments
- 6.2. Market Analysis, Insights and Forecast - by Deployment Mode
- 6.2.1. On-premise
- 6.2.2. Cloud/On-demand
- 6.3. Market Analysis, Insights and Forecast - by End User
- 6.3.1. BFSI
- 6.3.2. IT and Telecommunication
- 6.3.3. Retail/E-commerce
- 6.3.4. Education
- 6.3.5. Manufacturing
- 6.3.6. Government
- 6.3.7. Other End Users
- 6.1. Market Analysis, Insights and Forecast - by Organizational Department
- 7. Europe Data Visualization Industry Analysis, Insights and Forecast, 2019-2031
- 7.1. Market Analysis, Insights and Forecast - by Organizational Department
- 7.1.1. Executive Management
- 7.1.2. Marketing
- 7.1.3. Operations
- 7.1.4. Finance
- 7.1.5. Sales
- 7.1.6. Other Organizational Departments
- 7.2. Market Analysis, Insights and Forecast - by Deployment Mode
- 7.2.1. On-premise
- 7.2.2. Cloud/On-demand
- 7.3. Market Analysis, Insights and Forecast - by End User
- 7.3.1. BFSI
- 7.3.2. IT and Telecommunication
- 7.3.3. Retail/E-commerce
- 7.3.4. Education
- 7.3.5. Manufacturing
- 7.3.6. Government
- 7.3.7. Other End Users
- 7.1. Market Analysis, Insights and Forecast - by Organizational Department
- 8. Asia Pacific Data Visualization Industry Analysis, Insights and Forecast, 2019-2031
- 8.1. Market Analysis, Insights and Forecast - by Organizational Department
- 8.1.1. Executive Management
- 8.1.2. Marketing
- 8.1.3. Operations
- 8.1.4. Finance
- 8.1.5. Sales
- 8.1.6. Other Organizational Departments
- 8.2. Market Analysis, Insights and Forecast - by Deployment Mode
- 8.2.1. On-premise
- 8.2.2. Cloud/On-demand
- 8.3. Market Analysis, Insights and Forecast - by End User
- 8.3.1. BFSI
- 8.3.2. IT and Telecommunication
- 8.3.3. Retail/E-commerce
- 8.3.4. Education
- 8.3.5. Manufacturing
- 8.3.6. Government
- 8.3.7. Other End Users
- 8.1. Market Analysis, Insights and Forecast - by Organizational Department
- 9. Latin America Data Visualization Industry Analysis, Insights and Forecast, 2019-2031
- 9.1. Market Analysis, Insights and Forecast - by Organizational Department
- 9.1.1. Executive Management
- 9.1.2. Marketing
- 9.1.3. Operations
- 9.1.4. Finance
- 9.1.5. Sales
- 9.1.6. Other Organizational Departments
- 9.2. Market Analysis, Insights and Forecast - by Deployment Mode
- 9.2.1. On-premise
- 9.2.2. Cloud/On-demand
- 9.3. Market Analysis, Insights and Forecast - by End User
- 9.3.1. BFSI
- 9.3.2. IT and Telecommunication
- 9.3.3. Retail/E-commerce
- 9.3.4. Education
- 9.3.5. Manufacturing
- 9.3.6. Government
- 9.3.7. Other End Users
- 9.1. Market Analysis, Insights and Forecast - by Organizational Department
- 10. Middle East and Africa Data Visualization Industry Analysis, Insights and Forecast, 2019-2031
- 10.1. Market Analysis, Insights and Forecast - by Organizational Department
- 10.1.1. Executive Management
- 10.1.2. Marketing
- 10.1.3. Operations
- 10.1.4. Finance
- 10.1.5. Sales
- 10.1.6. Other Organizational Departments
- 10.2. Market Analysis, Insights and Forecast - by Deployment Mode
- 10.2.1. On-premise
- 10.2.2. Cloud/On-demand
- 10.3. Market Analysis, Insights and Forecast - by End User
- 10.3.1. BFSI
- 10.3.2. IT and Telecommunication
- 10.3.3. Retail/E-commerce
- 10.3.4. Education
- 10.3.5. Manufacturing
- 10.3.6. Government
- 10.3.7. Other End Users
- 10.1. Market Analysis, Insights and Forecast - by Organizational Department
- 11. North America Data Visualization Industry Analysis, Insights and Forecast, 2019-2031
- 11.1. Market Analysis, Insights and Forecast - By Country/Sub-region
- 11.1.1.
- 12. Europe Data Visualization Industry Analysis, Insights and Forecast, 2019-2031
- 12.1. Market Analysis, Insights and Forecast - By Country/Sub-region
- 12.1.1.
- 13. Asia Pacific Data Visualization Industry Analysis, Insights and Forecast, 2019-2031
- 13.1. Market Analysis, Insights and Forecast - By Country/Sub-region
- 13.1.1.
- 14. Latin America Data Visualization Industry Analysis, Insights and Forecast, 2019-2031
- 14.1. Market Analysis, Insights and Forecast - By Country/Sub-region
- 14.1.1.
- 15. Middle East and Africa Data Visualization Industry Analysis, Insights and Forecast, 2019-2031
- 15.1. Market Analysis, Insights and Forecast - By Country/Sub-region
- 15.1.1.
- 16. Competitive Analysis
- 16.1. Global Market Share Analysis 2024
- 16.2. Company Profiles
- 16.2.1 SAS Institute Inc
- 16.2.1.1. Overview
- 16.2.1.2. Products
- 16.2.1.3. SWOT Analysis
- 16.2.1.4. Recent Developments
- 16.2.1.5. Financials (Based on Availability)
- 16.2.2 InetSoft Technology Corporation
- 16.2.2.1. Overview
- 16.2.2.2. Products
- 16.2.2.3. SWOT Analysis
- 16.2.2.4. Recent Developments
- 16.2.2.5. Financials (Based on Availability)
- 16.2.3 TIBCO Software Inc
- 16.2.3.1. Overview
- 16.2.3.2. Products
- 16.2.3.3. SWOT Analysis
- 16.2.3.4. Recent Developments
- 16.2.3.5. Financials (Based on Availability)
- 16.2.4 IBM Corporation
- 16.2.4.1. Overview
- 16.2.4.2. Products
- 16.2.4.3. SWOT Analysis
- 16.2.4.4. Recent Developments
- 16.2.4.5. Financials (Based on Availability)
- 16.2.5 Microsoft Corporation
- 16.2.5.1. Overview
- 16.2.5.2. Products
- 16.2.5.3. SWOT Analysis
- 16.2.5.4. Recent Developments
- 16.2.5.5. Financials (Based on Availability)
- 16.2.6 Pentaho Corporation
- 16.2.6.1. Overview
- 16.2.6.2. Products
- 16.2.6.3. SWOT Analysis
- 16.2.6.4. Recent Developments
- 16.2.6.5. Financials (Based on Availability)
- 16.2.7 Dundas Data Visualization Inc
- 16.2.7.1. Overview
- 16.2.7.2. Products
- 16.2.7.3. SWOT Analysis
- 16.2.7.4. Recent Developments
- 16.2.7.5. Financials (Based on Availability)
- 16.2.8 Information Builders
- 16.2.8.1. Overview
- 16.2.8.2. Products
- 16.2.8.3. SWOT Analysis
- 16.2.8.4. Recent Developments
- 16.2.8.5. Financials (Based on Availability)
- 16.2.9 Oracle Corporation
- 16.2.9.1. Overview
- 16.2.9.2. Products
- 16.2.9.3. SWOT Analysis
- 16.2.9.4. Recent Developments
- 16.2.9.5. Financials (Based on Availability)
- 16.2.10 Salesforce com Inc (Tableau Software Inc )
- 16.2.10.1. Overview
- 16.2.10.2. Products
- 16.2.10.3. SWOT Analysis
- 16.2.10.4. Recent Developments
- 16.2.10.5. Financials (Based on Availability)
- 16.2.11 SAP SE
- 16.2.11.1. Overview
- 16.2.11.2. Products
- 16.2.11.3. SWOT Analysis
- 16.2.11.4. Recent Developments
- 16.2.11.5. Financials (Based on Availability)
- 16.2.12 MicroStrategy Inc *List Not Exhaustive
- 16.2.12.1. Overview
- 16.2.12.2. Products
- 16.2.12.3. SWOT Analysis
- 16.2.12.4. Recent Developments
- 16.2.12.5. Financials (Based on Availability)
- 16.2.1 SAS Institute Inc
List of Figures
- Figure 1: Global Data Visualization Industry Revenue Breakdown (Million, %) by Region 2024 & 2032
- Figure 2: North America Data Visualization Industry Revenue (Million), by Country 2024 & 2032
- Figure 3: North America Data Visualization Industry Revenue Share (%), by Country 2024 & 2032
- Figure 4: Europe Data Visualization Industry Revenue (Million), by Country 2024 & 2032
- Figure 5: Europe Data Visualization Industry Revenue Share (%), by Country 2024 & 2032
- Figure 6: Asia Pacific Data Visualization Industry Revenue (Million), by Country 2024 & 2032
- Figure 7: Asia Pacific Data Visualization Industry Revenue Share (%), by Country 2024 & 2032
- Figure 8: Latin America Data Visualization Industry Revenue (Million), by Country 2024 & 2032
- Figure 9: Latin America Data Visualization Industry Revenue Share (%), by Country 2024 & 2032
- Figure 10: Middle East and Africa Data Visualization Industry Revenue (Million), by Country 2024 & 2032
- Figure 11: Middle East and Africa Data Visualization Industry Revenue Share (%), by Country 2024 & 2032
- Figure 12: North America Data Visualization Industry Revenue (Million), by Organizational Department 2024 & 2032
- Figure 13: North America Data Visualization Industry Revenue Share (%), by Organizational Department 2024 & 2032
- Figure 14: North America Data Visualization Industry Revenue (Million), by Deployment Mode 2024 & 2032
- Figure 15: North America Data Visualization Industry Revenue Share (%), by Deployment Mode 2024 & 2032
- Figure 16: North America Data Visualization Industry Revenue (Million), by End User 2024 & 2032
- Figure 17: North America Data Visualization Industry Revenue Share (%), by End User 2024 & 2032
- Figure 18: North America Data Visualization Industry Revenue (Million), by Country 2024 & 2032
- Figure 19: North America Data Visualization Industry Revenue Share (%), by Country 2024 & 2032
- Figure 20: Europe Data Visualization Industry Revenue (Million), by Organizational Department 2024 & 2032
- Figure 21: Europe Data Visualization Industry Revenue Share (%), by Organizational Department 2024 & 2032
- Figure 22: Europe Data Visualization Industry Revenue (Million), by Deployment Mode 2024 & 2032
- Figure 23: Europe Data Visualization Industry Revenue Share (%), by Deployment Mode 2024 & 2032
- Figure 24: Europe Data Visualization Industry Revenue (Million), by End User 2024 & 2032
- Figure 25: Europe Data Visualization Industry Revenue Share (%), by End User 2024 & 2032
- Figure 26: Europe Data Visualization Industry Revenue (Million), by Country 2024 & 2032
- Figure 27: Europe Data Visualization Industry Revenue Share (%), by Country 2024 & 2032
- Figure 28: Asia Pacific Data Visualization Industry Revenue (Million), by Organizational Department 2024 & 2032
- Figure 29: Asia Pacific Data Visualization Industry Revenue Share (%), by Organizational Department 2024 & 2032
- Figure 30: Asia Pacific Data Visualization Industry Revenue (Million), by Deployment Mode 2024 & 2032
- Figure 31: Asia Pacific Data Visualization Industry Revenue Share (%), by Deployment Mode 2024 & 2032
- Figure 32: Asia Pacific Data Visualization Industry Revenue (Million), by End User 2024 & 2032
- Figure 33: Asia Pacific Data Visualization Industry Revenue Share (%), by End User 2024 & 2032
- Figure 34: Asia Pacific Data Visualization Industry Revenue (Million), by Country 2024 & 2032
- Figure 35: Asia Pacific Data Visualization Industry Revenue Share (%), by Country 2024 & 2032
- Figure 36: Latin America Data Visualization Industry Revenue (Million), by Organizational Department 2024 & 2032
- Figure 37: Latin America Data Visualization Industry Revenue Share (%), by Organizational Department 2024 & 2032
- Figure 38: Latin America Data Visualization Industry Revenue (Million), by Deployment Mode 2024 & 2032
- Figure 39: Latin America Data Visualization Industry Revenue Share (%), by Deployment Mode 2024 & 2032
- Figure 40: Latin America Data Visualization Industry Revenue (Million), by End User 2024 & 2032
- Figure 41: Latin America Data Visualization Industry Revenue Share (%), by End User 2024 & 2032
- Figure 42: Latin America Data Visualization Industry Revenue (Million), by Country 2024 & 2032
- Figure 43: Latin America Data Visualization Industry Revenue Share (%), by Country 2024 & 2032
- Figure 44: Middle East and Africa Data Visualization Industry Revenue (Million), by Organizational Department 2024 & 2032
- Figure 45: Middle East and Africa Data Visualization Industry Revenue Share (%), by Organizational Department 2024 & 2032
- Figure 46: Middle East and Africa Data Visualization Industry Revenue (Million), by Deployment Mode 2024 & 2032
- Figure 47: Middle East and Africa Data Visualization Industry Revenue Share (%), by Deployment Mode 2024 & 2032
- Figure 48: Middle East and Africa Data Visualization Industry Revenue (Million), by End User 2024 & 2032
- Figure 49: Middle East and Africa Data Visualization Industry Revenue Share (%), by End User 2024 & 2032
- Figure 50: Middle East and Africa Data Visualization Industry Revenue (Million), by Country 2024 & 2032
- Figure 51: Middle East and Africa Data Visualization Industry Revenue Share (%), by Country 2024 & 2032
List of Tables
- Table 1: Global Data Visualization Industry Revenue Million Forecast, by Region 2019 & 2032
- Table 2: Global Data Visualization Industry Revenue Million Forecast, by Organizational Department 2019 & 2032
- Table 3: Global Data Visualization Industry Revenue Million Forecast, by Deployment Mode 2019 & 2032
- Table 4: Global Data Visualization Industry Revenue Million Forecast, by End User 2019 & 2032
- Table 5: Global Data Visualization Industry Revenue Million Forecast, by Region 2019 & 2032
- Table 6: Global Data Visualization Industry Revenue Million Forecast, by Country 2019 & 2032
- Table 7: Data Visualization Industry Revenue (Million) Forecast, by Application 2019 & 2032
- Table 8: Global Data Visualization Industry Revenue Million Forecast, by Country 2019 & 2032
- Table 9: Data Visualization Industry Revenue (Million) Forecast, by Application 2019 & 2032
- Table 10: Global Data Visualization Industry Revenue Million Forecast, by Country 2019 & 2032
- Table 11: Data Visualization Industry Revenue (Million) Forecast, by Application 2019 & 2032
- Table 12: Global Data Visualization Industry Revenue Million Forecast, by Country 2019 & 2032
- Table 13: Data Visualization Industry Revenue (Million) Forecast, by Application 2019 & 2032
- Table 14: Global Data Visualization Industry Revenue Million Forecast, by Country 2019 & 2032
- Table 15: Data Visualization Industry Revenue (Million) Forecast, by Application 2019 & 2032
- Table 16: Global Data Visualization Industry Revenue Million Forecast, by Organizational Department 2019 & 2032
- Table 17: Global Data Visualization Industry Revenue Million Forecast, by Deployment Mode 2019 & 2032
- Table 18: Global Data Visualization Industry Revenue Million Forecast, by End User 2019 & 2032
- Table 19: Global Data Visualization Industry Revenue Million Forecast, by Country 2019 & 2032
- Table 20: Global Data Visualization Industry Revenue Million Forecast, by Organizational Department 2019 & 2032
- Table 21: Global Data Visualization Industry Revenue Million Forecast, by Deployment Mode 2019 & 2032
- Table 22: Global Data Visualization Industry Revenue Million Forecast, by End User 2019 & 2032
- Table 23: Global Data Visualization Industry Revenue Million Forecast, by Country 2019 & 2032
- Table 24: Global Data Visualization Industry Revenue Million Forecast, by Organizational Department 2019 & 2032
- Table 25: Global Data Visualization Industry Revenue Million Forecast, by Deployment Mode 2019 & 2032
- Table 26: Global Data Visualization Industry Revenue Million Forecast, by End User 2019 & 2032
- Table 27: Global Data Visualization Industry Revenue Million Forecast, by Country 2019 & 2032
- Table 28: Global Data Visualization Industry Revenue Million Forecast, by Organizational Department 2019 & 2032
- Table 29: Global Data Visualization Industry Revenue Million Forecast, by Deployment Mode 2019 & 2032
- Table 30: Global Data Visualization Industry Revenue Million Forecast, by End User 2019 & 2032
- Table 31: Global Data Visualization Industry Revenue Million Forecast, by Country 2019 & 2032
- Table 32: Global Data Visualization Industry Revenue Million Forecast, by Organizational Department 2019 & 2032
- Table 33: Global Data Visualization Industry Revenue Million Forecast, by Deployment Mode 2019 & 2032
- Table 34: Global Data Visualization Industry Revenue Million Forecast, by End User 2019 & 2032
- Table 35: Global Data Visualization Industry Revenue Million Forecast, by Country 2019 & 2032
Frequently Asked Questions
1. What is the projected Compound Annual Growth Rate (CAGR) of the Data Visualization Industry?
The projected CAGR is approximately 10.95%.
2. Which companies are prominent players in the Data Visualization Industry?
Key companies in the market include SAS Institute Inc, InetSoft Technology Corporation, TIBCO Software Inc, IBM Corporation, Microsoft Corporation, Pentaho Corporation, Dundas Data Visualization Inc, Information Builders, Oracle Corporation, Salesforce com Inc (Tableau Software Inc ), SAP SE, MicroStrategy Inc *List Not Exhaustive.
3. What are the main segments of the Data Visualization Industry?
The market segments include Organizational Department, Deployment Mode, End User.
4. Can you provide details about the market size?
The market size is estimated to be USD 9.84 Million as of 2022.
5. What are some drivers contributing to market growth?
Cloud Deployment of Data Visualization Solutions; Increasing Need for Quick Decision Making.
6. What are the notable trends driving market growth?
Retail Segment to Witness Significant Growth.
7. Are there any restraints impacting market growth?
Lack of Tech Savvy and Skilled Workforce/Inability.
8. Can you provide examples of recent developments in the market?
September 2022: KPI 360, an AI-driven solution that uses real-time data monitoring and prediction to assist manufacturing organizations in seeing various operational data sources through a single, comprehensive industrial intelligence dashboard that sets up in hours, was recently unveiled by SymphonyAI Industrial.
9. What pricing options are available for accessing the report?
Pricing options include single-user, multi-user, and enterprise licenses priced at USD 4750, USD 5250, and USD 8750 respectively.
10. Is the market size provided in terms of value or volume?
The market size is provided in terms of value, measured in Million.
11. Are there any specific market keywords associated with the report?
Yes, the market keyword associated with the report is "Data Visualization Industry," which aids in identifying and referencing the specific market segment covered.
12. How do I determine which pricing option suits my needs best?
The pricing options vary based on user requirements and access needs. Individual users may opt for single-user licenses, while businesses requiring broader access may choose multi-user or enterprise licenses for cost-effective access to the report.
13. Are there any additional resources or data provided in the Data Visualization Industry report?
While the report offers comprehensive insights, it's advisable to review the specific contents or supplementary materials provided to ascertain if additional resources or data are available.
14. How can I stay updated on further developments or reports in the Data Visualization Industry?
To stay informed about further developments, trends, and reports in the Data Visualization Industry, consider subscribing to industry newsletters, following relevant companies and organizations, or regularly checking reputable industry news sources and publications.
Methodology
Step 1 - Identification of Relevant Samples Size from Population Database


Step 2 - Approaches for Defining Global Market Size (Value, Volume* & Price*)

Note*: In applicable scenarios
Step 3 - Data Sources
Primary Research
- Web Analytics
- Survey Reports
- Research Institute
- Latest Research Reports
- Opinion Leaders
Secondary Research
- Annual Reports
- White Paper
- Latest Press Release
- Industry Association
- Paid Database
- Investor Presentations

Step 4 - Data Triangulation
Involves using different sources of information in order to increase the validity of a study
These sources are likely to be stakeholders in a program - participants, other researchers, program staff, other community members, and so on.
Then we put all data in single framework & apply various statistical tools to find out the dynamic on the market.
During the analysis stage, feedback from the stakeholder groups would be compared to determine areas of agreement as well as areas of divergence


