
Key Insights
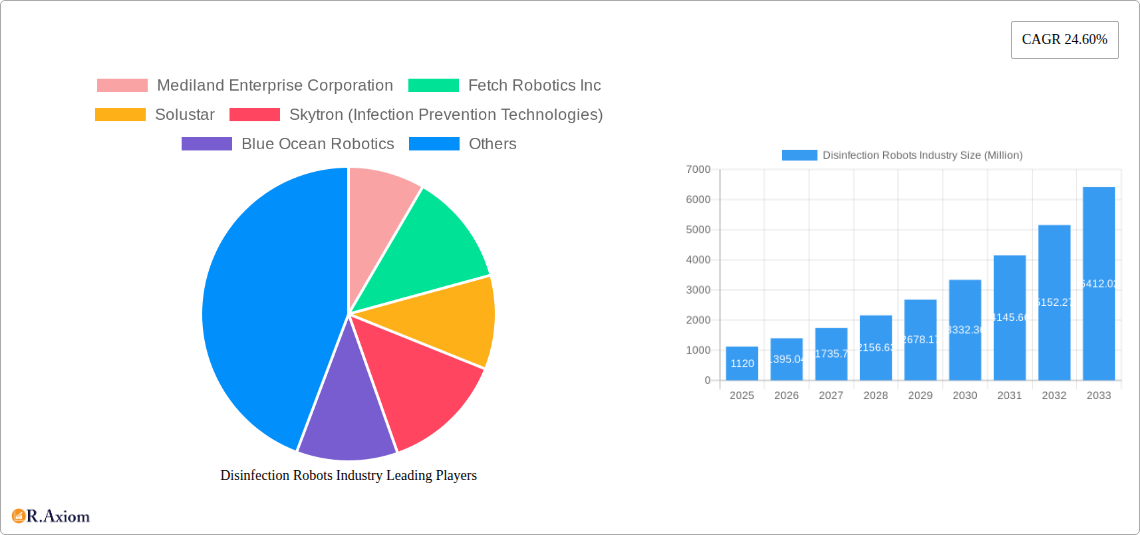
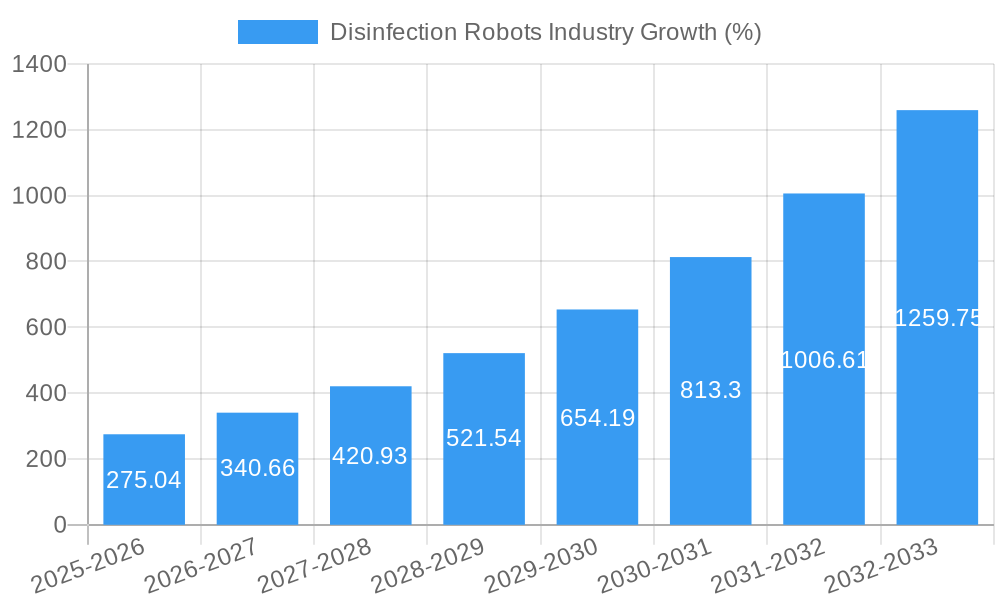
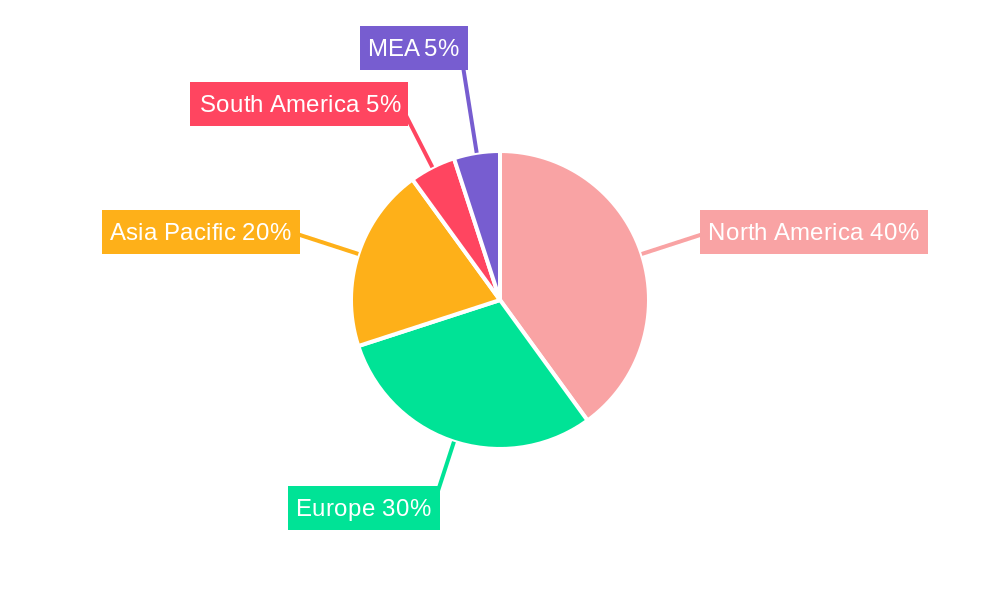
The disinfection robots market is experiencing robust growth, projected to reach $1.12 billion in 2025 and exhibiting a remarkable Compound Annual Growth Rate (CAGR) of 24.60% from 2025 to 2033. This expansion is fueled by several key drivers. The increasing prevalence of healthcare-associated infections (HAIs) necessitates effective and efficient disinfection solutions, pushing demand for autonomous robots capable of eliminating pathogens. Furthermore, the rising adoption of automation in healthcare settings, coupled with labor shortages and the need for improved infection control protocols, is significantly accelerating market growth. Technological advancements, such as the development of more sophisticated UV-C disinfection technologies and AI-powered navigation systems, are also contributing factors. While initial investment costs represent a restraint, the long-term cost savings associated with reduced labor expenses and improved infection control outweigh this factor for many healthcare facilities. Market segmentation reveals that UV-C disinfection robots currently hold a significant share of the market, driven by their proven efficacy and relatively lower cost compared to other technologies like HPV. The geographical distribution of the market shows strong growth across North America and Europe, driven by higher healthcare spending and advanced infrastructure. However, the Asia-Pacific region is expected to witness rapid expansion in the coming years, driven by increasing healthcare awareness and rising disposable incomes.
The competitive landscape is characterized by a mix of established players and emerging startups. Key players such as Xenex Disinfectant Systems, Blue Ocean Robotics, and Mediland Enterprise Corporation are focusing on product innovation and strategic partnerships to maintain their market positions. The ongoing development of advanced features such as improved navigation, real-time data analytics, and integration with hospital management systems will further shape the market trajectory. The market's future hinges on addressing the remaining challenges, including regulatory hurdles, standardization of technology, and cost-effectiveness for smaller healthcare providers. However, given the compelling drivers and the critical role of infection control in healthcare, the disinfection robots market is poised for continued substantial growth throughout the forecast period.
Disinfection Robots Industry: A Comprehensive Market Report (2019-2033)
This detailed report provides a comprehensive analysis of the Disinfection Robots Industry, covering market size, growth drivers, key players, and future trends from 2019 to 2033. The study period spans from 2019 to 2033, with 2025 as the base and estimated year. The forecast period is from 2025 to 2033, and the historical period covers 2019-2024. The report offers actionable insights for industry stakeholders, investors, and businesses involved in this rapidly evolving sector.
Disinfection Robots Industry Market Concentration & Innovation
The Disinfection Robots Industry is characterized by a moderately concentrated market structure with a few key players holding significant market share. While precise market share data for each company is proprietary and unavailable for this report, key players such as Xenex Disinfectant Systems, Blue Ocean Robotics, and others have established strong positions. The industry is witnessing significant innovation driven by the need for effective and efficient disinfection solutions, particularly in healthcare settings. This is reflected in the continuous development of advanced technologies, including UV-C, HPV, and other disinfection methods. Regulatory frameworks, like those concerning medical device approval, play a crucial role in shaping market dynamics. Product substitutes, such as traditional chemical disinfectants, present ongoing competition. However, the increasing demand for automation and reduced infection risk is driving preference for robotic solutions. M&A activities, such as the acquisition of UVD Robots by Ecolab in January 2022, reflect industry consolidation and strategic expansion. These deals have significant impact, with values ranging from xx Million to xx Million USD. Further, the investment of USD 5.7 Million in Sesto Robotics demonstrates investor confidence in the sector's growth potential. This high level of investment underscores the potential of the autonomous mobile robotics market within the disinfection robotics sector.
Disinfection Robots Industry Industry Trends & Insights
The Disinfection Robots Industry is experiencing robust growth, driven by several key factors. The global market is expected to exhibit a Compound Annual Growth Rate (CAGR) of xx% during the forecast period (2025-2033). This growth is fueled by the increasing prevalence of hospital-acquired infections, rising demand for hygiene in healthcare and non-healthcare settings, and the growing adoption of automation technologies. Technological advancements, such as the development of more effective UV-C and HPV disinfection systems, are further propelling market expansion. Consumer preferences are shifting towards automated and efficient disinfection solutions, particularly in light of recent global health crises. Competitive dynamics are marked by continuous innovation, strategic partnerships, and acquisitions. Market penetration is steadily increasing across various sectors, including healthcare, hospitality, and manufacturing. This steady growth is expected to create significant opportunities for players. The market's expansion is closely tied to global healthcare expenditure and increasing focus on infection control measures.
Dominant Markets & Segments in Disinfection Robots Industry
The healthcare sector currently represents the dominant market for disinfection robots, with hospitals and clinics leading the demand. Within product types, UV-C disinfection robots hold the largest market share, due to their proven efficacy and relative ease of implementation. The North American and European regions are currently leading in terms of market adoption.
- Key Drivers in Dominant Regions:
- North America: Strong healthcare infrastructure, high adoption of advanced technologies, and stringent infection control regulations.
- Europe: Similar to North America, high healthcare standards and investments in technological solutions for infection prevention.
- Asia-Pacific: Rapidly growing healthcare sector, increasing awareness of infection control, and government initiatives promoting technological adoption.
The dominance of these regions and sectors stems from several factors: higher disposable incomes, robust healthcare infrastructure, stringent infection control regulations, and early adoption of advanced technologies. However, emerging economies in Asia and other regions are expected to show strong growth potential due to increasing healthcare expenditure and rising awareness of hygiene practices.
Disinfection Robots Industry Product Developments
Recent product innovations focus on enhancing disinfection efficacy, improving user-friendliness, and expanding applications beyond healthcare settings. This includes the development of autonomous navigation systems, advanced sensor technologies for real-time feedback, and specialized disinfection mechanisms optimized for various surface types. The integration of AI and machine learning is also enhancing the capabilities of disinfection robots, allowing for more efficient and targeted disinfection processes. These technological advancements are directly translating into a stronger market fit, meeting the growing demand for effective and user-friendly solutions across multiple sectors.
Report Scope & Segmentation Analysis
This report segments the disinfection robots market primarily by product type: UV-C, HPV, and Others.
UV-C Disinfection Robots: This segment dominates the market due to the proven efficacy of UV-C light in killing pathogens. The market is expected to witness significant growth, driven by ongoing technological improvements and increasing demand from healthcare facilities.
HPV Disinfection Robots: This segment is witnessing emerging growth, driven by technological advancements and the potential for broader applications beyond traditional healthcare settings. Market size is currently smaller than UV-C, but its growth rate may be higher due to innovations.
Others: This segment encompasses various other disinfection technologies, such as those using chemicals or other methods. While this segment might be smaller than the previous two, niche technologies might find market entry into high-value areas with specific infection control needs.
Each segment shows different competitive dynamics with varied growth projections and market size projections.
Key Drivers of Disinfection Robots Industry Growth
Several factors are driving the growth of the disinfection robots industry. The rising prevalence of healthcare-associated infections (HAIs) necessitates effective infection control measures. Government regulations and initiatives promoting hygiene standards in various sectors are also contributing to increased demand. Furthermore, technological advancements, including the development of more efficient and autonomous disinfection robots, are further propelling market growth. The increasing adoption of automation in various industries is also driving market expansion. The cost-effectiveness of robotic disinfection compared to traditional methods, as well as the need for staff protection from pathogens, are also substantial contributing factors.
Challenges in the Disinfection Robots Industry Sector
The Disinfection Robots Industry faces several challenges, including the high initial investment cost of robots, potential regulatory hurdles for medical device approval, and the need for skilled personnel to operate and maintain these systems. Supply chain disruptions can also impact production and availability, while competition from traditional disinfection methods and other emerging technologies presents continuous pressure. The complexity of integrating robots into existing workflows is also a considerable hurdle.
Emerging Opportunities in Disinfection Robots Industry
Emerging opportunities in this industry include expanding into new market segments, such as food processing, manufacturing, and public spaces. The development of more specialized robots tailored to specific disinfection needs, the integration of advanced technologies such as AI and IoT, and the potential for subscription-based service models can present significant opportunities for growth and market expansion.
Leading Players in the Disinfection Robots Industry Market
- Mediland Enterprise Corporation
- Fetch Robotics Inc
- Solustar
- Skytron (Infection Prevention Technologies)
- Blue Ocean Robotics
- Decon-X International
- Xenex Disinfectant Systems
- Bridgeport Magnetics
- Akara Robotics Ltd
- OTSAW Digital Pte Ltd
- Tru-d Smartuvc
- Ateago Technology
- MTR Corporation (Joint venture)
- Time Medical Holding Robotics
- Finsen Technologies (Thor UV-C)
- Bioquell PLC (Ecolab Inc )
- Tmirob Technology
- AUDITE Robotic
Key Developments in Disinfection Robots Industry Industry
- January 2022: Blue Ocean Robotics' UVD Robots joined Ecolab's global infection prevention offerings, expanding market reach and distribution.
- January 2022: Sesto Robotics secured USD 5.7 Million in investment, highlighting investor confidence in the sector's growth.
Strategic Outlook for Disinfection Robots Industry Market
The Disinfection Robots Industry is poised for significant growth, driven by technological advancements, increasing demand for hygiene, and favorable regulatory environments. The market's future potential lies in expanding into new sectors, developing innovative disinfection technologies, and leveraging strategic partnerships to enhance market penetration. The focus on improving robot autonomy, ease of use, and cost-effectiveness will be crucial for sustained market growth in the coming years.
Disinfection Robots Industry Segmentation
-
1. Product Type
- 1.1. UV-C
- 1.2. HPV and Others
Disinfection Robots Industry Segmentation By Geography
- 1. North America
- 2. Europe
- 3. Asia Pacific
- 4. Rest of the World
Disinfection Robots Industry REPORT HIGHLIGHTS
| Aspects | Details |
|---|---|
| Study Period | 2019-2033 |
| Base Year | 2024 |
| Estimated Year | 2025 |
| Forecast Period | 2025-2033 |
| Historical Period | 2019-2024 |
| Growth Rate | CAGR of 24.60% from 2019-2033 |
| Segmentation |
|
Table of Contents
- 1. Introduction
- 1.1. Research Scope
- 1.2. Market Segmentation
- 1.3. Research Methodology
- 1.4. Definitions and Assumptions
- 2. Executive Summary
- 2.1. Introduction
- 3. Market Dynamics
- 3.1. Introduction
- 3.2. Market Drivers
- 3.2.1. High Incidence of Hospital-acquired Infections in Major Markets Worldwide; Technological Advancements Enable Robots to Operate as a Value-added Entity (Collaborative) in the Disinfection Process; Rapid Rise in Healthcare and Sanitation Spending due to the COVID-19 Outbreak; High Investments in the Field of Disinfectant Robots
- 3.3. Market Restrains
- 3.3.1. Budget Constraints Related to Software Implementation
- 3.4. Market Trends
- 3.4.1. Technological Advancements to Enable Robots to Operate as a Value-added Entity (Collaborative) in the Disinfection Process
- 4. Market Factor Analysis
- 4.1. Porters Five Forces
- 4.2. Supply/Value Chain
- 4.3. PESTEL analysis
- 4.4. Market Entropy
- 4.5. Patent/Trademark Analysis
- 5. Global Disinfection Robots Industry Analysis, Insights and Forecast, 2019-2031
- 5.1. Market Analysis, Insights and Forecast - by Product Type
- 5.1.1. UV-C
- 5.1.2. HPV and Others
- 5.2. Market Analysis, Insights and Forecast - by Region
- 5.2.1. North America
- 5.2.2. Europe
- 5.2.3. Asia Pacific
- 5.2.4. Rest of the World
- 5.1. Market Analysis, Insights and Forecast - by Product Type
- 6. North America Disinfection Robots Industry Analysis, Insights and Forecast, 2019-2031
- 6.1. Market Analysis, Insights and Forecast - by Product Type
- 6.1.1. UV-C
- 6.1.2. HPV and Others
- 6.1. Market Analysis, Insights and Forecast - by Product Type
- 7. Europe Disinfection Robots Industry Analysis, Insights and Forecast, 2019-2031
- 7.1. Market Analysis, Insights and Forecast - by Product Type
- 7.1.1. UV-C
- 7.1.2. HPV and Others
- 7.1. Market Analysis, Insights and Forecast - by Product Type
- 8. Asia Pacific Disinfection Robots Industry Analysis, Insights and Forecast, 2019-2031
- 8.1. Market Analysis, Insights and Forecast - by Product Type
- 8.1.1. UV-C
- 8.1.2. HPV and Others
- 8.1. Market Analysis, Insights and Forecast - by Product Type
- 9. Rest of the World Disinfection Robots Industry Analysis, Insights and Forecast, 2019-2031
- 9.1. Market Analysis, Insights and Forecast - by Product Type
- 9.1.1. UV-C
- 9.1.2. HPV and Others
- 9.1. Market Analysis, Insights and Forecast - by Product Type
- 10. North America Disinfection Robots Industry Analysis, Insights and Forecast, 2019-2031
- 10.1. Market Analysis, Insights and Forecast - By Country/Sub-region
- 10.1.1 United States
- 10.1.2 Canada
- 10.1.3 Mexico
- 11. Europe Disinfection Robots Industry Analysis, Insights and Forecast, 2019-2031
- 11.1. Market Analysis, Insights and Forecast - By Country/Sub-region
- 11.1.1 Germany
- 11.1.2 United Kingdom
- 11.1.3 France
- 11.1.4 Spain
- 11.1.5 Italy
- 11.1.6 Spain
- 11.1.7 Belgium
- 11.1.8 Netherland
- 11.1.9 Nordics
- 11.1.10 Rest of Europe
- 12. Asia Pacific Disinfection Robots Industry Analysis, Insights and Forecast, 2019-2031
- 12.1. Market Analysis, Insights and Forecast - By Country/Sub-region
- 12.1.1 China
- 12.1.2 Japan
- 12.1.3 India
- 12.1.4 South Korea
- 12.1.5 Southeast Asia
- 12.1.6 Australia
- 12.1.7 Indonesia
- 12.1.8 Phillipes
- 12.1.9 Singapore
- 12.1.10 Thailandc
- 12.1.11 Rest of Asia Pacific
- 13. South America Disinfection Robots Industry Analysis, Insights and Forecast, 2019-2031
- 13.1. Market Analysis, Insights and Forecast - By Country/Sub-region
- 13.1.1 Brazil
- 13.1.2 Argentina
- 13.1.3 Peru
- 13.1.4 Chile
- 13.1.5 Colombia
- 13.1.6 Ecuador
- 13.1.7 Venezuela
- 13.1.8 Rest of South America
- 14. North America Disinfection Robots Industry Analysis, Insights and Forecast, 2019-2031
- 14.1. Market Analysis, Insights and Forecast - By Country/Sub-region
- 14.1.1 United States
- 14.1.2 Canada
- 14.1.3 Mexico
- 15. MEA Disinfection Robots Industry Analysis, Insights and Forecast, 2019-2031
- 15.1. Market Analysis, Insights and Forecast - By Country/Sub-region
- 15.1.1 United Arab Emirates
- 15.1.2 Saudi Arabia
- 15.1.3 South Africa
- 15.1.4 Rest of Middle East and Africa
- 16. Competitive Analysis
- 16.1. Global Market Share Analysis 2024
- 16.2. Company Profiles
- 16.2.1 Mediland Enterprise Corporation
- 16.2.1.1. Overview
- 16.2.1.2. Products
- 16.2.1.3. SWOT Analysis
- 16.2.1.4. Recent Developments
- 16.2.1.5. Financials (Based on Availability)
- 16.2.2 Fetch Robotics Inc
- 16.2.2.1. Overview
- 16.2.2.2. Products
- 16.2.2.3. SWOT Analysis
- 16.2.2.4. Recent Developments
- 16.2.2.5. Financials (Based on Availability)
- 16.2.3 Solustar
- 16.2.3.1. Overview
- 16.2.3.2. Products
- 16.2.3.3. SWOT Analysis
- 16.2.3.4. Recent Developments
- 16.2.3.5. Financials (Based on Availability)
- 16.2.4 Skytron (Infection Prevention Technologies)
- 16.2.4.1. Overview
- 16.2.4.2. Products
- 16.2.4.3. SWOT Analysis
- 16.2.4.4. Recent Developments
- 16.2.4.5. Financials (Based on Availability)
- 16.2.5 Blue Ocean Robotics
- 16.2.5.1. Overview
- 16.2.5.2. Products
- 16.2.5.3. SWOT Analysis
- 16.2.5.4. Recent Developments
- 16.2.5.5. Financials (Based on Availability)
- 16.2.6 Decon-X International
- 16.2.6.1. Overview
- 16.2.6.2. Products
- 16.2.6.3. SWOT Analysis
- 16.2.6.4. Recent Developments
- 16.2.6.5. Financials (Based on Availability)
- 16.2.7 Xenex Disinfectant Systems
- 16.2.7.1. Overview
- 16.2.7.2. Products
- 16.2.7.3. SWOT Analysis
- 16.2.7.4. Recent Developments
- 16.2.7.5. Financials (Based on Availability)
- 16.2.8 Bridgeport Magnetics
- 16.2.8.1. Overview
- 16.2.8.2. Products
- 16.2.8.3. SWOT Analysis
- 16.2.8.4. Recent Developments
- 16.2.8.5. Financials (Based on Availability)
- 16.2.9 Akara Robotics Ltd
- 16.2.9.1. Overview
- 16.2.9.2. Products
- 16.2.9.3. SWOT Analysis
- 16.2.9.4. Recent Developments
- 16.2.9.5. Financials (Based on Availability)
- 16.2.10 OTSAW Digital Pte Ltd
- 16.2.10.1. Overview
- 16.2.10.2. Products
- 16.2.10.3. SWOT Analysis
- 16.2.10.4. Recent Developments
- 16.2.10.5. Financials (Based on Availability)
- 16.2.11 Tru-d Smartuvc
- 16.2.11.1. Overview
- 16.2.11.2. Products
- 16.2.11.3. SWOT Analysis
- 16.2.11.4. Recent Developments
- 16.2.11.5. Financials (Based on Availability)
- 16.2.12 Ateago Technology
- 16.2.12.1. Overview
- 16.2.12.2. Products
- 16.2.12.3. SWOT Analysis
- 16.2.12.4. Recent Developments
- 16.2.12.5. Financials (Based on Availability)
- 16.2.13 MTR Corporation (Joint venture)
- 16.2.13.1. Overview
- 16.2.13.2. Products
- 16.2.13.3. SWOT Analysis
- 16.2.13.4. Recent Developments
- 16.2.13.5. Financials (Based on Availability)
- 16.2.14 Time Medical Holding Robotics
- 16.2.14.1. Overview
- 16.2.14.2. Products
- 16.2.14.3. SWOT Analysis
- 16.2.14.4. Recent Developments
- 16.2.14.5. Financials (Based on Availability)
- 16.2.15 Finsen Technologies (Thor UV-C)
- 16.2.15.1. Overview
- 16.2.15.2. Products
- 16.2.15.3. SWOT Analysis
- 16.2.15.4. Recent Developments
- 16.2.15.5. Financials (Based on Availability)
- 16.2.16 Bioquell PLC (Ecolab Inc )
- 16.2.16.1. Overview
- 16.2.16.2. Products
- 16.2.16.3. SWOT Analysis
- 16.2.16.4. Recent Developments
- 16.2.16.5. Financials (Based on Availability)
- 16.2.17 Tmirob Technology
- 16.2.17.1. Overview
- 16.2.17.2. Products
- 16.2.17.3. SWOT Analysis
- 16.2.17.4. Recent Developments
- 16.2.17.5. Financials (Based on Availability)
- 16.2.18 AUDITE Robotic
- 16.2.18.1. Overview
- 16.2.18.2. Products
- 16.2.18.3. SWOT Analysis
- 16.2.18.4. Recent Developments
- 16.2.18.5. Financials (Based on Availability)
- 16.2.1 Mediland Enterprise Corporation
List of Figures
- Figure 1: Global Disinfection Robots Industry Revenue Breakdown (Million, %) by Region 2024 & 2032
- Figure 2: Global Disinfection Robots Industry Volume Breakdown (K Unit, %) by Region 2024 & 2032
- Figure 3: North America Disinfection Robots Industry Revenue (Million), by Country 2024 & 2032
- Figure 4: North America Disinfection Robots Industry Volume (K Unit), by Country 2024 & 2032
- Figure 5: North America Disinfection Robots Industry Revenue Share (%), by Country 2024 & 2032
- Figure 6: North America Disinfection Robots Industry Volume Share (%), by Country 2024 & 2032
- Figure 7: Europe Disinfection Robots Industry Revenue (Million), by Country 2024 & 2032
- Figure 8: Europe Disinfection Robots Industry Volume (K Unit), by Country 2024 & 2032
- Figure 9: Europe Disinfection Robots Industry Revenue Share (%), by Country 2024 & 2032
- Figure 10: Europe Disinfection Robots Industry Volume Share (%), by Country 2024 & 2032
- Figure 11: Asia Pacific Disinfection Robots Industry Revenue (Million), by Country 2024 & 2032
- Figure 12: Asia Pacific Disinfection Robots Industry Volume (K Unit), by Country 2024 & 2032
- Figure 13: Asia Pacific Disinfection Robots Industry Revenue Share (%), by Country 2024 & 2032
- Figure 14: Asia Pacific Disinfection Robots Industry Volume Share (%), by Country 2024 & 2032
- Figure 15: South America Disinfection Robots Industry Revenue (Million), by Country 2024 & 2032
- Figure 16: South America Disinfection Robots Industry Volume (K Unit), by Country 2024 & 2032
- Figure 17: South America Disinfection Robots Industry Revenue Share (%), by Country 2024 & 2032
- Figure 18: South America Disinfection Robots Industry Volume Share (%), by Country 2024 & 2032
- Figure 19: North America Disinfection Robots Industry Revenue (Million), by Country 2024 & 2032
- Figure 20: North America Disinfection Robots Industry Volume (K Unit), by Country 2024 & 2032
- Figure 21: North America Disinfection Robots Industry Revenue Share (%), by Country 2024 & 2032
- Figure 22: North America Disinfection Robots Industry Volume Share (%), by Country 2024 & 2032
- Figure 23: MEA Disinfection Robots Industry Revenue (Million), by Country 2024 & 2032
- Figure 24: MEA Disinfection Robots Industry Volume (K Unit), by Country 2024 & 2032
- Figure 25: MEA Disinfection Robots Industry Revenue Share (%), by Country 2024 & 2032
- Figure 26: MEA Disinfection Robots Industry Volume Share (%), by Country 2024 & 2032
- Figure 27: North America Disinfection Robots Industry Revenue (Million), by Product Type 2024 & 2032
- Figure 28: North America Disinfection Robots Industry Volume (K Unit), by Product Type 2024 & 2032
- Figure 29: North America Disinfection Robots Industry Revenue Share (%), by Product Type 2024 & 2032
- Figure 30: North America Disinfection Robots Industry Volume Share (%), by Product Type 2024 & 2032
- Figure 31: North America Disinfection Robots Industry Revenue (Million), by Country 2024 & 2032
- Figure 32: North America Disinfection Robots Industry Volume (K Unit), by Country 2024 & 2032
- Figure 33: North America Disinfection Robots Industry Revenue Share (%), by Country 2024 & 2032
- Figure 34: North America Disinfection Robots Industry Volume Share (%), by Country 2024 & 2032
- Figure 35: Europe Disinfection Robots Industry Revenue (Million), by Product Type 2024 & 2032
- Figure 36: Europe Disinfection Robots Industry Volume (K Unit), by Product Type 2024 & 2032
- Figure 37: Europe Disinfection Robots Industry Revenue Share (%), by Product Type 2024 & 2032
- Figure 38: Europe Disinfection Robots Industry Volume Share (%), by Product Type 2024 & 2032
- Figure 39: Europe Disinfection Robots Industry Revenue (Million), by Country 2024 & 2032
- Figure 40: Europe Disinfection Robots Industry Volume (K Unit), by Country 2024 & 2032
- Figure 41: Europe Disinfection Robots Industry Revenue Share (%), by Country 2024 & 2032
- Figure 42: Europe Disinfection Robots Industry Volume Share (%), by Country 2024 & 2032
- Figure 43: Asia Pacific Disinfection Robots Industry Revenue (Million), by Product Type 2024 & 2032
- Figure 44: Asia Pacific Disinfection Robots Industry Volume (K Unit), by Product Type 2024 & 2032
- Figure 45: Asia Pacific Disinfection Robots Industry Revenue Share (%), by Product Type 2024 & 2032
- Figure 46: Asia Pacific Disinfection Robots Industry Volume Share (%), by Product Type 2024 & 2032
- Figure 47: Asia Pacific Disinfection Robots Industry Revenue (Million), by Country 2024 & 2032
- Figure 48: Asia Pacific Disinfection Robots Industry Volume (K Unit), by Country 2024 & 2032
- Figure 49: Asia Pacific Disinfection Robots Industry Revenue Share (%), by Country 2024 & 2032
- Figure 50: Asia Pacific Disinfection Robots Industry Volume Share (%), by Country 2024 & 2032
- Figure 51: Rest of the World Disinfection Robots Industry Revenue (Million), by Product Type 2024 & 2032
- Figure 52: Rest of the World Disinfection Robots Industry Volume (K Unit), by Product Type 2024 & 2032
- Figure 53: Rest of the World Disinfection Robots Industry Revenue Share (%), by Product Type 2024 & 2032
- Figure 54: Rest of the World Disinfection Robots Industry Volume Share (%), by Product Type 2024 & 2032
- Figure 55: Rest of the World Disinfection Robots Industry Revenue (Million), by Country 2024 & 2032
- Figure 56: Rest of the World Disinfection Robots Industry Volume (K Unit), by Country 2024 & 2032
- Figure 57: Rest of the World Disinfection Robots Industry Revenue Share (%), by Country 2024 & 2032
- Figure 58: Rest of the World Disinfection Robots Industry Volume Share (%), by Country 2024 & 2032
List of Tables
- Table 1: Global Disinfection Robots Industry Revenue Million Forecast, by Region 2019 & 2032
- Table 2: Global Disinfection Robots Industry Volume K Unit Forecast, by Region 2019 & 2032
- Table 3: Global Disinfection Robots Industry Revenue Million Forecast, by Product Type 2019 & 2032
- Table 4: Global Disinfection Robots Industry Volume K Unit Forecast, by Product Type 2019 & 2032
- Table 5: Global Disinfection Robots Industry Revenue Million Forecast, by Region 2019 & 2032
- Table 6: Global Disinfection Robots Industry Volume K Unit Forecast, by Region 2019 & 2032
- Table 7: Global Disinfection Robots Industry Revenue Million Forecast, by Country 2019 & 2032
- Table 8: Global Disinfection Robots Industry Volume K Unit Forecast, by Country 2019 & 2032
- Table 9: United States Disinfection Robots Industry Revenue (Million) Forecast, by Application 2019 & 2032
- Table 10: United States Disinfection Robots Industry Volume (K Unit) Forecast, by Application 2019 & 2032
- Table 11: Canada Disinfection Robots Industry Revenue (Million) Forecast, by Application 2019 & 2032
- Table 12: Canada Disinfection Robots Industry Volume (K Unit) Forecast, by Application 2019 & 2032
- Table 13: Mexico Disinfection Robots Industry Revenue (Million) Forecast, by Application 2019 & 2032
- Table 14: Mexico Disinfection Robots Industry Volume (K Unit) Forecast, by Application 2019 & 2032
- Table 15: Global Disinfection Robots Industry Revenue Million Forecast, by Country 2019 & 2032
- Table 16: Global Disinfection Robots Industry Volume K Unit Forecast, by Country 2019 & 2032
- Table 17: Germany Disinfection Robots Industry Revenue (Million) Forecast, by Application 2019 & 2032
- Table 18: Germany Disinfection Robots Industry Volume (K Unit) Forecast, by Application 2019 & 2032
- Table 19: United Kingdom Disinfection Robots Industry Revenue (Million) Forecast, by Application 2019 & 2032
- Table 20: United Kingdom Disinfection Robots Industry Volume (K Unit) Forecast, by Application 2019 & 2032
- Table 21: France Disinfection Robots Industry Revenue (Million) Forecast, by Application 2019 & 2032
- Table 22: France Disinfection Robots Industry Volume (K Unit) Forecast, by Application 2019 & 2032
- Table 23: Spain Disinfection Robots Industry Revenue (Million) Forecast, by Application 2019 & 2032
- Table 24: Spain Disinfection Robots Industry Volume (K Unit) Forecast, by Application 2019 & 2032
- Table 25: Italy Disinfection Robots Industry Revenue (Million) Forecast, by Application 2019 & 2032
- Table 26: Italy Disinfection Robots Industry Volume (K Unit) Forecast, by Application 2019 & 2032
- Table 27: Spain Disinfection Robots Industry Revenue (Million) Forecast, by Application 2019 & 2032
- Table 28: Spain Disinfection Robots Industry Volume (K Unit) Forecast, by Application 2019 & 2032
- Table 29: Belgium Disinfection Robots Industry Revenue (Million) Forecast, by Application 2019 & 2032
- Table 30: Belgium Disinfection Robots Industry Volume (K Unit) Forecast, by Application 2019 & 2032
- Table 31: Netherland Disinfection Robots Industry Revenue (Million) Forecast, by Application 2019 & 2032
- Table 32: Netherland Disinfection Robots Industry Volume (K Unit) Forecast, by Application 2019 & 2032
- Table 33: Nordics Disinfection Robots Industry Revenue (Million) Forecast, by Application 2019 & 2032
- Table 34: Nordics Disinfection Robots Industry Volume (K Unit) Forecast, by Application 2019 & 2032
- Table 35: Rest of Europe Disinfection Robots Industry Revenue (Million) Forecast, by Application 2019 & 2032
- Table 36: Rest of Europe Disinfection Robots Industry Volume (K Unit) Forecast, by Application 2019 & 2032
- Table 37: Global Disinfection Robots Industry Revenue Million Forecast, by Country 2019 & 2032
- Table 38: Global Disinfection Robots Industry Volume K Unit Forecast, by Country 2019 & 2032
- Table 39: China Disinfection Robots Industry Revenue (Million) Forecast, by Application 2019 & 2032
- Table 40: China Disinfection Robots Industry Volume (K Unit) Forecast, by Application 2019 & 2032
- Table 41: Japan Disinfection Robots Industry Revenue (Million) Forecast, by Application 2019 & 2032
- Table 42: Japan Disinfection Robots Industry Volume (K Unit) Forecast, by Application 2019 & 2032
- Table 43: India Disinfection Robots Industry Revenue (Million) Forecast, by Application 2019 & 2032
- Table 44: India Disinfection Robots Industry Volume (K Unit) Forecast, by Application 2019 & 2032
- Table 45: South Korea Disinfection Robots Industry Revenue (Million) Forecast, by Application 2019 & 2032
- Table 46: South Korea Disinfection Robots Industry Volume (K Unit) Forecast, by Application 2019 & 2032
- Table 47: Southeast Asia Disinfection Robots Industry Revenue (Million) Forecast, by Application 2019 & 2032
- Table 48: Southeast Asia Disinfection Robots Industry Volume (K Unit) Forecast, by Application 2019 & 2032
- Table 49: Australia Disinfection Robots Industry Revenue (Million) Forecast, by Application 2019 & 2032
- Table 50: Australia Disinfection Robots Industry Volume (K Unit) Forecast, by Application 2019 & 2032
- Table 51: Indonesia Disinfection Robots Industry Revenue (Million) Forecast, by Application 2019 & 2032
- Table 52: Indonesia Disinfection Robots Industry Volume (K Unit) Forecast, by Application 2019 & 2032
- Table 53: Phillipes Disinfection Robots Industry Revenue (Million) Forecast, by Application 2019 & 2032
- Table 54: Phillipes Disinfection Robots Industry Volume (K Unit) Forecast, by Application 2019 & 2032
- Table 55: Singapore Disinfection Robots Industry Revenue (Million) Forecast, by Application 2019 & 2032
- Table 56: Singapore Disinfection Robots Industry Volume (K Unit) Forecast, by Application 2019 & 2032
- Table 57: Thailandc Disinfection Robots Industry Revenue (Million) Forecast, by Application 2019 & 2032
- Table 58: Thailandc Disinfection Robots Industry Volume (K Unit) Forecast, by Application 2019 & 2032
- Table 59: Rest of Asia Pacific Disinfection Robots Industry Revenue (Million) Forecast, by Application 2019 & 2032
- Table 60: Rest of Asia Pacific Disinfection Robots Industry Volume (K Unit) Forecast, by Application 2019 & 2032
- Table 61: Global Disinfection Robots Industry Revenue Million Forecast, by Country 2019 & 2032
- Table 62: Global Disinfection Robots Industry Volume K Unit Forecast, by Country 2019 & 2032
- Table 63: Brazil Disinfection Robots Industry Revenue (Million) Forecast, by Application 2019 & 2032
- Table 64: Brazil Disinfection Robots Industry Volume (K Unit) Forecast, by Application 2019 & 2032
- Table 65: Argentina Disinfection Robots Industry Revenue (Million) Forecast, by Application 2019 & 2032
- Table 66: Argentina Disinfection Robots Industry Volume (K Unit) Forecast, by Application 2019 & 2032
- Table 67: Peru Disinfection Robots Industry Revenue (Million) Forecast, by Application 2019 & 2032
- Table 68: Peru Disinfection Robots Industry Volume (K Unit) Forecast, by Application 2019 & 2032
- Table 69: Chile Disinfection Robots Industry Revenue (Million) Forecast, by Application 2019 & 2032
- Table 70: Chile Disinfection Robots Industry Volume (K Unit) Forecast, by Application 2019 & 2032
- Table 71: Colombia Disinfection Robots Industry Revenue (Million) Forecast, by Application 2019 & 2032
- Table 72: Colombia Disinfection Robots Industry Volume (K Unit) Forecast, by Application 2019 & 2032
- Table 73: Ecuador Disinfection Robots Industry Revenue (Million) Forecast, by Application 2019 & 2032
- Table 74: Ecuador Disinfection Robots Industry Volume (K Unit) Forecast, by Application 2019 & 2032
- Table 75: Venezuela Disinfection Robots Industry Revenue (Million) Forecast, by Application 2019 & 2032
- Table 76: Venezuela Disinfection Robots Industry Volume (K Unit) Forecast, by Application 2019 & 2032
- Table 77: Rest of South America Disinfection Robots Industry Revenue (Million) Forecast, by Application 2019 & 2032
- Table 78: Rest of South America Disinfection Robots Industry Volume (K Unit) Forecast, by Application 2019 & 2032
- Table 79: Global Disinfection Robots Industry Revenue Million Forecast, by Country 2019 & 2032
- Table 80: Global Disinfection Robots Industry Volume K Unit Forecast, by Country 2019 & 2032
- Table 81: United States Disinfection Robots Industry Revenue (Million) Forecast, by Application 2019 & 2032
- Table 82: United States Disinfection Robots Industry Volume (K Unit) Forecast, by Application 2019 & 2032
- Table 83: Canada Disinfection Robots Industry Revenue (Million) Forecast, by Application 2019 & 2032
- Table 84: Canada Disinfection Robots Industry Volume (K Unit) Forecast, by Application 2019 & 2032
- Table 85: Mexico Disinfection Robots Industry Revenue (Million) Forecast, by Application 2019 & 2032
- Table 86: Mexico Disinfection Robots Industry Volume (K Unit) Forecast, by Application 2019 & 2032
- Table 87: Global Disinfection Robots Industry Revenue Million Forecast, by Country 2019 & 2032
- Table 88: Global Disinfection Robots Industry Volume K Unit Forecast, by Country 2019 & 2032
- Table 89: United Arab Emirates Disinfection Robots Industry Revenue (Million) Forecast, by Application 2019 & 2032
- Table 90: United Arab Emirates Disinfection Robots Industry Volume (K Unit) Forecast, by Application 2019 & 2032
- Table 91: Saudi Arabia Disinfection Robots Industry Revenue (Million) Forecast, by Application 2019 & 2032
- Table 92: Saudi Arabia Disinfection Robots Industry Volume (K Unit) Forecast, by Application 2019 & 2032
- Table 93: South Africa Disinfection Robots Industry Revenue (Million) Forecast, by Application 2019 & 2032
- Table 94: South Africa Disinfection Robots Industry Volume (K Unit) Forecast, by Application 2019 & 2032
- Table 95: Rest of Middle East and Africa Disinfection Robots Industry Revenue (Million) Forecast, by Application 2019 & 2032
- Table 96: Rest of Middle East and Africa Disinfection Robots Industry Volume (K Unit) Forecast, by Application 2019 & 2032
- Table 97: Global Disinfection Robots Industry Revenue Million Forecast, by Product Type 2019 & 2032
- Table 98: Global Disinfection Robots Industry Volume K Unit Forecast, by Product Type 2019 & 2032
- Table 99: Global Disinfection Robots Industry Revenue Million Forecast, by Country 2019 & 2032
- Table 100: Global Disinfection Robots Industry Volume K Unit Forecast, by Country 2019 & 2032
- Table 101: Global Disinfection Robots Industry Revenue Million Forecast, by Product Type 2019 & 2032
- Table 102: Global Disinfection Robots Industry Volume K Unit Forecast, by Product Type 2019 & 2032
- Table 103: Global Disinfection Robots Industry Revenue Million Forecast, by Country 2019 & 2032
- Table 104: Global Disinfection Robots Industry Volume K Unit Forecast, by Country 2019 & 2032
- Table 105: Global Disinfection Robots Industry Revenue Million Forecast, by Product Type 2019 & 2032
- Table 106: Global Disinfection Robots Industry Volume K Unit Forecast, by Product Type 2019 & 2032
- Table 107: Global Disinfection Robots Industry Revenue Million Forecast, by Country 2019 & 2032
- Table 108: Global Disinfection Robots Industry Volume K Unit Forecast, by Country 2019 & 2032
- Table 109: Global Disinfection Robots Industry Revenue Million Forecast, by Product Type 2019 & 2032
- Table 110: Global Disinfection Robots Industry Volume K Unit Forecast, by Product Type 2019 & 2032
- Table 111: Global Disinfection Robots Industry Revenue Million Forecast, by Country 2019 & 2032
- Table 112: Global Disinfection Robots Industry Volume K Unit Forecast, by Country 2019 & 2032
Frequently Asked Questions
1. What is the projected Compound Annual Growth Rate (CAGR) of the Disinfection Robots Industry?
The projected CAGR is approximately 24.60%.
2. Which companies are prominent players in the Disinfection Robots Industry?
Key companies in the market include Mediland Enterprise Corporation, Fetch Robotics Inc, Solustar, Skytron (Infection Prevention Technologies), Blue Ocean Robotics, Decon-X International, Xenex Disinfectant Systems, Bridgeport Magnetics, Akara Robotics Ltd, OTSAW Digital Pte Ltd, Tru-d Smartuvc, Ateago Technology, MTR Corporation (Joint venture), Time Medical Holding Robotics, Finsen Technologies (Thor UV-C), Bioquell PLC (Ecolab Inc ), Tmirob Technology, AUDITE Robotic.
3. What are the main segments of the Disinfection Robots Industry?
The market segments include Product Type.
4. Can you provide details about the market size?
The market size is estimated to be USD 1.12 Million as of 2022.
5. What are some drivers contributing to market growth?
High Incidence of Hospital-acquired Infections in Major Markets Worldwide; Technological Advancements Enable Robots to Operate as a Value-added Entity (Collaborative) in the Disinfection Process; Rapid Rise in Healthcare and Sanitation Spending due to the COVID-19 Outbreak; High Investments in the Field of Disinfectant Robots.
6. What are the notable trends driving market growth?
Technological Advancements to Enable Robots to Operate as a Value-added Entity (Collaborative) in the Disinfection Process.
7. Are there any restraints impacting market growth?
Budget Constraints Related to Software Implementation.
8. Can you provide examples of recent developments in the market?
January 2022 - Blue Ocean Robotics' portfolio of robots brand UVD Robots joined Ecolab's global infection prevention offerings. Through a programmatic approach to maintaining staff and facility hygiene, and has been added to its global portfolio of infection prevention solutions for healthcare customers, including hospitals, in-patient, and out-patient clinics, ambulatory surgical facilities, rehabilitation clinics, and other care facilities.
9. What pricing options are available for accessing the report?
Pricing options include single-user, multi-user, and enterprise licenses priced at USD 4750, USD 5250, and USD 8750 respectively.
10. Is the market size provided in terms of value or volume?
The market size is provided in terms of value, measured in Million and volume, measured in K Unit.
11. Are there any specific market keywords associated with the report?
Yes, the market keyword associated with the report is "Disinfection Robots Industry," which aids in identifying and referencing the specific market segment covered.
12. How do I determine which pricing option suits my needs best?
The pricing options vary based on user requirements and access needs. Individual users may opt for single-user licenses, while businesses requiring broader access may choose multi-user or enterprise licenses for cost-effective access to the report.
13. Are there any additional resources or data provided in the Disinfection Robots Industry report?
While the report offers comprehensive insights, it's advisable to review the specific contents or supplementary materials provided to ascertain if additional resources or data are available.
14. How can I stay updated on further developments or reports in the Disinfection Robots Industry?
To stay informed about further developments, trends, and reports in the Disinfection Robots Industry, consider subscribing to industry newsletters, following relevant companies and organizations, or regularly checking reputable industry news sources and publications.
Methodology
Step 1 - Identification of Relevant Samples Size from Population Database


Step 2 - Approaches for Defining Global Market Size (Value, Volume* & Price*)

Note*: In applicable scenarios
Step 3 - Data Sources
Primary Research
- Web Analytics
- Survey Reports
- Research Institute
- Latest Research Reports
- Opinion Leaders
Secondary Research
- Annual Reports
- White Paper
- Latest Press Release
- Industry Association
- Paid Database
- Investor Presentations

Step 4 - Data Triangulation
Involves using different sources of information in order to increase the validity of a study
These sources are likely to be stakeholders in a program - participants, other researchers, program staff, other community members, and so on.
Then we put all data in single framework & apply various statistical tools to find out the dynamic on the market.
During the analysis stage, feedback from the stakeholder groups would be compared to determine areas of agreement as well as areas of divergence


