
Key Insights
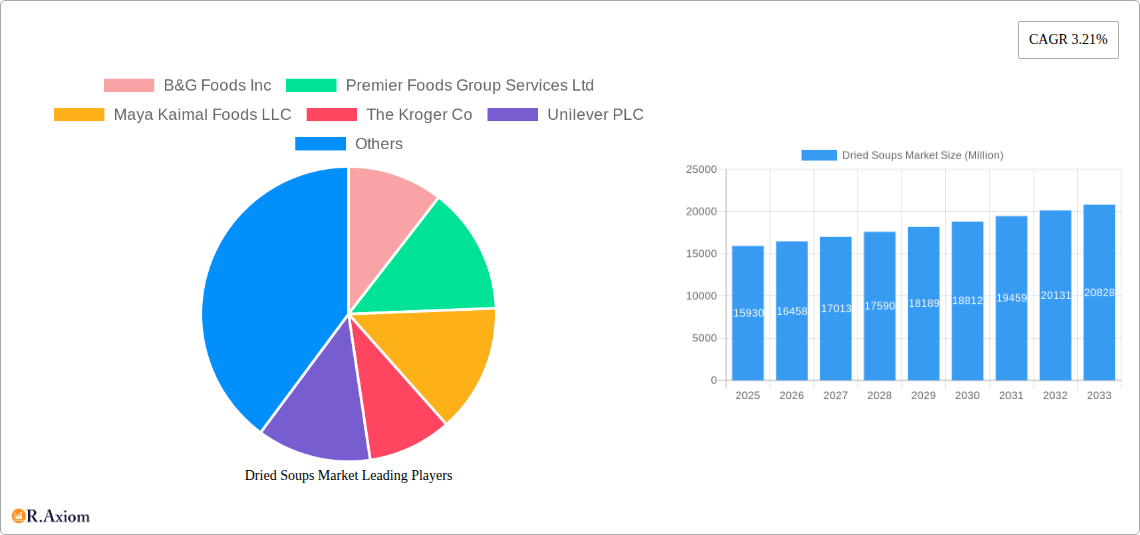
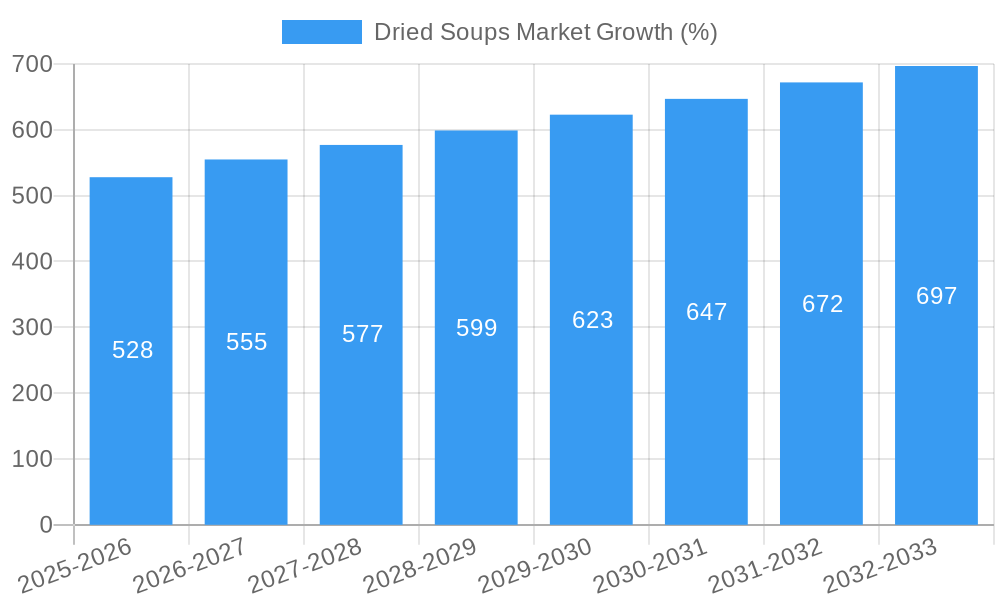
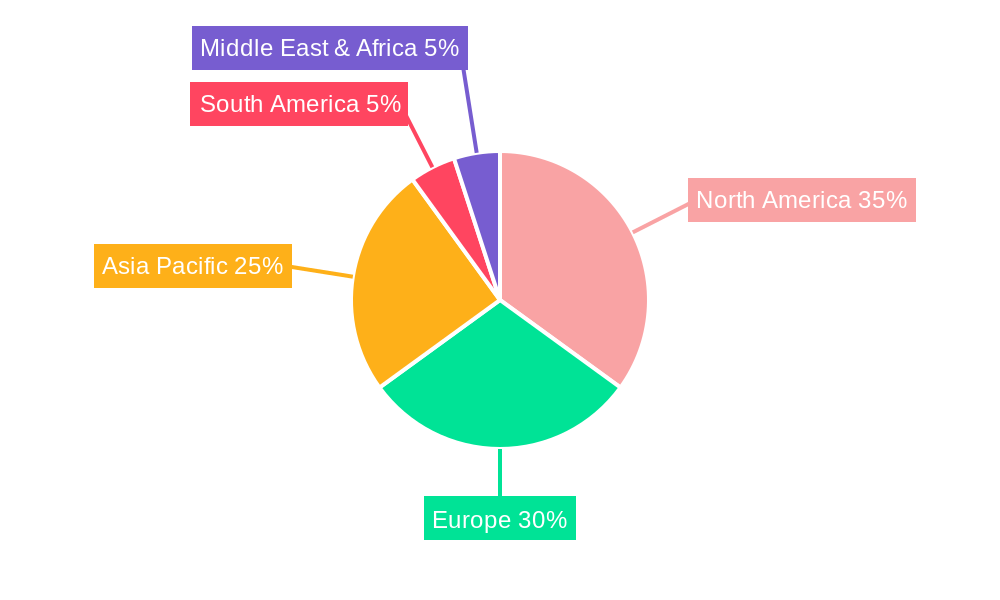
The global dried soups market, valued at $15.93 billion in 2025, is projected to experience steady growth, driven by increasing consumer demand for convenient, healthy, and affordable meal options. The market's Compound Annual Growth Rate (CAGR) of 3.21% from 2025 to 2033 indicates a consistent expansion, fueled by several key factors. The rising popularity of quick and easy meal preparations, particularly among busy professionals and young adults, significantly contributes to market growth. Furthermore, the health-conscious consumer base is driving demand for low-sodium, low-fat, and organic dried soup options. The convenience offered by various packaging formats, including cups, pouches, and cans, coupled with extensive distribution channels like supermarkets, convenience stores, and online retailers, expands market accessibility and fuels sales. Growth in the instant soup segment is particularly notable, given its ease of preparation and longer shelf life. However, fluctuating raw material prices and intense competition among established players and emerging brands pose challenges to market growth. Regional variations in consumption patterns are also observed, with North America and Europe holding significant market shares currently, but Asia-Pacific is anticipated to show substantial growth in the forecast period due to rising disposable incomes and changing dietary habits.
The market segmentation reveals dynamic trends. While the instant soup segment dominates due to convenience, the dehydrated soup segment is witnessing growth due to its perceived healthier profile. Similarly, while supermarkets and hypermarkets remain the primary distribution channel, online retail is exhibiting robust growth, driven by e-commerce expansion and changing consumer shopping habits. Key players like B&G Foods, Premier Foods, and Unilever are constantly innovating with new product offerings, flavor profiles, and packaging to maintain their market share, while smaller, niche players are focusing on organic and specialized options to carve out market niches. The forecast period will see a continued focus on product diversification, strategic partnerships, and expansion into emerging markets, shaping the competitive landscape of the dried soups market.
This detailed report provides a comprehensive analysis of the Dried Soups Market, offering invaluable insights for industry stakeholders, investors, and businesses seeking to navigate this dynamic sector. The report covers the period 2019-2033, with a focus on the forecast period 2025-2033 and a base year of 2025. Expect in-depth analysis of market size (in Millions), segmentation, key players, and future growth opportunities.
Dried Soups Market Concentration & Innovation
The Dried Soups Market exhibits a moderately concentrated landscape, with key players such as B&G Foods Inc, Premier Foods Group Services Ltd, Maya Kaimal Foods LLC, The Kroger Co, Unilever PLC, Hain Celestial Group Inc, Brodo Company, Harmony House Foods Inc, General Mills, Campbell Soup Co, Kraft Heinz Company, and Nestlé S A holding significant market share. The exact market share distribution varies across segments and regions, but the top 5 players collectively account for an estimated xx% of the global market in 2025. Mergers and acquisitions (M&A) activity has been moderate, with deal values averaging xx Million in the past five years. Innovation is driven by consumer demand for healthier, more convenient, and diverse options, leading to the development of vegan, organic, and globally-inspired soup varieties. Stricter food safety regulations and labeling requirements across different regions impact the market. Product substitutes, such as fresh soups and canned soups, pose competition, however the convenience and longer shelf-life of dried soups provide a competitive advantage. End-user trends indicate a growing preference for single-serve portions and convenient packaging.
Dried Soups Market Industry Trends & Insights
The Dried Soups Market is experiencing steady growth, with a projected Compound Annual Growth Rate (CAGR) of xx% during the forecast period (2025-2033). This growth is fueled by several factors: increasing consumer demand for convenient meal options, the rising popularity of ready-to-eat meals, and the expanding global foodservice sector. Technological advancements in packaging and preservation techniques are improving product quality and shelf life. However, consumer preferences are shifting towards healthier, organic, and ethically sourced ingredients, placing pressure on manufacturers to adopt sustainable practices. The market is witnessing significant competitive dynamics, with existing players expanding their product lines and new entrants entering the market. Market penetration of dried soups is particularly high in developed countries, while emerging economies present considerable untapped potential. The impact of inflation on consumer spending and supply chain disruptions could potentially affect market growth during certain periods.
Dominant Markets & Segments in Dried Soups Market
Leading Region: North America currently holds the largest market share in the dried soups market driven by high consumer demand for convenience foods and the presence of major players. Economic stability and developed retail infrastructure contribute significantly.
Leading Country: The United States holds a dominant position within North America due to its large population and strong purchasing power.
Dominant Type: Instant soups command the largest segment share due to their convenience and speed of preparation.
Dominant Packaging: Cup packaging is highly popular due to its single-serving portion size and ease of use.
Dominant Distribution Channel: Supermarket/Hypermarkets dominate the distribution network due to their wide reach and established supply chains. However, the online retail channel is experiencing significant growth.
The growth of each segment is influenced by factors such as consumer preferences, pricing strategies, and distribution networks. Emerging markets are showing considerable potential for growth in the future, particularly in Asia and Africa.
Dried Soups Market Product Developments
Recent product innovations focus on catering to evolving consumer needs. This includes the introduction of vegan options, organic ingredients, and diverse flavor profiles catering to various ethnic tastes. Improvements in packaging enhance convenience and shelf life. Technological advancements in dehydration and preservation are improving product quality and reducing manufacturing costs. This enables manufacturers to offer high-quality dried soups at competitive prices, making them increasingly appealing to consumers.
Report Scope & Segmentation Analysis
This report segments the Dried Soups Market based on several key factors:
Type: Instant, Dehydrated. The instant segment is expected to maintain its dominance due to higher consumer preference for quick-to-prepare foods. Dehydrated soups, however, are experiencing moderate growth due to their longer shelf-life and cost-effectiveness.
Packaging: Cup, Pouch, Canned. Cup packaging will retain its market leadership, but pouches and cans are expected to see increased adoption, especially for larger quantities.
Distribution Channel: Supermarket/Hypermarket, Convenience Stores, Grocery Stores, Online Retail Stores, Other Distribution Channels. The Supermarket/Hypermarket channel will maintain dominance. Online retail channels are steadily gaining traction, and are expected to be a significant distribution channel in the future. Each segment presents varying growth projections, market sizes, and competitive dynamics.
Key Drivers of Dried Soups Market Growth
The Dried Soups Market is driven by several key factors, including the increasing demand for convenient and ready-to-eat meals, rising disposable incomes in emerging markets, and the expansion of the foodservice sector. Technological advancements in packaging and preservation techniques have improved product quality and shelf life. Furthermore, favorable government regulations and policies promoting food safety contribute to the growth of the market. The growing popularity of vegan and organic food products further boosts market demand.
Challenges in the Dried Soups Market Sector
The Dried Soups Market faces challenges, including fluctuating raw material prices, intense competition among existing players, and stringent food safety regulations. Supply chain disruptions due to geopolitical instability and changing consumer preferences could also impact market growth. The rising cost of transportation and labor may increase the production and distribution costs.
Emerging Opportunities in Dried Soups Market
Emerging opportunities exist in expanding into untapped markets, particularly in developing economies. Innovation in product development, such as offering personalized and customized soup options, could enhance consumer engagement. Adopting sustainable packaging solutions and sourcing ingredients from ethical and sustainable sources will appeal to environmentally conscious consumers. Exploring new distribution channels, like meal kit services, could boost sales growth.
Leading Players in the Dried Soups Market Market
- B&G Foods Inc
- Premier Foods Group Services Ltd
- Maya Kaimal Foods LLC
- The Kroger Co
- Unilever PLC
- Hain Celestial Group Inc
- Brodo Company
- Harmony House Foods Inc
- General Mills
- Campbell Soup Co
- Kraft Heinz Company
- Nestlé S A
Key Developments in Dried Soups Market Industry
November 2022: Heinz launched a fully vegan Christmas Dinner Big Soup, expanding into the growing plant-based food market and leveraging existing retail networks.
August 2022: Yeo Valley expanded beyond dairy with a new organic soup range in recyclable packaging, targeting health-conscious consumers with convenient, on-the-go options.
July 2022: Maya Kaimal Foods launched vegan, Indian-inspired soups, broadening the flavor profile and catering to a niche market with unique product offerings.
These developments reflect the industry's response to changing consumer demands and market trends.
Strategic Outlook for Dried Soups Market Market
The Dried Soups Market is poised for continued growth, driven by favorable demographic trends, rising disposable incomes, and ongoing innovation within the food industry. Opportunities exist for players to capitalize on the increasing demand for convenient, healthy, and diverse soup options. Strategic partnerships, acquisitions, and product diversification will be crucial for sustained success in this competitive market. Companies focused on sustainability and ethical sourcing will gain a competitive edge.
Dried Soups Market Segmentation
-
1. Type
- 1.1. Instant
- 1.2. Dehydrated
-
2. Packaging
- 2.1. Cup
- 2.2. Pouch
- 2.3. Canned
-
3. Distribution Channel
- 3.1. Supermarket/Hypermarket
- 3.2. Convenience Stores
- 3.3. Grocery Stores
- 3.4. Online Retail Stores
- 3.5. Other Distribution Channels
Dried Soups Market Segmentation By Geography
-
1. North America
- 1.1. United States
- 1.2. Canada
- 1.3. Mexico
- 1.4. Rest of North America
-
2. Europe
- 2.1. United Kingdom
- 2.2. Germany
- 2.3. France
- 2.4. Russia
- 2.5. Italy
- 2.6. Spain
- 2.7. Rest of Europe
-
3. Asia Pacific
- 3.1. India
- 3.2. China
- 3.3. Japan
- 3.4. Australia
- 3.5. Rest of Asia Pacific
-
4. South America
- 4.1. Brazil
- 4.2. Argentina
- 4.3. Rest of South America
- 5. Middle East
-
6. South Africa
- 6.1. Saudi Arabia
- 6.2. Rest of MEA
Dried Soups Market REPORT HIGHLIGHTS
| Aspects | Details |
|---|---|
| Study Period | 2019-2033 |
| Base Year | 2024 |
| Estimated Year | 2025 |
| Forecast Period | 2025-2033 |
| Historical Period | 2019-2024 |
| Growth Rate | CAGR of 3.21% from 2019-2033 |
| Segmentation |
|
Table of Contents
- 1. Introduction
- 1.1. Research Scope
- 1.2. Market Segmentation
- 1.3. Research Methodology
- 1.4. Definitions and Assumptions
- 2. Executive Summary
- 2.1. Introduction
- 3. Market Dynamics
- 3.1. Introduction
- 3.2. Market Drivers
- 3.2.1. Prevalence of Lactose Intolerance Driving the Market; Growing Influence of Healthy Lifestyle Trends and Rising Non-Traditional Users
- 3.3. Market Restrains
- 3.3.1. Wide Availability of Alternative Protein Sources
- 3.4. Market Trends
- 3.4.1. Growing Demand for Ready to Eat Food health based foods
- 4. Market Factor Analysis
- 4.1. Porters Five Forces
- 4.2. Supply/Value Chain
- 4.3. PESTEL analysis
- 4.4. Market Entropy
- 4.5. Patent/Trademark Analysis
- 5. Global Dried Soups Market Analysis, Insights and Forecast, 2019-2031
- 5.1. Market Analysis, Insights and Forecast - by Type
- 5.1.1. Instant
- 5.1.2. Dehydrated
- 5.2. Market Analysis, Insights and Forecast - by Packaging
- 5.2.1. Cup
- 5.2.2. Pouch
- 5.2.3. Canned
- 5.3. Market Analysis, Insights and Forecast - by Distribution Channel
- 5.3.1. Supermarket/Hypermarket
- 5.3.2. Convenience Stores
- 5.3.3. Grocery Stores
- 5.3.4. Online Retail Stores
- 5.3.5. Other Distribution Channels
- 5.4. Market Analysis, Insights and Forecast - by Region
- 5.4.1. North America
- 5.4.2. Europe
- 5.4.3. Asia Pacific
- 5.4.4. South America
- 5.4.5. Middle East
- 5.4.6. South Africa
- 5.1. Market Analysis, Insights and Forecast - by Type
- 6. North America Dried Soups Market Analysis, Insights and Forecast, 2019-2031
- 6.1. Market Analysis, Insights and Forecast - by Type
- 6.1.1. Instant
- 6.1.2. Dehydrated
- 6.2. Market Analysis, Insights and Forecast - by Packaging
- 6.2.1. Cup
- 6.2.2. Pouch
- 6.2.3. Canned
- 6.3. Market Analysis, Insights and Forecast - by Distribution Channel
- 6.3.1. Supermarket/Hypermarket
- 6.3.2. Convenience Stores
- 6.3.3. Grocery Stores
- 6.3.4. Online Retail Stores
- 6.3.5. Other Distribution Channels
- 6.1. Market Analysis, Insights and Forecast - by Type
- 7. Europe Dried Soups Market Analysis, Insights and Forecast, 2019-2031
- 7.1. Market Analysis, Insights and Forecast - by Type
- 7.1.1. Instant
- 7.1.2. Dehydrated
- 7.2. Market Analysis, Insights and Forecast - by Packaging
- 7.2.1. Cup
- 7.2.2. Pouch
- 7.2.3. Canned
- 7.3. Market Analysis, Insights and Forecast - by Distribution Channel
- 7.3.1. Supermarket/Hypermarket
- 7.3.2. Convenience Stores
- 7.3.3. Grocery Stores
- 7.3.4. Online Retail Stores
- 7.3.5. Other Distribution Channels
- 7.1. Market Analysis, Insights and Forecast - by Type
- 8. Asia Pacific Dried Soups Market Analysis, Insights and Forecast, 2019-2031
- 8.1. Market Analysis, Insights and Forecast - by Type
- 8.1.1. Instant
- 8.1.2. Dehydrated
- 8.2. Market Analysis, Insights and Forecast - by Packaging
- 8.2.1. Cup
- 8.2.2. Pouch
- 8.2.3. Canned
- 8.3. Market Analysis, Insights and Forecast - by Distribution Channel
- 8.3.1. Supermarket/Hypermarket
- 8.3.2. Convenience Stores
- 8.3.3. Grocery Stores
- 8.3.4. Online Retail Stores
- 8.3.5. Other Distribution Channels
- 8.1. Market Analysis, Insights and Forecast - by Type
- 9. South America Dried Soups Market Analysis, Insights and Forecast, 2019-2031
- 9.1. Market Analysis, Insights and Forecast - by Type
- 9.1.1. Instant
- 9.1.2. Dehydrated
- 9.2. Market Analysis, Insights and Forecast - by Packaging
- 9.2.1. Cup
- 9.2.2. Pouch
- 9.2.3. Canned
- 9.3. Market Analysis, Insights and Forecast - by Distribution Channel
- 9.3.1. Supermarket/Hypermarket
- 9.3.2. Convenience Stores
- 9.3.3. Grocery Stores
- 9.3.4. Online Retail Stores
- 9.3.5. Other Distribution Channels
- 9.1. Market Analysis, Insights and Forecast - by Type
- 10. Middle East Dried Soups Market Analysis, Insights and Forecast, 2019-2031
- 10.1. Market Analysis, Insights and Forecast - by Type
- 10.1.1. Instant
- 10.1.2. Dehydrated
- 10.2. Market Analysis, Insights and Forecast - by Packaging
- 10.2.1. Cup
- 10.2.2. Pouch
- 10.2.3. Canned
- 10.3. Market Analysis, Insights and Forecast - by Distribution Channel
- 10.3.1. Supermarket/Hypermarket
- 10.3.2. Convenience Stores
- 10.3.3. Grocery Stores
- 10.3.4. Online Retail Stores
- 10.3.5. Other Distribution Channels
- 10.1. Market Analysis, Insights and Forecast - by Type
- 11. South Africa Dried Soups Market Analysis, Insights and Forecast, 2019-2031
- 11.1. Market Analysis, Insights and Forecast - by Type
- 11.1.1. Instant
- 11.1.2. Dehydrated
- 11.2. Market Analysis, Insights and Forecast - by Packaging
- 11.2.1. Cup
- 11.2.2. Pouch
- 11.2.3. Canned
- 11.3. Market Analysis, Insights and Forecast - by Distribution Channel
- 11.3.1. Supermarket/Hypermarket
- 11.3.2. Convenience Stores
- 11.3.3. Grocery Stores
- 11.3.4. Online Retail Stores
- 11.3.5. Other Distribution Channels
- 11.1. Market Analysis, Insights and Forecast - by Type
- 12. North America Dried Soups Market Analysis, Insights and Forecast, 2019-2031
- 12.1. Market Analysis, Insights and Forecast - By Country/Sub-region
- 12.1.1 United States
- 12.1.2 Canada
- 12.1.3 Mexico
- 12.1.4 Rest of North America
- 13. Europe Dried Soups Market Analysis, Insights and Forecast, 2019-2031
- 13.1. Market Analysis, Insights and Forecast - By Country/Sub-region
- 13.1.1 United Kingdom
- 13.1.2 Germany
- 13.1.3 France
- 13.1.4 Russia
- 13.1.5 Italy
- 13.1.6 Spain
- 13.1.7 Rest of Europe
- 14. Asia Pacific Dried Soups Market Analysis, Insights and Forecast, 2019-2031
- 14.1. Market Analysis, Insights and Forecast - By Country/Sub-region
- 14.1.1 India
- 14.1.2 China
- 14.1.3 Japan
- 14.1.4 Australia
- 14.1.5 Rest of Asia Pacific
- 15. South America Dried Soups Market Analysis, Insights and Forecast, 2019-2031
- 15.1. Market Analysis, Insights and Forecast - By Country/Sub-region
- 15.1.1 Brazil
- 15.1.2 Argentina
- 15.1.3 Rest of South America
- 16. Middle East & Africa Dried Soups Market Analysis, Insights and Forecast, 2019-2031
- 16.1. Market Analysis, Insights and Forecast - By Country/Sub-region
- 16.1.1 UAE
- 16.1.2 South Africa
- 16.1.3 Saudi Arabia
- 16.1.4 Rest of MEA
- 17. South Africa Dried Soups Market Analysis, Insights and Forecast, 2019-2031
- 17.1. Market Analysis, Insights and Forecast - By Country/Sub-region
- 17.1.1 Saudi Arabia
- 17.1.2 Rest of MEA
- 18. Competitive Analysis
- 18.1. Global Market Share Analysis 2024
- 18.2. Company Profiles
- 18.2.1 B&G Foods Inc
- 18.2.1.1. Overview
- 18.2.1.2. Products
- 18.2.1.3. SWOT Analysis
- 18.2.1.4. Recent Developments
- 18.2.1.5. Financials (Based on Availability)
- 18.2.2 Premier Foods Group Services Ltd
- 18.2.2.1. Overview
- 18.2.2.2. Products
- 18.2.2.3. SWOT Analysis
- 18.2.2.4. Recent Developments
- 18.2.2.5. Financials (Based on Availability)
- 18.2.3 Maya Kaimal Foods LLC
- 18.2.3.1. Overview
- 18.2.3.2. Products
- 18.2.3.3. SWOT Analysis
- 18.2.3.4. Recent Developments
- 18.2.3.5. Financials (Based on Availability)
- 18.2.4 The Kroger Co
- 18.2.4.1. Overview
- 18.2.4.2. Products
- 18.2.4.3. SWOT Analysis
- 18.2.4.4. Recent Developments
- 18.2.4.5. Financials (Based on Availability)
- 18.2.5 Unilever PLC
- 18.2.5.1. Overview
- 18.2.5.2. Products
- 18.2.5.3. SWOT Analysis
- 18.2.5.4. Recent Developments
- 18.2.5.5. Financials (Based on Availability)
- 18.2.6 Hain Celestial Group Inc
- 18.2.6.1. Overview
- 18.2.6.2. Products
- 18.2.6.3. SWOT Analysis
- 18.2.6.4. Recent Developments
- 18.2.6.5. Financials (Based on Availability)
- 18.2.7 Brodo Company
- 18.2.7.1. Overview
- 18.2.7.2. Products
- 18.2.7.3. SWOT Analysis
- 18.2.7.4. Recent Developments
- 18.2.7.5. Financials (Based on Availability)
- 18.2.8 Harmony House Foods Inc *List Not Exhaustive
- 18.2.8.1. Overview
- 18.2.8.2. Products
- 18.2.8.3. SWOT Analysis
- 18.2.8.4. Recent Developments
- 18.2.8.5. Financials (Based on Availability)
- 18.2.9 General Mills
- 18.2.9.1. Overview
- 18.2.9.2. Products
- 18.2.9.3. SWOT Analysis
- 18.2.9.4. Recent Developments
- 18.2.9.5. Financials (Based on Availability)
- 18.2.10 Campbell Soup Co
- 18.2.10.1. Overview
- 18.2.10.2. Products
- 18.2.10.3. SWOT Analysis
- 18.2.10.4. Recent Developments
- 18.2.10.5. Financials (Based on Availability)
- 18.2.11 Kraft Heinz Company
- 18.2.11.1. Overview
- 18.2.11.2. Products
- 18.2.11.3. SWOT Analysis
- 18.2.11.4. Recent Developments
- 18.2.11.5. Financials (Based on Availability)
- 18.2.12 Nestlé S A
- 18.2.12.1. Overview
- 18.2.12.2. Products
- 18.2.12.3. SWOT Analysis
- 18.2.12.4. Recent Developments
- 18.2.12.5. Financials (Based on Availability)
- 18.2.1 B&G Foods Inc
List of Figures
- Figure 1: Global Dried Soups Market Revenue Breakdown (Million, %) by Region 2024 & 2032
- Figure 2: Global Dried Soups Market Volume Breakdown (Liters, %) by Region 2024 & 2032
- Figure 3: North America Dried Soups Market Revenue (Million), by Country 2024 & 2032
- Figure 4: North America Dried Soups Market Volume (Liters), by Country 2024 & 2032
- Figure 5: North America Dried Soups Market Revenue Share (%), by Country 2024 & 2032
- Figure 6: North America Dried Soups Market Volume Share (%), by Country 2024 & 2032
- Figure 7: Europe Dried Soups Market Revenue (Million), by Country 2024 & 2032
- Figure 8: Europe Dried Soups Market Volume (Liters), by Country 2024 & 2032
- Figure 9: Europe Dried Soups Market Revenue Share (%), by Country 2024 & 2032
- Figure 10: Europe Dried Soups Market Volume Share (%), by Country 2024 & 2032
- Figure 11: Asia Pacific Dried Soups Market Revenue (Million), by Country 2024 & 2032
- Figure 12: Asia Pacific Dried Soups Market Volume (Liters), by Country 2024 & 2032
- Figure 13: Asia Pacific Dried Soups Market Revenue Share (%), by Country 2024 & 2032
- Figure 14: Asia Pacific Dried Soups Market Volume Share (%), by Country 2024 & 2032
- Figure 15: South America Dried Soups Market Revenue (Million), by Country 2024 & 2032
- Figure 16: South America Dried Soups Market Volume (Liters), by Country 2024 & 2032
- Figure 17: South America Dried Soups Market Revenue Share (%), by Country 2024 & 2032
- Figure 18: South America Dried Soups Market Volume Share (%), by Country 2024 & 2032
- Figure 19: Middle East & Africa Dried Soups Market Revenue (Million), by Country 2024 & 2032
- Figure 20: Middle East & Africa Dried Soups Market Volume (Liters), by Country 2024 & 2032
- Figure 21: Middle East & Africa Dried Soups Market Revenue Share (%), by Country 2024 & 2032
- Figure 22: Middle East & Africa Dried Soups Market Volume Share (%), by Country 2024 & 2032
- Figure 23: South Africa Dried Soups Market Revenue (Million), by Country 2024 & 2032
- Figure 24: South Africa Dried Soups Market Volume (Liters), by Country 2024 & 2032
- Figure 25: South Africa Dried Soups Market Revenue Share (%), by Country 2024 & 2032
- Figure 26: South Africa Dried Soups Market Volume Share (%), by Country 2024 & 2032
- Figure 27: North America Dried Soups Market Revenue (Million), by Type 2024 & 2032
- Figure 28: North America Dried Soups Market Volume (Liters), by Type 2024 & 2032
- Figure 29: North America Dried Soups Market Revenue Share (%), by Type 2024 & 2032
- Figure 30: North America Dried Soups Market Volume Share (%), by Type 2024 & 2032
- Figure 31: North America Dried Soups Market Revenue (Million), by Packaging 2024 & 2032
- Figure 32: North America Dried Soups Market Volume (Liters), by Packaging 2024 & 2032
- Figure 33: North America Dried Soups Market Revenue Share (%), by Packaging 2024 & 2032
- Figure 34: North America Dried Soups Market Volume Share (%), by Packaging 2024 & 2032
- Figure 35: North America Dried Soups Market Revenue (Million), by Distribution Channel 2024 & 2032
- Figure 36: North America Dried Soups Market Volume (Liters), by Distribution Channel 2024 & 2032
- Figure 37: North America Dried Soups Market Revenue Share (%), by Distribution Channel 2024 & 2032
- Figure 38: North America Dried Soups Market Volume Share (%), by Distribution Channel 2024 & 2032
- Figure 39: North America Dried Soups Market Revenue (Million), by Country 2024 & 2032
- Figure 40: North America Dried Soups Market Volume (Liters), by Country 2024 & 2032
- Figure 41: North America Dried Soups Market Revenue Share (%), by Country 2024 & 2032
- Figure 42: North America Dried Soups Market Volume Share (%), by Country 2024 & 2032
- Figure 43: Europe Dried Soups Market Revenue (Million), by Type 2024 & 2032
- Figure 44: Europe Dried Soups Market Volume (Liters), by Type 2024 & 2032
- Figure 45: Europe Dried Soups Market Revenue Share (%), by Type 2024 & 2032
- Figure 46: Europe Dried Soups Market Volume Share (%), by Type 2024 & 2032
- Figure 47: Europe Dried Soups Market Revenue (Million), by Packaging 2024 & 2032
- Figure 48: Europe Dried Soups Market Volume (Liters), by Packaging 2024 & 2032
- Figure 49: Europe Dried Soups Market Revenue Share (%), by Packaging 2024 & 2032
- Figure 50: Europe Dried Soups Market Volume Share (%), by Packaging 2024 & 2032
- Figure 51: Europe Dried Soups Market Revenue (Million), by Distribution Channel 2024 & 2032
- Figure 52: Europe Dried Soups Market Volume (Liters), by Distribution Channel 2024 & 2032
- Figure 53: Europe Dried Soups Market Revenue Share (%), by Distribution Channel 2024 & 2032
- Figure 54: Europe Dried Soups Market Volume Share (%), by Distribution Channel 2024 & 2032
- Figure 55: Europe Dried Soups Market Revenue (Million), by Country 2024 & 2032
- Figure 56: Europe Dried Soups Market Volume (Liters), by Country 2024 & 2032
- Figure 57: Europe Dried Soups Market Revenue Share (%), by Country 2024 & 2032
- Figure 58: Europe Dried Soups Market Volume Share (%), by Country 2024 & 2032
- Figure 59: Asia Pacific Dried Soups Market Revenue (Million), by Type 2024 & 2032
- Figure 60: Asia Pacific Dried Soups Market Volume (Liters), by Type 2024 & 2032
- Figure 61: Asia Pacific Dried Soups Market Revenue Share (%), by Type 2024 & 2032
- Figure 62: Asia Pacific Dried Soups Market Volume Share (%), by Type 2024 & 2032
- Figure 63: Asia Pacific Dried Soups Market Revenue (Million), by Packaging 2024 & 2032
- Figure 64: Asia Pacific Dried Soups Market Volume (Liters), by Packaging 2024 & 2032
- Figure 65: Asia Pacific Dried Soups Market Revenue Share (%), by Packaging 2024 & 2032
- Figure 66: Asia Pacific Dried Soups Market Volume Share (%), by Packaging 2024 & 2032
- Figure 67: Asia Pacific Dried Soups Market Revenue (Million), by Distribution Channel 2024 & 2032
- Figure 68: Asia Pacific Dried Soups Market Volume (Liters), by Distribution Channel 2024 & 2032
- Figure 69: Asia Pacific Dried Soups Market Revenue Share (%), by Distribution Channel 2024 & 2032
- Figure 70: Asia Pacific Dried Soups Market Volume Share (%), by Distribution Channel 2024 & 2032
- Figure 71: Asia Pacific Dried Soups Market Revenue (Million), by Country 2024 & 2032
- Figure 72: Asia Pacific Dried Soups Market Volume (Liters), by Country 2024 & 2032
- Figure 73: Asia Pacific Dried Soups Market Revenue Share (%), by Country 2024 & 2032
- Figure 74: Asia Pacific Dried Soups Market Volume Share (%), by Country 2024 & 2032
- Figure 75: South America Dried Soups Market Revenue (Million), by Type 2024 & 2032
- Figure 76: South America Dried Soups Market Volume (Liters), by Type 2024 & 2032
- Figure 77: South America Dried Soups Market Revenue Share (%), by Type 2024 & 2032
- Figure 78: South America Dried Soups Market Volume Share (%), by Type 2024 & 2032
- Figure 79: South America Dried Soups Market Revenue (Million), by Packaging 2024 & 2032
- Figure 80: South America Dried Soups Market Volume (Liters), by Packaging 2024 & 2032
- Figure 81: South America Dried Soups Market Revenue Share (%), by Packaging 2024 & 2032
- Figure 82: South America Dried Soups Market Volume Share (%), by Packaging 2024 & 2032
- Figure 83: South America Dried Soups Market Revenue (Million), by Distribution Channel 2024 & 2032
- Figure 84: South America Dried Soups Market Volume (Liters), by Distribution Channel 2024 & 2032
- Figure 85: South America Dried Soups Market Revenue Share (%), by Distribution Channel 2024 & 2032
- Figure 86: South America Dried Soups Market Volume Share (%), by Distribution Channel 2024 & 2032
- Figure 87: South America Dried Soups Market Revenue (Million), by Country 2024 & 2032
- Figure 88: South America Dried Soups Market Volume (Liters), by Country 2024 & 2032
- Figure 89: South America Dried Soups Market Revenue Share (%), by Country 2024 & 2032
- Figure 90: South America Dried Soups Market Volume Share (%), by Country 2024 & 2032
- Figure 91: Middle East Dried Soups Market Revenue (Million), by Type 2024 & 2032
- Figure 92: Middle East Dried Soups Market Volume (Liters), by Type 2024 & 2032
- Figure 93: Middle East Dried Soups Market Revenue Share (%), by Type 2024 & 2032
- Figure 94: Middle East Dried Soups Market Volume Share (%), by Type 2024 & 2032
- Figure 95: Middle East Dried Soups Market Revenue (Million), by Packaging 2024 & 2032
- Figure 96: Middle East Dried Soups Market Volume (Liters), by Packaging 2024 & 2032
- Figure 97: Middle East Dried Soups Market Revenue Share (%), by Packaging 2024 & 2032
- Figure 98: Middle East Dried Soups Market Volume Share (%), by Packaging 2024 & 2032
- Figure 99: Middle East Dried Soups Market Revenue (Million), by Distribution Channel 2024 & 2032
- Figure 100: Middle East Dried Soups Market Volume (Liters), by Distribution Channel 2024 & 2032
- Figure 101: Middle East Dried Soups Market Revenue Share (%), by Distribution Channel 2024 & 2032
- Figure 102: Middle East Dried Soups Market Volume Share (%), by Distribution Channel 2024 & 2032
- Figure 103: Middle East Dried Soups Market Revenue (Million), by Country 2024 & 2032
- Figure 104: Middle East Dried Soups Market Volume (Liters), by Country 2024 & 2032
- Figure 105: Middle East Dried Soups Market Revenue Share (%), by Country 2024 & 2032
- Figure 106: Middle East Dried Soups Market Volume Share (%), by Country 2024 & 2032
- Figure 107: South Africa Dried Soups Market Revenue (Million), by Type 2024 & 2032
- Figure 108: South Africa Dried Soups Market Volume (Liters), by Type 2024 & 2032
- Figure 109: South Africa Dried Soups Market Revenue Share (%), by Type 2024 & 2032
- Figure 110: South Africa Dried Soups Market Volume Share (%), by Type 2024 & 2032
- Figure 111: South Africa Dried Soups Market Revenue (Million), by Packaging 2024 & 2032
- Figure 112: South Africa Dried Soups Market Volume (Liters), by Packaging 2024 & 2032
- Figure 113: South Africa Dried Soups Market Revenue Share (%), by Packaging 2024 & 2032
- Figure 114: South Africa Dried Soups Market Volume Share (%), by Packaging 2024 & 2032
- Figure 115: South Africa Dried Soups Market Revenue (Million), by Distribution Channel 2024 & 2032
- Figure 116: South Africa Dried Soups Market Volume (Liters), by Distribution Channel 2024 & 2032
- Figure 117: South Africa Dried Soups Market Revenue Share (%), by Distribution Channel 2024 & 2032
- Figure 118: South Africa Dried Soups Market Volume Share (%), by Distribution Channel 2024 & 2032
- Figure 119: South Africa Dried Soups Market Revenue (Million), by Country 2024 & 2032
- Figure 120: South Africa Dried Soups Market Volume (Liters), by Country 2024 & 2032
- Figure 121: South Africa Dried Soups Market Revenue Share (%), by Country 2024 & 2032
- Figure 122: South Africa Dried Soups Market Volume Share (%), by Country 2024 & 2032
List of Tables
- Table 1: Global Dried Soups Market Revenue Million Forecast, by Region 2019 & 2032
- Table 2: Global Dried Soups Market Volume Liters Forecast, by Region 2019 & 2032
- Table 3: Global Dried Soups Market Revenue Million Forecast, by Type 2019 & 2032
- Table 4: Global Dried Soups Market Volume Liters Forecast, by Type 2019 & 2032
- Table 5: Global Dried Soups Market Revenue Million Forecast, by Packaging 2019 & 2032
- Table 6: Global Dried Soups Market Volume Liters Forecast, by Packaging 2019 & 2032
- Table 7: Global Dried Soups Market Revenue Million Forecast, by Distribution Channel 2019 & 2032
- Table 8: Global Dried Soups Market Volume Liters Forecast, by Distribution Channel 2019 & 2032
- Table 9: Global Dried Soups Market Revenue Million Forecast, by Region 2019 & 2032
- Table 10: Global Dried Soups Market Volume Liters Forecast, by Region 2019 & 2032
- Table 11: Global Dried Soups Market Revenue Million Forecast, by Country 2019 & 2032
- Table 12: Global Dried Soups Market Volume Liters Forecast, by Country 2019 & 2032
- Table 13: United States Dried Soups Market Revenue (Million) Forecast, by Application 2019 & 2032
- Table 14: United States Dried Soups Market Volume (Liters) Forecast, by Application 2019 & 2032
- Table 15: Canada Dried Soups Market Revenue (Million) Forecast, by Application 2019 & 2032
- Table 16: Canada Dried Soups Market Volume (Liters) Forecast, by Application 2019 & 2032
- Table 17: Mexico Dried Soups Market Revenue (Million) Forecast, by Application 2019 & 2032
- Table 18: Mexico Dried Soups Market Volume (Liters) Forecast, by Application 2019 & 2032
- Table 19: Rest of North America Dried Soups Market Revenue (Million) Forecast, by Application 2019 & 2032
- Table 20: Rest of North America Dried Soups Market Volume (Liters) Forecast, by Application 2019 & 2032
- Table 21: Global Dried Soups Market Revenue Million Forecast, by Country 2019 & 2032
- Table 22: Global Dried Soups Market Volume Liters Forecast, by Country 2019 & 2032
- Table 23: United Kingdom Dried Soups Market Revenue (Million) Forecast, by Application 2019 & 2032
- Table 24: United Kingdom Dried Soups Market Volume (Liters) Forecast, by Application 2019 & 2032
- Table 25: Germany Dried Soups Market Revenue (Million) Forecast, by Application 2019 & 2032
- Table 26: Germany Dried Soups Market Volume (Liters) Forecast, by Application 2019 & 2032
- Table 27: France Dried Soups Market Revenue (Million) Forecast, by Application 2019 & 2032
- Table 28: France Dried Soups Market Volume (Liters) Forecast, by Application 2019 & 2032
- Table 29: Russia Dried Soups Market Revenue (Million) Forecast, by Application 2019 & 2032
- Table 30: Russia Dried Soups Market Volume (Liters) Forecast, by Application 2019 & 2032
- Table 31: Italy Dried Soups Market Revenue (Million) Forecast, by Application 2019 & 2032
- Table 32: Italy Dried Soups Market Volume (Liters) Forecast, by Application 2019 & 2032
- Table 33: Spain Dried Soups Market Revenue (Million) Forecast, by Application 2019 & 2032
- Table 34: Spain Dried Soups Market Volume (Liters) Forecast, by Application 2019 & 2032
- Table 35: Rest of Europe Dried Soups Market Revenue (Million) Forecast, by Application 2019 & 2032
- Table 36: Rest of Europe Dried Soups Market Volume (Liters) Forecast, by Application 2019 & 2032
- Table 37: Global Dried Soups Market Revenue Million Forecast, by Country 2019 & 2032
- Table 38: Global Dried Soups Market Volume Liters Forecast, by Country 2019 & 2032
- Table 39: India Dried Soups Market Revenue (Million) Forecast, by Application 2019 & 2032
- Table 40: India Dried Soups Market Volume (Liters) Forecast, by Application 2019 & 2032
- Table 41: China Dried Soups Market Revenue (Million) Forecast, by Application 2019 & 2032
- Table 42: China Dried Soups Market Volume (Liters) Forecast, by Application 2019 & 2032
- Table 43: Japan Dried Soups Market Revenue (Million) Forecast, by Application 2019 & 2032
- Table 44: Japan Dried Soups Market Volume (Liters) Forecast, by Application 2019 & 2032
- Table 45: Australia Dried Soups Market Revenue (Million) Forecast, by Application 2019 & 2032
- Table 46: Australia Dried Soups Market Volume (Liters) Forecast, by Application 2019 & 2032
- Table 47: Rest of Asia Pacific Dried Soups Market Revenue (Million) Forecast, by Application 2019 & 2032
- Table 48: Rest of Asia Pacific Dried Soups Market Volume (Liters) Forecast, by Application 2019 & 2032
- Table 49: Global Dried Soups Market Revenue Million Forecast, by Country 2019 & 2032
- Table 50: Global Dried Soups Market Volume Liters Forecast, by Country 2019 & 2032
- Table 51: Brazil Dried Soups Market Revenue (Million) Forecast, by Application 2019 & 2032
- Table 52: Brazil Dried Soups Market Volume (Liters) Forecast, by Application 2019 & 2032
- Table 53: Argentina Dried Soups Market Revenue (Million) Forecast, by Application 2019 & 2032
- Table 54: Argentina Dried Soups Market Volume (Liters) Forecast, by Application 2019 & 2032
- Table 55: Rest of South America Dried Soups Market Revenue (Million) Forecast, by Application 2019 & 2032
- Table 56: Rest of South America Dried Soups Market Volume (Liters) Forecast, by Application 2019 & 2032
- Table 57: Global Dried Soups Market Revenue Million Forecast, by Country 2019 & 2032
- Table 58: Global Dried Soups Market Volume Liters Forecast, by Country 2019 & 2032
- Table 59: UAE Dried Soups Market Revenue (Million) Forecast, by Application 2019 & 2032
- Table 60: UAE Dried Soups Market Volume (Liters) Forecast, by Application 2019 & 2032
- Table 61: South Africa Dried Soups Market Revenue (Million) Forecast, by Application 2019 & 2032
- Table 62: South Africa Dried Soups Market Volume (Liters) Forecast, by Application 2019 & 2032
- Table 63: Saudi Arabia Dried Soups Market Revenue (Million) Forecast, by Application 2019 & 2032
- Table 64: Saudi Arabia Dried Soups Market Volume (Liters) Forecast, by Application 2019 & 2032
- Table 65: Rest of MEA Dried Soups Market Revenue (Million) Forecast, by Application 2019 & 2032
- Table 66: Rest of MEA Dried Soups Market Volume (Liters) Forecast, by Application 2019 & 2032
- Table 67: Global Dried Soups Market Revenue Million Forecast, by Country 2019 & 2032
- Table 68: Global Dried Soups Market Volume Liters Forecast, by Country 2019 & 2032
- Table 69: Saudi Arabia Dried Soups Market Revenue (Million) Forecast, by Application 2019 & 2032
- Table 70: Saudi Arabia Dried Soups Market Volume (Liters) Forecast, by Application 2019 & 2032
- Table 71: Rest of MEA Dried Soups Market Revenue (Million) Forecast, by Application 2019 & 2032
- Table 72: Rest of MEA Dried Soups Market Volume (Liters) Forecast, by Application 2019 & 2032
- Table 73: Global Dried Soups Market Revenue Million Forecast, by Type 2019 & 2032
- Table 74: Global Dried Soups Market Volume Liters Forecast, by Type 2019 & 2032
- Table 75: Global Dried Soups Market Revenue Million Forecast, by Packaging 2019 & 2032
- Table 76: Global Dried Soups Market Volume Liters Forecast, by Packaging 2019 & 2032
- Table 77: Global Dried Soups Market Revenue Million Forecast, by Distribution Channel 2019 & 2032
- Table 78: Global Dried Soups Market Volume Liters Forecast, by Distribution Channel 2019 & 2032
- Table 79: Global Dried Soups Market Revenue Million Forecast, by Country 2019 & 2032
- Table 80: Global Dried Soups Market Volume Liters Forecast, by Country 2019 & 2032
- Table 81: United States Dried Soups Market Revenue (Million) Forecast, by Application 2019 & 2032
- Table 82: United States Dried Soups Market Volume (Liters) Forecast, by Application 2019 & 2032
- Table 83: Canada Dried Soups Market Revenue (Million) Forecast, by Application 2019 & 2032
- Table 84: Canada Dried Soups Market Volume (Liters) Forecast, by Application 2019 & 2032
- Table 85: Mexico Dried Soups Market Revenue (Million) Forecast, by Application 2019 & 2032
- Table 86: Mexico Dried Soups Market Volume (Liters) Forecast, by Application 2019 & 2032
- Table 87: Rest of North America Dried Soups Market Revenue (Million) Forecast, by Application 2019 & 2032
- Table 88: Rest of North America Dried Soups Market Volume (Liters) Forecast, by Application 2019 & 2032
- Table 89: Global Dried Soups Market Revenue Million Forecast, by Type 2019 & 2032
- Table 90: Global Dried Soups Market Volume Liters Forecast, by Type 2019 & 2032
- Table 91: Global Dried Soups Market Revenue Million Forecast, by Packaging 2019 & 2032
- Table 92: Global Dried Soups Market Volume Liters Forecast, by Packaging 2019 & 2032
- Table 93: Global Dried Soups Market Revenue Million Forecast, by Distribution Channel 2019 & 2032
- Table 94: Global Dried Soups Market Volume Liters Forecast, by Distribution Channel 2019 & 2032
- Table 95: Global Dried Soups Market Revenue Million Forecast, by Country 2019 & 2032
- Table 96: Global Dried Soups Market Volume Liters Forecast, by Country 2019 & 2032
- Table 97: United Kingdom Dried Soups Market Revenue (Million) Forecast, by Application 2019 & 2032
- Table 98: United Kingdom Dried Soups Market Volume (Liters) Forecast, by Application 2019 & 2032
- Table 99: Germany Dried Soups Market Revenue (Million) Forecast, by Application 2019 & 2032
- Table 100: Germany Dried Soups Market Volume (Liters) Forecast, by Application 2019 & 2032
- Table 101: France Dried Soups Market Revenue (Million) Forecast, by Application 2019 & 2032
- Table 102: France Dried Soups Market Volume (Liters) Forecast, by Application 2019 & 2032
- Table 103: Russia Dried Soups Market Revenue (Million) Forecast, by Application 2019 & 2032
- Table 104: Russia Dried Soups Market Volume (Liters) Forecast, by Application 2019 & 2032
- Table 105: Italy Dried Soups Market Revenue (Million) Forecast, by Application 2019 & 2032
- Table 106: Italy Dried Soups Market Volume (Liters) Forecast, by Application 2019 & 2032
- Table 107: Spain Dried Soups Market Revenue (Million) Forecast, by Application 2019 & 2032
- Table 108: Spain Dried Soups Market Volume (Liters) Forecast, by Application 2019 & 2032
- Table 109: Rest of Europe Dried Soups Market Revenue (Million) Forecast, by Application 2019 & 2032
- Table 110: Rest of Europe Dried Soups Market Volume (Liters) Forecast, by Application 2019 & 2032
- Table 111: Global Dried Soups Market Revenue Million Forecast, by Type 2019 & 2032
- Table 112: Global Dried Soups Market Volume Liters Forecast, by Type 2019 & 2032
- Table 113: Global Dried Soups Market Revenue Million Forecast, by Packaging 2019 & 2032
- Table 114: Global Dried Soups Market Volume Liters Forecast, by Packaging 2019 & 2032
- Table 115: Global Dried Soups Market Revenue Million Forecast, by Distribution Channel 2019 & 2032
- Table 116: Global Dried Soups Market Volume Liters Forecast, by Distribution Channel 2019 & 2032
- Table 117: Global Dried Soups Market Revenue Million Forecast, by Country 2019 & 2032
- Table 118: Global Dried Soups Market Volume Liters Forecast, by Country 2019 & 2032
- Table 119: India Dried Soups Market Revenue (Million) Forecast, by Application 2019 & 2032
- Table 120: India Dried Soups Market Volume (Liters) Forecast, by Application 2019 & 2032
- Table 121: China Dried Soups Market Revenue (Million) Forecast, by Application 2019 & 2032
- Table 122: China Dried Soups Market Volume (Liters) Forecast, by Application 2019 & 2032
- Table 123: Japan Dried Soups Market Revenue (Million) Forecast, by Application 2019 & 2032
- Table 124: Japan Dried Soups Market Volume (Liters) Forecast, by Application 2019 & 2032
- Table 125: Australia Dried Soups Market Revenue (Million) Forecast, by Application 2019 & 2032
- Table 126: Australia Dried Soups Market Volume (Liters) Forecast, by Application 2019 & 2032
- Table 127: Rest of Asia Pacific Dried Soups Market Revenue (Million) Forecast, by Application 2019 & 2032
- Table 128: Rest of Asia Pacific Dried Soups Market Volume (Liters) Forecast, by Application 2019 & 2032
- Table 129: Global Dried Soups Market Revenue Million Forecast, by Type 2019 & 2032
- Table 130: Global Dried Soups Market Volume Liters Forecast, by Type 2019 & 2032
- Table 131: Global Dried Soups Market Revenue Million Forecast, by Packaging 2019 & 2032
- Table 132: Global Dried Soups Market Volume Liters Forecast, by Packaging 2019 & 2032
- Table 133: Global Dried Soups Market Revenue Million Forecast, by Distribution Channel 2019 & 2032
- Table 134: Global Dried Soups Market Volume Liters Forecast, by Distribution Channel 2019 & 2032
- Table 135: Global Dried Soups Market Revenue Million Forecast, by Country 2019 & 2032
- Table 136: Global Dried Soups Market Volume Liters Forecast, by Country 2019 & 2032
- Table 137: Brazil Dried Soups Market Revenue (Million) Forecast, by Application 2019 & 2032
- Table 138: Brazil Dried Soups Market Volume (Liters) Forecast, by Application 2019 & 2032
- Table 139: Argentina Dried Soups Market Revenue (Million) Forecast, by Application 2019 & 2032
- Table 140: Argentina Dried Soups Market Volume (Liters) Forecast, by Application 2019 & 2032
- Table 141: Rest of South America Dried Soups Market Revenue (Million) Forecast, by Application 2019 & 2032
- Table 142: Rest of South America Dried Soups Market Volume (Liters) Forecast, by Application 2019 & 2032
- Table 143: Global Dried Soups Market Revenue Million Forecast, by Type 2019 & 2032
- Table 144: Global Dried Soups Market Volume Liters Forecast, by Type 2019 & 2032
- Table 145: Global Dried Soups Market Revenue Million Forecast, by Packaging 2019 & 2032
- Table 146: Global Dried Soups Market Volume Liters Forecast, by Packaging 2019 & 2032
- Table 147: Global Dried Soups Market Revenue Million Forecast, by Distribution Channel 2019 & 2032
- Table 148: Global Dried Soups Market Volume Liters Forecast, by Distribution Channel 2019 & 2032
- Table 149: Global Dried Soups Market Revenue Million Forecast, by Country 2019 & 2032
- Table 150: Global Dried Soups Market Volume Liters Forecast, by Country 2019 & 2032
- Table 151: Global Dried Soups Market Revenue Million Forecast, by Type 2019 & 2032
- Table 152: Global Dried Soups Market Volume Liters Forecast, by Type 2019 & 2032
- Table 153: Global Dried Soups Market Revenue Million Forecast, by Packaging 2019 & 2032
- Table 154: Global Dried Soups Market Volume Liters Forecast, by Packaging 2019 & 2032
- Table 155: Global Dried Soups Market Revenue Million Forecast, by Distribution Channel 2019 & 2032
- Table 156: Global Dried Soups Market Volume Liters Forecast, by Distribution Channel 2019 & 2032
- Table 157: Global Dried Soups Market Revenue Million Forecast, by Country 2019 & 2032
- Table 158: Global Dried Soups Market Volume Liters Forecast, by Country 2019 & 2032
- Table 159: Saudi Arabia Dried Soups Market Revenue (Million) Forecast, by Application 2019 & 2032
- Table 160: Saudi Arabia Dried Soups Market Volume (Liters) Forecast, by Application 2019 & 2032
- Table 161: Rest of MEA Dried Soups Market Revenue (Million) Forecast, by Application 2019 & 2032
- Table 162: Rest of MEA Dried Soups Market Volume (Liters) Forecast, by Application 2019 & 2032
Frequently Asked Questions
1. What is the projected Compound Annual Growth Rate (CAGR) of the Dried Soups Market?
The projected CAGR is approximately 3.21%.
2. Which companies are prominent players in the Dried Soups Market?
Key companies in the market include B&G Foods Inc, Premier Foods Group Services Ltd, Maya Kaimal Foods LLC, The Kroger Co, Unilever PLC, Hain Celestial Group Inc, Brodo Company, Harmony House Foods Inc *List Not Exhaustive, General Mills, Campbell Soup Co, Kraft Heinz Company, Nestlé S A.
3. What are the main segments of the Dried Soups Market?
The market segments include Type, Packaging, Distribution Channel.
4. Can you provide details about the market size?
The market size is estimated to be USD 15930 Million as of 2022.
5. What are some drivers contributing to market growth?
Prevalence of Lactose Intolerance Driving the Market; Growing Influence of Healthy Lifestyle Trends and Rising Non-Traditional Users.
6. What are the notable trends driving market growth?
Growing Demand for Ready to Eat Food health based foods.
7. Are there any restraints impacting market growth?
Wide Availability of Alternative Protein Sources.
8. Can you provide examples of recent developments in the market?
November 2022: Heinz has launched a fully vegan version of its popular Christmas Dinner Big Soup recipe. The newly developed vegan recipe is filled with plant-based sausage, stuffing balls, and root vegetables, all in a thick gravy. It comes after Heinz released plant-based burgers and mince in October, indicating the brand is embracing the ever-growing vegan market. These products are retailed across convenience stores and supermarkets across the United Kingdom.
9. What pricing options are available for accessing the report?
Pricing options include single-user, multi-user, and enterprise licenses priced at USD 4750, USD 5250, and USD 8750 respectively.
10. Is the market size provided in terms of value or volume?
The market size is provided in terms of value, measured in Million and volume, measured in Liters.
11. Are there any specific market keywords associated with the report?
Yes, the market keyword associated with the report is "Dried Soups Market," which aids in identifying and referencing the specific market segment covered.
12. How do I determine which pricing option suits my needs best?
The pricing options vary based on user requirements and access needs. Individual users may opt for single-user licenses, while businesses requiring broader access may choose multi-user or enterprise licenses for cost-effective access to the report.
13. Are there any additional resources or data provided in the Dried Soups Market report?
While the report offers comprehensive insights, it's advisable to review the specific contents or supplementary materials provided to ascertain if additional resources or data are available.
14. How can I stay updated on further developments or reports in the Dried Soups Market?
To stay informed about further developments, trends, and reports in the Dried Soups Market, consider subscribing to industry newsletters, following relevant companies and organizations, or regularly checking reputable industry news sources and publications.
Methodology
Step 1 - Identification of Relevant Samples Size from Population Database


Step 2 - Approaches for Defining Global Market Size (Value, Volume* & Price*)

Note*: In applicable scenarios
Step 3 - Data Sources
Primary Research
- Web Analytics
- Survey Reports
- Research Institute
- Latest Research Reports
- Opinion Leaders
Secondary Research
- Annual Reports
- White Paper
- Latest Press Release
- Industry Association
- Paid Database
- Investor Presentations

Step 4 - Data Triangulation
Involves using different sources of information in order to increase the validity of a study
These sources are likely to be stakeholders in a program - participants, other researchers, program staff, other community members, and so on.
Then we put all data in single framework & apply various statistical tools to find out the dynamic on the market.
During the analysis stage, feedback from the stakeholder groups would be compared to determine areas of agreement as well as areas of divergence


