
Key Insights
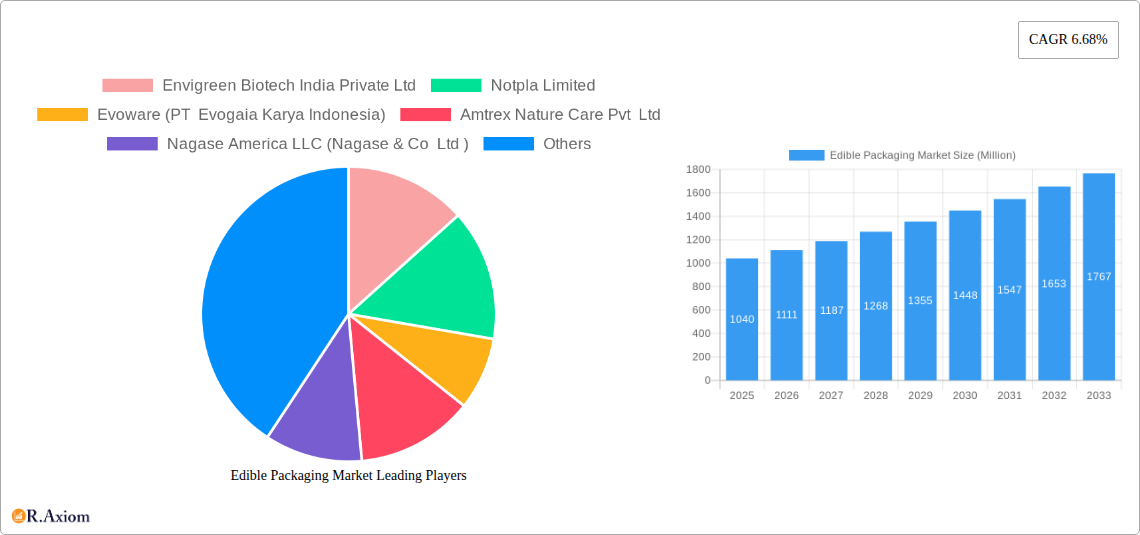
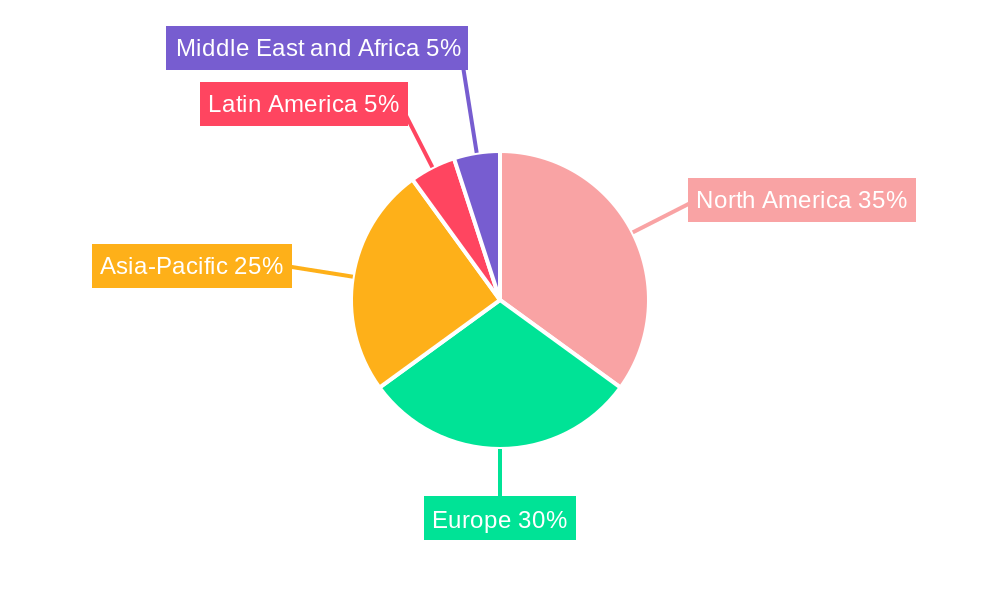
The edible packaging market, valued at $1.04 billion in 2025, is projected to experience robust growth, driven by increasing consumer demand for sustainable and eco-friendly alternatives to traditional packaging materials. The rising awareness of plastic pollution and its detrimental impact on the environment is a key catalyst, pushing both manufacturers and consumers towards biodegradable and compostable solutions. Significant growth is anticipated across various end-user industries, including food and beverage, pharmaceuticals, and cosmetics. The food and beverage sector is expected to remain the dominant segment due to the increasing adoption of edible films and coatings for extending shelf life and enhancing product appeal. Furthermore, technological advancements in material science are leading to the development of more durable, functional, and aesthetically pleasing edible packaging options, further fueling market expansion. The diverse range of raw materials used, including proteins, polysaccharides, and lipids derived from both plant and animal sources, presents opportunities for innovation and customization based on specific product requirements. Regional variations in market growth will likely reflect differing levels of environmental awareness and regulatory landscapes, with North America and Europe expected to lead initially, followed by a surge in demand from Asia-Pacific driven by population growth and rising disposable incomes. However, challenges such as cost competitiveness compared to conventional packaging and maintaining the desired shelf life and barrier properties remain hurdles to overcome.
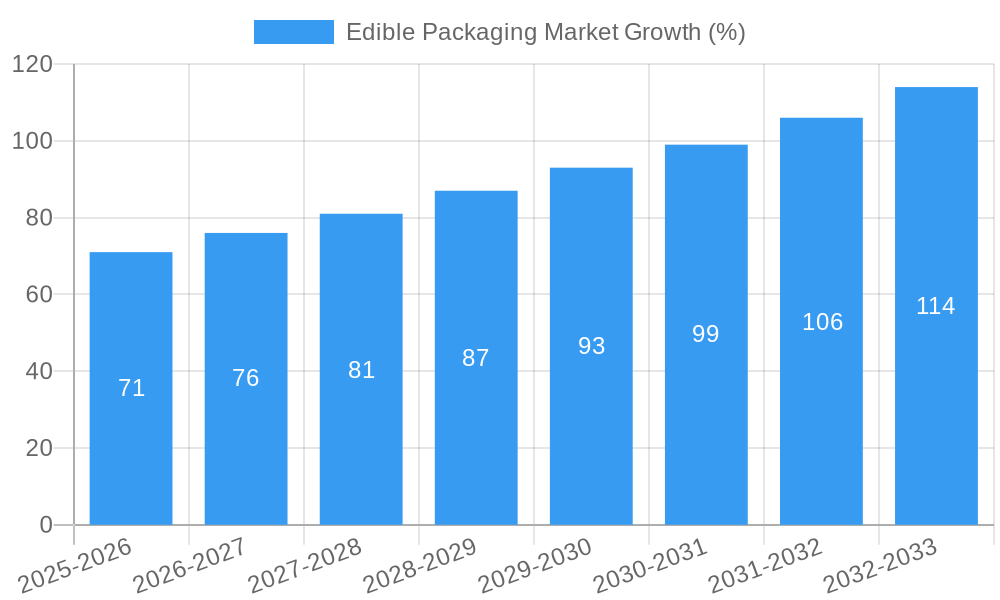
The forecast period (2025-2033) anticipates a consistent CAGR of 6.68%, indicating a continuously expanding market. This growth will be shaped by factors including stricter regulations on plastic waste, growing consumer preference for natural and sustainable products, and continuous R&D efforts resulting in improved edible packaging solutions. While the initial market penetration may be concentrated in niche segments, broader adoption is expected as production efficiency increases and costs decrease, thereby widening accessibility across diverse consumer groups. The competitive landscape involves both established players and innovative startups, fostering competition and innovation in material development, processing techniques, and product design. This dynamic interplay promises to accelerate market growth and diversify the offerings available to consumers.
Edible Packaging Market: A Comprehensive Report (2019-2033)
This comprehensive report provides an in-depth analysis of the global Edible Packaging Market, offering valuable insights for stakeholders across the value chain. With a study period spanning 2019-2033, a base year of 2025, and a forecast period of 2025-2033, this report leverages historical data (2019-2024) to project future market trends and opportunities. The report segments the market by end-user industry (Food, Beverage, Pharmaceutical), region (North America, Europe, Asia-Pacific, Latin America, Middle East & Africa), source (Plant, Animal), and raw material (Protein, Polysaccharides, Lipids, Other Raw Materials). Key players analyzed include Envigreen Biotech India Private Ltd, Notpla Limited, Evoware (PT Evogaia Karya Indonesia), Amtrex Nature Care Pvt Ltd, Nagase America LLC (Nagase & Co Ltd), TSUKIOKA FILM PHARMA CO LTD, ECOLOTEC LIMITED, Devro PLC (Saria Nederland BV), Tipa Corp Ltd, JRF Technology LLC, and Glanbia Plc.
Edible Packaging Market Concentration & Innovation
The edible packaging market exhibits a moderately concentrated landscape, with a few major players holding significant market share. However, the market is also witnessing considerable innovation, driven by the rising consumer demand for sustainable and eco-friendly packaging solutions. The market share of the top 5 players is estimated at xx% in 2025, indicating a competitive yet dynamic environment. Innovation is primarily focused on developing bio-based and biodegradable materials, improving barrier properties, and enhancing the sensory experience of edible packaging. Regulatory frameworks, particularly concerning food safety and environmental regulations, significantly influence market growth. The emergence of product substitutes, such as traditional packaging with improved recyclability, poses a competitive challenge. End-user trends, such as the increasing preference for convenient and sustainable packaging, are driving the market. M&A activities, though not exceptionally frequent, are expected to consolidate the market further. The total value of M&A deals in the edible packaging market during the historical period (2019-2024) is estimated to be around xx Million.
Edible Packaging Market Industry Trends & Insights
The global edible packaging market is experiencing robust growth, projected to register a CAGR of xx% during the forecast period (2025-2033). This growth is primarily fueled by increasing consumer awareness of environmental concerns and the escalating demand for sustainable packaging alternatives. Technological disruptions, such as advancements in biomaterial science and 3D printing, are enabling the development of innovative and functional edible packaging solutions. Consumer preferences are shifting towards packaging that is not only environmentally friendly but also enhances the overall product experience. Competitive dynamics are characterized by both established players and emerging startups vying for market share. Market penetration of edible packaging is still relatively low but is expected to increase significantly, driven by factors like stricter environmental regulations and increasing consumer demand. The market penetration is estimated at xx% in 2025 and is projected to reach xx% by 2033.
Dominant Markets & Segments in Edible Packaging Market
By Region: The Asia-Pacific region is currently the dominant market for edible packaging, driven by factors such as rapidly growing food and beverage industries, increasing disposable incomes, and a rising consumer preference for sustainable products. Key drivers within this region include favorable government policies supporting sustainable packaging, increasing investments in research and development, and the expansion of the retail sector. Europe and North America also exhibit substantial growth, driven by stringent environmental regulations and strong consumer demand for eco-friendly options. Australia and New Zealand are also emerging as promising markets.
By End-User Industry: The food segment currently holds the largest market share, owing to the widespread adoption of edible packaging for various food products. The beverage segment is also a significant contributor, particularly for applications like capsules and sachets. The pharmaceutical industry is increasingly exploring the use of edible packaging for its unique benefits in drug delivery and patient compliance.
By Source & Raw Material: Plant-based materials are the dominant source, owing to their abundance, renewability, and biodegradability. Among raw materials, polysaccharides (such as starch and cellulose) currently hold a substantial share due to their cost-effectiveness and versatility. However, the market for protein and lipid-based edible packaging is growing, driven by the development of novel materials with enhanced functionalities.
Edible Packaging Market Product Developments
Recent product innovations include edible films with improved barrier properties, edible coatings with enhanced antimicrobial activity, and 3D-printed edible structures. These advancements cater to specific applications such as extending shelf life, preserving product quality, and enhancing consumer experience. The competitive advantages arise from superior functionality, sustainability certifications, and cost-effectiveness. Technological trends such as nanotechnology and bioprinting are further shaping the development of next-generation edible packaging solutions that offer improved performance and sustainability.
Report Scope & Segmentation Analysis
This report comprehensively analyzes the edible packaging market across various segments. By End-User Industry: The Food segment is projected to witness significant growth, driven by rising demand for convenient and sustainable packaging. The Beverage segment will follow a similar growth trend, largely influenced by the popularity of single-serve packaging. The Pharmaceutical segment is expected to grow moderately. By Region: The Asia-Pacific region's substantial growth will be driven by rising consumer awareness and increasing disposable incomes. Europe and North America will maintain steady growth. By Source: Plant-based materials will continue to dominate, benefiting from sustainability initiatives. By Raw Material: Polysaccharides will maintain their market leadership, followed by proteins and lipids. Each segment's growth projections are detailed within the report along with a competitive landscape analysis.
Key Drivers of Edible Packaging Market Growth
The edible packaging market's growth is propelled by several factors: increasing consumer demand for sustainable and eco-friendly packaging, stringent environmental regulations restricting the use of conventional plastics, advancements in biomaterial technology enabling the development of innovative edible packaging solutions, and the rising popularity of convenient and single-serve food and beverage products. Furthermore, the growing food industry and increased health awareness play a vital role in the market's expansion.
Challenges in the Edible Packaging Market Sector
Despite significant growth potential, challenges remain. High production costs compared to conventional packaging remain a major hurdle. Maintaining product quality and shelf life, particularly for moisture-sensitive products, poses a technical challenge. Furthermore, maintaining a consistent supply chain, ensuring sufficient raw material availability, and addressing potential regulatory hurdles, especially concerning food safety standards, are crucial concerns for market players.
Emerging Opportunities in Edible Packaging Market
Emerging opportunities include expanding into new applications, particularly in the pharmaceutical and personal care industries. The development of advanced materials with improved barrier properties and functionalities presents significant potential. Moreover, exploring new markets in developing economies with growing demand for sustainable packaging offers considerable growth prospects.
Leading Players in the Edible Packaging Market Market
- Envigreen Biotech India Private Ltd
- Notpla Limited
- Evoware (PT Evogaia Karya Indonesia)
- Amtrex Nature Care Pvt Ltd
- Nagase America LLC (Nagase & Co Ltd)
- TSUKIOKA FILM PHARMA CO LTD
- ECOLOTEC LIMITED
- Devro PLC (Saria Nederland BV)
- Tipa Corp Ltd
- JRF Technology LLC
- Glanbia Plc
Key Developments in Edible Packaging Market Industry
- January 2023: Notpla Limited launched a new seaweed-based edible packaging solution for food applications.
- March 2022: Evoware (PT Evogaia Karya Indonesia) secured a significant investment to expand its production capacity.
- October 2021: A major merger between two edible packaging companies resulted in a stronger market presence. (Further details within the full report)
Strategic Outlook for Edible Packaging Market Market
The edible packaging market holds immense growth potential, driven by increasing consumer demand for sustainable and eco-friendly alternatives to traditional packaging. Continued technological advancements in biomaterial science and the exploration of novel raw materials will further fuel this growth. Strategic partnerships and collaborations between packaging companies and food and beverage producers will play a crucial role in expanding market reach and accelerating adoption rates. The future looks bright for the edible packaging market, with significant growth prospects across diverse sectors and geographical locations.
Edible Packaging Market Segmentation
-
1. Source
- 1.1. Plant
- 1.2. Animal
-
2. Raw Material
- 2.1. Protein
- 2.2. Polysaccharides
- 2.3. Lipids
- 2.4. Other Raw Materials
-
3. End-User Industry
- 3.1. Food
- 3.2. Bevergae
- 3.3. Pharmaceutical
Edible Packaging Market Segmentation By Geography
-
1. North America
- 1.1. United States
- 1.2. Canada
- 1.3. Mexico
-
2. South America
- 2.1. Brazil
- 2.2. Argentina
- 2.3. Rest of South America
-
3. Europe
- 3.1. United Kingdom
- 3.2. Germany
- 3.3. France
- 3.4. Italy
- 3.5. Spain
- 3.6. Russia
- 3.7. Benelux
- 3.8. Nordics
- 3.9. Rest of Europe
-
4. Middle East & Africa
- 4.1. Turkey
- 4.2. Israel
- 4.3. GCC
- 4.4. North Africa
- 4.5. South Africa
- 4.6. Rest of Middle East & Africa
-
5. Asia Pacific
- 5.1. China
- 5.2. India
- 5.3. Japan
- 5.4. South Korea
- 5.5. ASEAN
- 5.6. Oceania
- 5.7. Rest of Asia Pacific
Edible Packaging Market REPORT HIGHLIGHTS
| Aspects | Details |
|---|---|
| Study Period | 2019-2033 |
| Base Year | 2024 |
| Estimated Year | 2025 |
| Forecast Period | 2025-2033 |
| Historical Period | 2019-2024 |
| Growth Rate | CAGR of 6.68% from 2019-2033 |
| Segmentation |
|
Table of Contents
- 1. Introduction
- 1.1. Research Scope
- 1.2. Market Segmentation
- 1.3. Research Methodology
- 1.4. Definitions and Assumptions
- 2. Executive Summary
- 2.1. Introduction
- 3. Market Dynamics
- 3.1. Introduction
- 3.2. Market Drivers
- 3.2.1. Need to Eliminate Type Waste Cycle and Increase Shelf-Life of the Product; Ban on Single-Use-Plastic and Growing Sustainability Concern
- 3.3. Market Restrains
- 3.3.1. High Cost of Production
- 3.4. Market Trends
- 3.4.1. The Increasing Demand for Sustainable Solutions and the Need for Extended Product Shelf-Life are helping drive market growth
- 4. Market Factor Analysis
- 4.1. Porters Five Forces
- 4.2. Supply/Value Chain
- 4.3. PESTEL analysis
- 4.4. Market Entropy
- 4.5. Patent/Trademark Analysis
- 5. Global Edible Packaging Market Analysis, Insights and Forecast, 2019-2031
- 5.1. Market Analysis, Insights and Forecast - by Source
- 5.1.1. Plant
- 5.1.2. Animal
- 5.2. Market Analysis, Insights and Forecast - by Raw Material
- 5.2.1. Protein
- 5.2.2. Polysaccharides
- 5.2.3. Lipids
- 5.2.4. Other Raw Materials
- 5.3. Market Analysis, Insights and Forecast - by End-User Industry
- 5.3.1. Food
- 5.3.2. Bevergae
- 5.3.3. Pharmaceutical
- 5.4. Market Analysis, Insights and Forecast - by Region
- 5.4.1. North America
- 5.4.2. South America
- 5.4.3. Europe
- 5.4.4. Middle East & Africa
- 5.4.5. Asia Pacific
- 5.1. Market Analysis, Insights and Forecast - by Source
- 6. North America Edible Packaging Market Analysis, Insights and Forecast, 2019-2031
- 6.1. Market Analysis, Insights and Forecast - by Source
- 6.1.1. Plant
- 6.1.2. Animal
- 6.2. Market Analysis, Insights and Forecast - by Raw Material
- 6.2.1. Protein
- 6.2.2. Polysaccharides
- 6.2.3. Lipids
- 6.2.4. Other Raw Materials
- 6.3. Market Analysis, Insights and Forecast - by End-User Industry
- 6.3.1. Food
- 6.3.2. Bevergae
- 6.3.3. Pharmaceutical
- 6.1. Market Analysis, Insights and Forecast - by Source
- 7. South America Edible Packaging Market Analysis, Insights and Forecast, 2019-2031
- 7.1. Market Analysis, Insights and Forecast - by Source
- 7.1.1. Plant
- 7.1.2. Animal
- 7.2. Market Analysis, Insights and Forecast - by Raw Material
- 7.2.1. Protein
- 7.2.2. Polysaccharides
- 7.2.3. Lipids
- 7.2.4. Other Raw Materials
- 7.3. Market Analysis, Insights and Forecast - by End-User Industry
- 7.3.1. Food
- 7.3.2. Bevergae
- 7.3.3. Pharmaceutical
- 7.1. Market Analysis, Insights and Forecast - by Source
- 8. Europe Edible Packaging Market Analysis, Insights and Forecast, 2019-2031
- 8.1. Market Analysis, Insights and Forecast - by Source
- 8.1.1. Plant
- 8.1.2. Animal
- 8.2. Market Analysis, Insights and Forecast - by Raw Material
- 8.2.1. Protein
- 8.2.2. Polysaccharides
- 8.2.3. Lipids
- 8.2.4. Other Raw Materials
- 8.3. Market Analysis, Insights and Forecast - by End-User Industry
- 8.3.1. Food
- 8.3.2. Bevergae
- 8.3.3. Pharmaceutical
- 8.1. Market Analysis, Insights and Forecast - by Source
- 9. Middle East & Africa Edible Packaging Market Analysis, Insights and Forecast, 2019-2031
- 9.1. Market Analysis, Insights and Forecast - by Source
- 9.1.1. Plant
- 9.1.2. Animal
- 9.2. Market Analysis, Insights and Forecast - by Raw Material
- 9.2.1. Protein
- 9.2.2. Polysaccharides
- 9.2.3. Lipids
- 9.2.4. Other Raw Materials
- 9.3. Market Analysis, Insights and Forecast - by End-User Industry
- 9.3.1. Food
- 9.3.2. Bevergae
- 9.3.3. Pharmaceutical
- 9.1. Market Analysis, Insights and Forecast - by Source
- 10. Asia Pacific Edible Packaging Market Analysis, Insights and Forecast, 2019-2031
- 10.1. Market Analysis, Insights and Forecast - by Source
- 10.1.1. Plant
- 10.1.2. Animal
- 10.2. Market Analysis, Insights and Forecast - by Raw Material
- 10.2.1. Protein
- 10.2.2. Polysaccharides
- 10.2.3. Lipids
- 10.2.4. Other Raw Materials
- 10.3. Market Analysis, Insights and Forecast - by End-User Industry
- 10.3.1. Food
- 10.3.2. Bevergae
- 10.3.3. Pharmaceutical
- 10.1. Market Analysis, Insights and Forecast - by Source
- 11. Competitive Analysis
- 11.1. Global Market Share Analysis 2024
- 11.2. Company Profiles
- 11.2.1 Envigreen Biotech India Private Ltd
- 11.2.1.1. Overview
- 11.2.1.2. Products
- 11.2.1.3. SWOT Analysis
- 11.2.1.4. Recent Developments
- 11.2.1.5. Financials (Based on Availability)
- 11.2.2 Notpla Limited
- 11.2.2.1. Overview
- 11.2.2.2. Products
- 11.2.2.3. SWOT Analysis
- 11.2.2.4. Recent Developments
- 11.2.2.5. Financials (Based on Availability)
- 11.2.3 Evoware (PT Evogaia Karya Indonesia)
- 11.2.3.1. Overview
- 11.2.3.2. Products
- 11.2.3.3. SWOT Analysis
- 11.2.3.4. Recent Developments
- 11.2.3.5. Financials (Based on Availability)
- 11.2.4 Amtrex Nature Care Pvt Ltd
- 11.2.4.1. Overview
- 11.2.4.2. Products
- 11.2.4.3. SWOT Analysis
- 11.2.4.4. Recent Developments
- 11.2.4.5. Financials (Based on Availability)
- 11.2.5 Nagase America LLC (Nagase & Co Ltd )
- 11.2.5.1. Overview
- 11.2.5.2. Products
- 11.2.5.3. SWOT Analysis
- 11.2.5.4. Recent Developments
- 11.2.5.5. Financials (Based on Availability)
- 11.2.6 TSUKIOKA FILM PHARMA CO LTD
- 11.2.6.1. Overview
- 11.2.6.2. Products
- 11.2.6.3. SWOT Analysis
- 11.2.6.4. Recent Developments
- 11.2.6.5. Financials (Based on Availability)
- 11.2.7 ECOLOTEC LIMITED
- 11.2.7.1. Overview
- 11.2.7.2. Products
- 11.2.7.3. SWOT Analysis
- 11.2.7.4. Recent Developments
- 11.2.7.5. Financials (Based on Availability)
- 11.2.8 Devro PLC (Saria Nederland BV)
- 11.2.8.1. Overview
- 11.2.8.2. Products
- 11.2.8.3. SWOT Analysis
- 11.2.8.4. Recent Developments
- 11.2.8.5. Financials (Based on Availability)
- 11.2.9 Tipa Corp Ltd
- 11.2.9.1. Overview
- 11.2.9.2. Products
- 11.2.9.3. SWOT Analysis
- 11.2.9.4. Recent Developments
- 11.2.9.5. Financials (Based on Availability)
- 11.2.10 JRF Technology LLC
- 11.2.10.1. Overview
- 11.2.10.2. Products
- 11.2.10.3. SWOT Analysis
- 11.2.10.4. Recent Developments
- 11.2.10.5. Financials (Based on Availability)
- 11.2.11 Glanbia Plc
- 11.2.11.1. Overview
- 11.2.11.2. Products
- 11.2.11.3. SWOT Analysis
- 11.2.11.4. Recent Developments
- 11.2.11.5. Financials (Based on Availability)
- 11.2.1 Envigreen Biotech India Private Ltd
List of Figures
- Figure 1: Global Edible Packaging Market Revenue Breakdown (Million, %) by Region 2024 & 2032
- Figure 2: Global Edible Packaging Market Volume Breakdown (K Tons, %) by Region 2024 & 2032
- Figure 3: North America Edible Packaging Market Revenue (Million), by Source 2024 & 2032
- Figure 4: North America Edible Packaging Market Volume (K Tons), by Source 2024 & 2032
- Figure 5: North America Edible Packaging Market Revenue Share (%), by Source 2024 & 2032
- Figure 6: North America Edible Packaging Market Volume Share (%), by Source 2024 & 2032
- Figure 7: North America Edible Packaging Market Revenue (Million), by Raw Material 2024 & 2032
- Figure 8: North America Edible Packaging Market Volume (K Tons), by Raw Material 2024 & 2032
- Figure 9: North America Edible Packaging Market Revenue Share (%), by Raw Material 2024 & 2032
- Figure 10: North America Edible Packaging Market Volume Share (%), by Raw Material 2024 & 2032
- Figure 11: North America Edible Packaging Market Revenue (Million), by End-User Industry 2024 & 2032
- Figure 12: North America Edible Packaging Market Volume (K Tons), by End-User Industry 2024 & 2032
- Figure 13: North America Edible Packaging Market Revenue Share (%), by End-User Industry 2024 & 2032
- Figure 14: North America Edible Packaging Market Volume Share (%), by End-User Industry 2024 & 2032
- Figure 15: North America Edible Packaging Market Revenue (Million), by Country 2024 & 2032
- Figure 16: North America Edible Packaging Market Volume (K Tons), by Country 2024 & 2032
- Figure 17: North America Edible Packaging Market Revenue Share (%), by Country 2024 & 2032
- Figure 18: North America Edible Packaging Market Volume Share (%), by Country 2024 & 2032
- Figure 19: South America Edible Packaging Market Revenue (Million), by Source 2024 & 2032
- Figure 20: South America Edible Packaging Market Volume (K Tons), by Source 2024 & 2032
- Figure 21: South America Edible Packaging Market Revenue Share (%), by Source 2024 & 2032
- Figure 22: South America Edible Packaging Market Volume Share (%), by Source 2024 & 2032
- Figure 23: South America Edible Packaging Market Revenue (Million), by Raw Material 2024 & 2032
- Figure 24: South America Edible Packaging Market Volume (K Tons), by Raw Material 2024 & 2032
- Figure 25: South America Edible Packaging Market Revenue Share (%), by Raw Material 2024 & 2032
- Figure 26: South America Edible Packaging Market Volume Share (%), by Raw Material 2024 & 2032
- Figure 27: South America Edible Packaging Market Revenue (Million), by End-User Industry 2024 & 2032
- Figure 28: South America Edible Packaging Market Volume (K Tons), by End-User Industry 2024 & 2032
- Figure 29: South America Edible Packaging Market Revenue Share (%), by End-User Industry 2024 & 2032
- Figure 30: South America Edible Packaging Market Volume Share (%), by End-User Industry 2024 & 2032
- Figure 31: South America Edible Packaging Market Revenue (Million), by Country 2024 & 2032
- Figure 32: South America Edible Packaging Market Volume (K Tons), by Country 2024 & 2032
- Figure 33: South America Edible Packaging Market Revenue Share (%), by Country 2024 & 2032
- Figure 34: South America Edible Packaging Market Volume Share (%), by Country 2024 & 2032
- Figure 35: Europe Edible Packaging Market Revenue (Million), by Source 2024 & 2032
- Figure 36: Europe Edible Packaging Market Volume (K Tons), by Source 2024 & 2032
- Figure 37: Europe Edible Packaging Market Revenue Share (%), by Source 2024 & 2032
- Figure 38: Europe Edible Packaging Market Volume Share (%), by Source 2024 & 2032
- Figure 39: Europe Edible Packaging Market Revenue (Million), by Raw Material 2024 & 2032
- Figure 40: Europe Edible Packaging Market Volume (K Tons), by Raw Material 2024 & 2032
- Figure 41: Europe Edible Packaging Market Revenue Share (%), by Raw Material 2024 & 2032
- Figure 42: Europe Edible Packaging Market Volume Share (%), by Raw Material 2024 & 2032
- Figure 43: Europe Edible Packaging Market Revenue (Million), by End-User Industry 2024 & 2032
- Figure 44: Europe Edible Packaging Market Volume (K Tons), by End-User Industry 2024 & 2032
- Figure 45: Europe Edible Packaging Market Revenue Share (%), by End-User Industry 2024 & 2032
- Figure 46: Europe Edible Packaging Market Volume Share (%), by End-User Industry 2024 & 2032
- Figure 47: Europe Edible Packaging Market Revenue (Million), by Country 2024 & 2032
- Figure 48: Europe Edible Packaging Market Volume (K Tons), by Country 2024 & 2032
- Figure 49: Europe Edible Packaging Market Revenue Share (%), by Country 2024 & 2032
- Figure 50: Europe Edible Packaging Market Volume Share (%), by Country 2024 & 2032
- Figure 51: Middle East & Africa Edible Packaging Market Revenue (Million), by Source 2024 & 2032
- Figure 52: Middle East & Africa Edible Packaging Market Volume (K Tons), by Source 2024 & 2032
- Figure 53: Middle East & Africa Edible Packaging Market Revenue Share (%), by Source 2024 & 2032
- Figure 54: Middle East & Africa Edible Packaging Market Volume Share (%), by Source 2024 & 2032
- Figure 55: Middle East & Africa Edible Packaging Market Revenue (Million), by Raw Material 2024 & 2032
- Figure 56: Middle East & Africa Edible Packaging Market Volume (K Tons), by Raw Material 2024 & 2032
- Figure 57: Middle East & Africa Edible Packaging Market Revenue Share (%), by Raw Material 2024 & 2032
- Figure 58: Middle East & Africa Edible Packaging Market Volume Share (%), by Raw Material 2024 & 2032
- Figure 59: Middle East & Africa Edible Packaging Market Revenue (Million), by End-User Industry 2024 & 2032
- Figure 60: Middle East & Africa Edible Packaging Market Volume (K Tons), by End-User Industry 2024 & 2032
- Figure 61: Middle East & Africa Edible Packaging Market Revenue Share (%), by End-User Industry 2024 & 2032
- Figure 62: Middle East & Africa Edible Packaging Market Volume Share (%), by End-User Industry 2024 & 2032
- Figure 63: Middle East & Africa Edible Packaging Market Revenue (Million), by Country 2024 & 2032
- Figure 64: Middle East & Africa Edible Packaging Market Volume (K Tons), by Country 2024 & 2032
- Figure 65: Middle East & Africa Edible Packaging Market Revenue Share (%), by Country 2024 & 2032
- Figure 66: Middle East & Africa Edible Packaging Market Volume Share (%), by Country 2024 & 2032
- Figure 67: Asia Pacific Edible Packaging Market Revenue (Million), by Source 2024 & 2032
- Figure 68: Asia Pacific Edible Packaging Market Volume (K Tons), by Source 2024 & 2032
- Figure 69: Asia Pacific Edible Packaging Market Revenue Share (%), by Source 2024 & 2032
- Figure 70: Asia Pacific Edible Packaging Market Volume Share (%), by Source 2024 & 2032
- Figure 71: Asia Pacific Edible Packaging Market Revenue (Million), by Raw Material 2024 & 2032
- Figure 72: Asia Pacific Edible Packaging Market Volume (K Tons), by Raw Material 2024 & 2032
- Figure 73: Asia Pacific Edible Packaging Market Revenue Share (%), by Raw Material 2024 & 2032
- Figure 74: Asia Pacific Edible Packaging Market Volume Share (%), by Raw Material 2024 & 2032
- Figure 75: Asia Pacific Edible Packaging Market Revenue (Million), by End-User Industry 2024 & 2032
- Figure 76: Asia Pacific Edible Packaging Market Volume (K Tons), by End-User Industry 2024 & 2032
- Figure 77: Asia Pacific Edible Packaging Market Revenue Share (%), by End-User Industry 2024 & 2032
- Figure 78: Asia Pacific Edible Packaging Market Volume Share (%), by End-User Industry 2024 & 2032
- Figure 79: Asia Pacific Edible Packaging Market Revenue (Million), by Country 2024 & 2032
- Figure 80: Asia Pacific Edible Packaging Market Volume (K Tons), by Country 2024 & 2032
- Figure 81: Asia Pacific Edible Packaging Market Revenue Share (%), by Country 2024 & 2032
- Figure 82: Asia Pacific Edible Packaging Market Volume Share (%), by Country 2024 & 2032
List of Tables
- Table 1: Global Edible Packaging Market Revenue Million Forecast, by Region 2019 & 2032
- Table 2: Global Edible Packaging Market Volume K Tons Forecast, by Region 2019 & 2032
- Table 3: Global Edible Packaging Market Revenue Million Forecast, by Source 2019 & 2032
- Table 4: Global Edible Packaging Market Volume K Tons Forecast, by Source 2019 & 2032
- Table 5: Global Edible Packaging Market Revenue Million Forecast, by Raw Material 2019 & 2032
- Table 6: Global Edible Packaging Market Volume K Tons Forecast, by Raw Material 2019 & 2032
- Table 7: Global Edible Packaging Market Revenue Million Forecast, by End-User Industry 2019 & 2032
- Table 8: Global Edible Packaging Market Volume K Tons Forecast, by End-User Industry 2019 & 2032
- Table 9: Global Edible Packaging Market Revenue Million Forecast, by Region 2019 & 2032
- Table 10: Global Edible Packaging Market Volume K Tons Forecast, by Region 2019 & 2032
- Table 11: Global Edible Packaging Market Revenue Million Forecast, by Source 2019 & 2032
- Table 12: Global Edible Packaging Market Volume K Tons Forecast, by Source 2019 & 2032
- Table 13: Global Edible Packaging Market Revenue Million Forecast, by Raw Material 2019 & 2032
- Table 14: Global Edible Packaging Market Volume K Tons Forecast, by Raw Material 2019 & 2032
- Table 15: Global Edible Packaging Market Revenue Million Forecast, by End-User Industry 2019 & 2032
- Table 16: Global Edible Packaging Market Volume K Tons Forecast, by End-User Industry 2019 & 2032
- Table 17: Global Edible Packaging Market Revenue Million Forecast, by Country 2019 & 2032
- Table 18: Global Edible Packaging Market Volume K Tons Forecast, by Country 2019 & 2032
- Table 19: United States Edible Packaging Market Revenue (Million) Forecast, by Application 2019 & 2032
- Table 20: United States Edible Packaging Market Volume (K Tons) Forecast, by Application 2019 & 2032
- Table 21: Canada Edible Packaging Market Revenue (Million) Forecast, by Application 2019 & 2032
- Table 22: Canada Edible Packaging Market Volume (K Tons) Forecast, by Application 2019 & 2032
- Table 23: Mexico Edible Packaging Market Revenue (Million) Forecast, by Application 2019 & 2032
- Table 24: Mexico Edible Packaging Market Volume (K Tons) Forecast, by Application 2019 & 2032
- Table 25: Global Edible Packaging Market Revenue Million Forecast, by Source 2019 & 2032
- Table 26: Global Edible Packaging Market Volume K Tons Forecast, by Source 2019 & 2032
- Table 27: Global Edible Packaging Market Revenue Million Forecast, by Raw Material 2019 & 2032
- Table 28: Global Edible Packaging Market Volume K Tons Forecast, by Raw Material 2019 & 2032
- Table 29: Global Edible Packaging Market Revenue Million Forecast, by End-User Industry 2019 & 2032
- Table 30: Global Edible Packaging Market Volume K Tons Forecast, by End-User Industry 2019 & 2032
- Table 31: Global Edible Packaging Market Revenue Million Forecast, by Country 2019 & 2032
- Table 32: Global Edible Packaging Market Volume K Tons Forecast, by Country 2019 & 2032
- Table 33: Brazil Edible Packaging Market Revenue (Million) Forecast, by Application 2019 & 2032
- Table 34: Brazil Edible Packaging Market Volume (K Tons) Forecast, by Application 2019 & 2032
- Table 35: Argentina Edible Packaging Market Revenue (Million) Forecast, by Application 2019 & 2032
- Table 36: Argentina Edible Packaging Market Volume (K Tons) Forecast, by Application 2019 & 2032
- Table 37: Rest of South America Edible Packaging Market Revenue (Million) Forecast, by Application 2019 & 2032
- Table 38: Rest of South America Edible Packaging Market Volume (K Tons) Forecast, by Application 2019 & 2032
- Table 39: Global Edible Packaging Market Revenue Million Forecast, by Source 2019 & 2032
- Table 40: Global Edible Packaging Market Volume K Tons Forecast, by Source 2019 & 2032
- Table 41: Global Edible Packaging Market Revenue Million Forecast, by Raw Material 2019 & 2032
- Table 42: Global Edible Packaging Market Volume K Tons Forecast, by Raw Material 2019 & 2032
- Table 43: Global Edible Packaging Market Revenue Million Forecast, by End-User Industry 2019 & 2032
- Table 44: Global Edible Packaging Market Volume K Tons Forecast, by End-User Industry 2019 & 2032
- Table 45: Global Edible Packaging Market Revenue Million Forecast, by Country 2019 & 2032
- Table 46: Global Edible Packaging Market Volume K Tons Forecast, by Country 2019 & 2032
- Table 47: United Kingdom Edible Packaging Market Revenue (Million) Forecast, by Application 2019 & 2032
- Table 48: United Kingdom Edible Packaging Market Volume (K Tons) Forecast, by Application 2019 & 2032
- Table 49: Germany Edible Packaging Market Revenue (Million) Forecast, by Application 2019 & 2032
- Table 50: Germany Edible Packaging Market Volume (K Tons) Forecast, by Application 2019 & 2032
- Table 51: France Edible Packaging Market Revenue (Million) Forecast, by Application 2019 & 2032
- Table 52: France Edible Packaging Market Volume (K Tons) Forecast, by Application 2019 & 2032
- Table 53: Italy Edible Packaging Market Revenue (Million) Forecast, by Application 2019 & 2032
- Table 54: Italy Edible Packaging Market Volume (K Tons) Forecast, by Application 2019 & 2032
- Table 55: Spain Edible Packaging Market Revenue (Million) Forecast, by Application 2019 & 2032
- Table 56: Spain Edible Packaging Market Volume (K Tons) Forecast, by Application 2019 & 2032
- Table 57: Russia Edible Packaging Market Revenue (Million) Forecast, by Application 2019 & 2032
- Table 58: Russia Edible Packaging Market Volume (K Tons) Forecast, by Application 2019 & 2032
- Table 59: Benelux Edible Packaging Market Revenue (Million) Forecast, by Application 2019 & 2032
- Table 60: Benelux Edible Packaging Market Volume (K Tons) Forecast, by Application 2019 & 2032
- Table 61: Nordics Edible Packaging Market Revenue (Million) Forecast, by Application 2019 & 2032
- Table 62: Nordics Edible Packaging Market Volume (K Tons) Forecast, by Application 2019 & 2032
- Table 63: Rest of Europe Edible Packaging Market Revenue (Million) Forecast, by Application 2019 & 2032
- Table 64: Rest of Europe Edible Packaging Market Volume (K Tons) Forecast, by Application 2019 & 2032
- Table 65: Global Edible Packaging Market Revenue Million Forecast, by Source 2019 & 2032
- Table 66: Global Edible Packaging Market Volume K Tons Forecast, by Source 2019 & 2032
- Table 67: Global Edible Packaging Market Revenue Million Forecast, by Raw Material 2019 & 2032
- Table 68: Global Edible Packaging Market Volume K Tons Forecast, by Raw Material 2019 & 2032
- Table 69: Global Edible Packaging Market Revenue Million Forecast, by End-User Industry 2019 & 2032
- Table 70: Global Edible Packaging Market Volume K Tons Forecast, by End-User Industry 2019 & 2032
- Table 71: Global Edible Packaging Market Revenue Million Forecast, by Country 2019 & 2032
- Table 72: Global Edible Packaging Market Volume K Tons Forecast, by Country 2019 & 2032
- Table 73: Turkey Edible Packaging Market Revenue (Million) Forecast, by Application 2019 & 2032
- Table 74: Turkey Edible Packaging Market Volume (K Tons) Forecast, by Application 2019 & 2032
- Table 75: Israel Edible Packaging Market Revenue (Million) Forecast, by Application 2019 & 2032
- Table 76: Israel Edible Packaging Market Volume (K Tons) Forecast, by Application 2019 & 2032
- Table 77: GCC Edible Packaging Market Revenue (Million) Forecast, by Application 2019 & 2032
- Table 78: GCC Edible Packaging Market Volume (K Tons) Forecast, by Application 2019 & 2032
- Table 79: North Africa Edible Packaging Market Revenue (Million) Forecast, by Application 2019 & 2032
- Table 80: North Africa Edible Packaging Market Volume (K Tons) Forecast, by Application 2019 & 2032
- Table 81: South Africa Edible Packaging Market Revenue (Million) Forecast, by Application 2019 & 2032
- Table 82: South Africa Edible Packaging Market Volume (K Tons) Forecast, by Application 2019 & 2032
- Table 83: Rest of Middle East & Africa Edible Packaging Market Revenue (Million) Forecast, by Application 2019 & 2032
- Table 84: Rest of Middle East & Africa Edible Packaging Market Volume (K Tons) Forecast, by Application 2019 & 2032
- Table 85: Global Edible Packaging Market Revenue Million Forecast, by Source 2019 & 2032
- Table 86: Global Edible Packaging Market Volume K Tons Forecast, by Source 2019 & 2032
- Table 87: Global Edible Packaging Market Revenue Million Forecast, by Raw Material 2019 & 2032
- Table 88: Global Edible Packaging Market Volume K Tons Forecast, by Raw Material 2019 & 2032
- Table 89: Global Edible Packaging Market Revenue Million Forecast, by End-User Industry 2019 & 2032
- Table 90: Global Edible Packaging Market Volume K Tons Forecast, by End-User Industry 2019 & 2032
- Table 91: Global Edible Packaging Market Revenue Million Forecast, by Country 2019 & 2032
- Table 92: Global Edible Packaging Market Volume K Tons Forecast, by Country 2019 & 2032
- Table 93: China Edible Packaging Market Revenue (Million) Forecast, by Application 2019 & 2032
- Table 94: China Edible Packaging Market Volume (K Tons) Forecast, by Application 2019 & 2032
- Table 95: India Edible Packaging Market Revenue (Million) Forecast, by Application 2019 & 2032
- Table 96: India Edible Packaging Market Volume (K Tons) Forecast, by Application 2019 & 2032
- Table 97: Japan Edible Packaging Market Revenue (Million) Forecast, by Application 2019 & 2032
- Table 98: Japan Edible Packaging Market Volume (K Tons) Forecast, by Application 2019 & 2032
- Table 99: South Korea Edible Packaging Market Revenue (Million) Forecast, by Application 2019 & 2032
- Table 100: South Korea Edible Packaging Market Volume (K Tons) Forecast, by Application 2019 & 2032
- Table 101: ASEAN Edible Packaging Market Revenue (Million) Forecast, by Application 2019 & 2032
- Table 102: ASEAN Edible Packaging Market Volume (K Tons) Forecast, by Application 2019 & 2032
- Table 103: Oceania Edible Packaging Market Revenue (Million) Forecast, by Application 2019 & 2032
- Table 104: Oceania Edible Packaging Market Volume (K Tons) Forecast, by Application 2019 & 2032
- Table 105: Rest of Asia Pacific Edible Packaging Market Revenue (Million) Forecast, by Application 2019 & 2032
- Table 106: Rest of Asia Pacific Edible Packaging Market Volume (K Tons) Forecast, by Application 2019 & 2032
Frequently Asked Questions
1. What is the projected Compound Annual Growth Rate (CAGR) of the Edible Packaging Market?
The projected CAGR is approximately 6.68%.
2. Which companies are prominent players in the Edible Packaging Market?
Key companies in the market include Envigreen Biotech India Private Ltd, Notpla Limited, Evoware (PT Evogaia Karya Indonesia), Amtrex Nature Care Pvt Ltd, Nagase America LLC (Nagase & Co Ltd ), TSUKIOKA FILM PHARMA CO LTD, ECOLOTEC LIMITED, Devro PLC (Saria Nederland BV), Tipa Corp Ltd, JRF Technology LLC, Glanbia Plc.
3. What are the main segments of the Edible Packaging Market?
The market segments include Source, Raw Material, End-User Industry.
4. Can you provide details about the market size?
The market size is estimated to be USD 1.04 Million as of 2022.
5. What are some drivers contributing to market growth?
Need to Eliminate Type Waste Cycle and Increase Shelf-Life of the Product; Ban on Single-Use-Plastic and Growing Sustainability Concern.
6. What are the notable trends driving market growth?
The Increasing Demand for Sustainable Solutions and the Need for Extended Product Shelf-Life are helping drive market growth.
7. Are there any restraints impacting market growth?
High Cost of Production.
8. Can you provide examples of recent developments in the market?
N/A
9. What pricing options are available for accessing the report?
Pricing options include single-user, multi-user, and enterprise licenses priced at USD 4750, USD 5250, and USD 8750 respectively.
10. Is the market size provided in terms of value or volume?
The market size is provided in terms of value, measured in Million and volume, measured in K Tons.
11. Are there any specific market keywords associated with the report?
Yes, the market keyword associated with the report is "Edible Packaging Market," which aids in identifying and referencing the specific market segment covered.
12. How do I determine which pricing option suits my needs best?
The pricing options vary based on user requirements and access needs. Individual users may opt for single-user licenses, while businesses requiring broader access may choose multi-user or enterprise licenses for cost-effective access to the report.
13. Are there any additional resources or data provided in the Edible Packaging Market report?
While the report offers comprehensive insights, it's advisable to review the specific contents or supplementary materials provided to ascertain if additional resources or data are available.
14. How can I stay updated on further developments or reports in the Edible Packaging Market?
To stay informed about further developments, trends, and reports in the Edible Packaging Market, consider subscribing to industry newsletters, following relevant companies and organizations, or regularly checking reputable industry news sources and publications.
Methodology
Step 1 - Identification of Relevant Samples Size from Population Database


Step 2 - Approaches for Defining Global Market Size (Value, Volume* & Price*)

Note*: In applicable scenarios
Step 3 - Data Sources
Primary Research
- Web Analytics
- Survey Reports
- Research Institute
- Latest Research Reports
- Opinion Leaders
Secondary Research
- Annual Reports
- White Paper
- Latest Press Release
- Industry Association
- Paid Database
- Investor Presentations

Step 4 - Data Triangulation
Involves using different sources of information in order to increase the validity of a study
These sources are likely to be stakeholders in a program - participants, other researchers, program staff, other community members, and so on.
Then we put all data in single framework & apply various statistical tools to find out the dynamic on the market.
During the analysis stage, feedback from the stakeholder groups would be compared to determine areas of agreement as well as areas of divergence


