Key Insights
The global edutainment sector is poised for significant expansion, driven by increasing disposable incomes, a growing demand for enriching childhood learning experiences, and the pervasive integration of technology in educational entertainment. The industry is projected to reach a market size of 3 billion, exhibiting a Compound Annual Growth Rate (CAGR) of 16.1%. Key growth catalysts include the rising popularity of experiential learning, parental investment in child development, and the recognized benefits of combining education with entertainment. The market encompasses various formats, from indoor play centers and interactive museums to technology-driven platforms. Leading companies are innovating through immersive experiences, personalized learning, and strategic alliances to capture market share. While North America and Europe currently dominate adoption, emerging markets are expected to experience substantial growth due to urbanization and an expanding middle class.
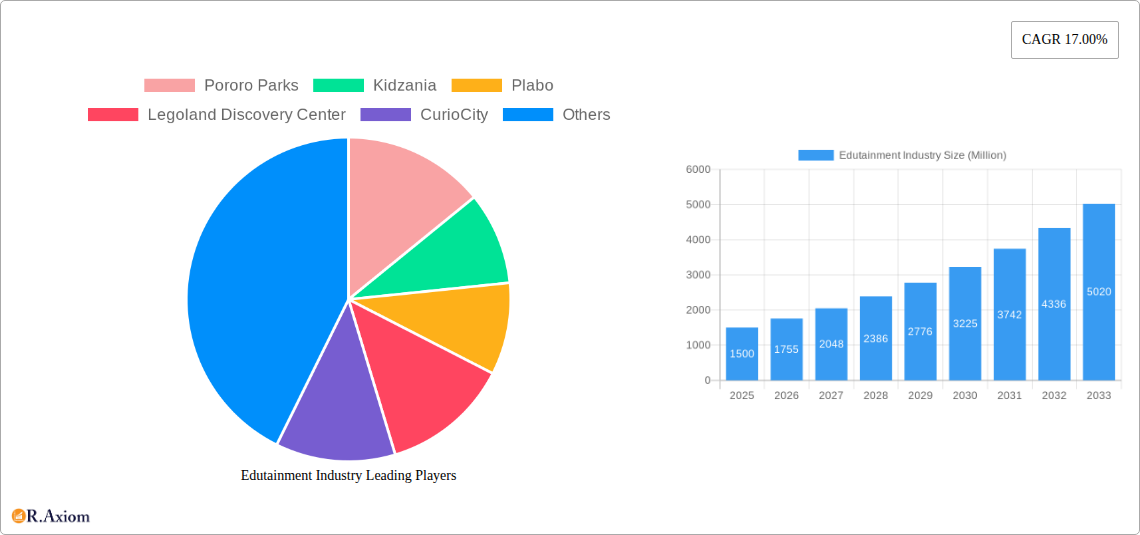
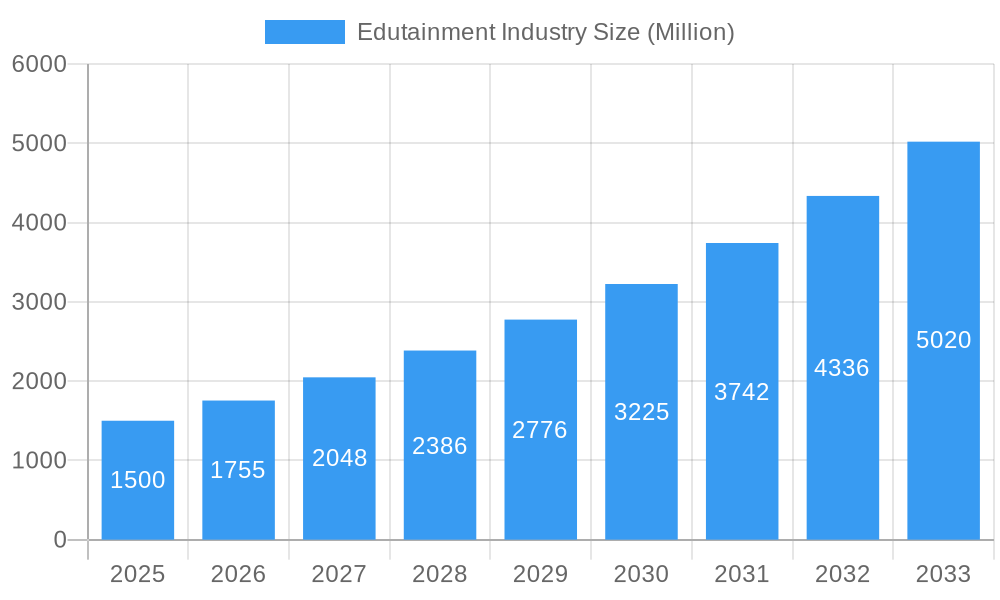
Edutainment Industry Market Size (In Billion)
The forecast period, extending to 2033 from a base year of 2025, anticipates continued industry advancement. Although economic cycles and evolving consumer preferences may influence the pace of growth, the long-term outlook remains strong, bolstered by technological innovation, global market penetration, and a sustained focus on early childhood development and STEM education. Growth will be influenced by both established entities and emerging tech-focused players offering personalized learning solutions. Market consolidation is anticipated as larger companies seek strategic acquisitions to enhance market presence and achieve economies of scale. Regulatory frameworks and safety standards will also play a critical role in industry evolution.
Edutainment Industry Company Market Share
This comprehensive market research report provides in-depth analysis of the global edutainment industry, delivering crucial insights for investors, stakeholders, and strategic planners. Spanning from 2019 to 2033, with analysis centered on the base year of 2025 and projections for the 2025-2033 period, the report offers a thorough understanding of historical trends, current dynamics, and future growth trajectories. The report details key market participants including Pororo Parks, Kidzania, Plabo, Legoland Discovery Center, CurioCity, Kindercity, Mattel Play! Town, Totter's Otterville, Kidz Holding S A L, Little Explorers, ConveGenius, Grey Sim, Edsys, IdeaCrate Edutainment Company, and DreamUs Edutainment. The global edutainment market is projected to reach substantial figures by 2033.
Edutainment Industry Market Concentration & Innovation
This section analyzes the level of market concentration within the edutainment industry, identifying key players and their respective market shares. The report examines the drivers of innovation, including technological advancements and evolving consumer preferences. Regulatory frameworks impacting the industry are also explored, along with a discussion of product substitutes and their influence on market competition. Furthermore, the report investigates end-user trends and their impact on market demand. Finally, it analyzes mergers and acquisitions (M&A) activities, providing insights into deal values and their implications for market consolidation.
- Market Concentration: The global edutainment market is characterized by a moderately concentrated landscape, with a few large players commanding significant market share. The top five players account for approximately xx% of the total market revenue in 2025.
- Innovation Drivers: Technological advancements such as augmented reality (AR) and virtual reality (VR) are driving innovation in the edutainment sector, leading to more immersive and engaging learning experiences.
- M&A Activities: The past five years have witnessed a significant increase in M&A activities within the edutainment industry, with deal values exceeding xx Million in 2024. These activities are primarily driven by the need for expansion, diversification, and acquisition of innovative technologies.
Edutainment Industry Industry Trends & Insights
This section delves into the key trends shaping the edutainment industry's trajectory. It explores market growth drivers, pinpointing factors like increasing disposable incomes, rising demand for engaging learning experiences, and governmental support for educational initiatives. Technological disruptions, including the adoption of digital learning platforms and gamification techniques, are also analyzed. The report examines consumer preferences, considering the evolving expectations of parents and children towards educational entertainment. Finally, a comprehensive overview of the competitive dynamics is provided, including an assessment of the competitive intensity and strategic actions taken by major players. The report projects a Compound Annual Growth Rate (CAGR) of xx% for the forecast period (2025-2033). Market penetration is expected to reach xx% by 2033, indicating substantial growth potential.
Dominant Markets & Segments in Edutainment Industry
This section identifies the leading geographical regions and market segments within the edutainment industry. A detailed analysis of the dominant market is provided, focusing on the key factors driving its success. Economic policies, infrastructure development, and consumer behavior are among the elements considered.
- Key Drivers in the Dominant Market:
- Robust economic growth: Leading to increased disposable incomes and spending on educational entertainment.
- Supportive government policies: Encouraging investment in the edutainment sector through tax incentives and funding programs.
- Well-developed infrastructure: Facilitating the establishment and operation of edutainment centers.
- High consumer awareness: Of the educational benefits of edutainment.
The dominant market (e.g., North America) exhibits strong growth potential due to a combination of favorable macroeconomic conditions, supportive regulatory frameworks, and high consumer demand. The report provides a detailed comparative analysis of other key regional markets.
Edutainment Industry Product Developments
Recent product innovations in the edutainment industry have focused on incorporating interactive technologies, such as AR and VR, to create more engaging and immersive learning experiences. This includes the development of interactive exhibits, educational games, and virtual field trips. These innovations offer competitive advantages by enhancing learning outcomes and providing unique educational experiences. The integration of these technologies reflects the industry's response to evolving consumer preferences and technological advancements.
Report Scope & Segmentation Analysis
The report segments the edutainment market based on various factors, including product type (e.g., theme parks, museums, educational apps), target audience (e.g., preschoolers, school-aged children, adults), and geography (e.g., North America, Europe, Asia-Pacific). Each segment's growth projections, market size, and competitive dynamics are analyzed. For example, the theme park segment is projected to experience significant growth, driven by increasing tourism and family entertainment spending.
Key Drivers of Edutainment Industry Growth
The growth of the edutainment industry is fueled by several key drivers. Technological advancements, such as AR and VR, are creating more immersive and engaging learning experiences. Economic factors, including rising disposable incomes and increased investment in education, also play a significant role. Moreover, supportive government policies and regulations are fostering industry growth. For instance, increased government funding for educational initiatives is driving demand for edutainment services.
Challenges in the Edutainment Industry Sector
The edutainment industry faces several challenges, including regulatory hurdles related to safety and content standards, which can increase operational costs and slow down expansion. Supply chain disruptions caused by global events can also affect the availability of materials and equipment, impacting production and profitability. Furthermore, intense competition from established players and new entrants puts pressure on pricing and margins. These factors collectively impact profitability and market penetration.
Emerging Opportunities in Edutainment Industry
Several emerging opportunities exist for growth within the edutainment industry. The expansion into new geographical markets with high growth potential presents a significant opportunity for industry players. The development and adoption of innovative technologies, such as AI and personalized learning platforms, promise to enhance user experience and create new revenue streams. Changes in consumer preferences, such as the increasing demand for personalized and customized experiences, provide a chance for companies to deliver tailored edutainment offerings.
Leading Players in the Edutainment Industry Market
- Pororo Parks
- Kidzania
- Plabo
- Legoland Discovery Center
- CurioCity
- Kindercity
- Mattel Play! Town
- Totter's Otterville
- Kidz Holding S A L
- Little Explorers
- ConveGenius
- Grey Sim
- Edsys
- IdeaCrate Edutainment Company
- DreamUs Edutainment
Key Developments in Edutainment Industry Industry
- January 2023: Kidzania launched a new interactive exhibit incorporating AR technology.
- June 2022: Pororo Parks opened a new location in a rapidly growing metropolitan area.
- October 2021: A major merger between two edutainment companies resulted in a significant market share consolidation. (XX Million deal value)
Strategic Outlook for Edutainment Industry Market
The edutainment industry is poised for continued growth, driven by favorable demographic trends, technological advancements, and increasing consumer demand for engaging learning experiences. The market offers significant opportunities for companies to capitalize on emerging technologies, expanding into new markets, and developing innovative educational products. Strategic partnerships and acquisitions will likely play a key role in shaping the competitive landscape and driving market consolidation in the coming years.
Edutainment Industry Segmentation
-
1. product type
- 1.1. Interactive
- 1.2. Non interactive
- 1.3. Hybrid
- 1.4. Explorative
-
2. end use age group
- 2.1. Children
- 2.2. Teenagers
- 2.3. Young Adult
-
3. region/ country
- 3.1. United States of America
- 3.2. Europe
- 3.3. China
- 3.4. Japan
- 3.5. South East Asia
- 3.6. India
- 3.7. Central and South America
Edutainment Industry Segmentation By Geography
-
1. North America
- 1.1. United States
- 1.2. Canada
- 1.3. Mexico
-
2. South America
- 2.1. Brazil
- 2.2. Argentina
- 2.3. Rest of South America
-
3. Europe
- 3.1. United Kingdom
- 3.2. Germany
- 3.3. France
- 3.4. Italy
- 3.5. Spain
- 3.6. Russia
- 3.7. Benelux
- 3.8. Nordics
- 3.9. Rest of Europe
-
4. Middle East & Africa
- 4.1. Turkey
- 4.2. Israel
- 4.3. GCC
- 4.4. North Africa
- 4.5. South Africa
- 4.6. Rest of Middle East & Africa
-
5. Asia Pacific
- 5.1. China
- 5.2. India
- 5.3. Japan
- 5.4. South Korea
- 5.5. ASEAN
- 5.6. Oceania
- 5.7. Rest of Asia Pacific
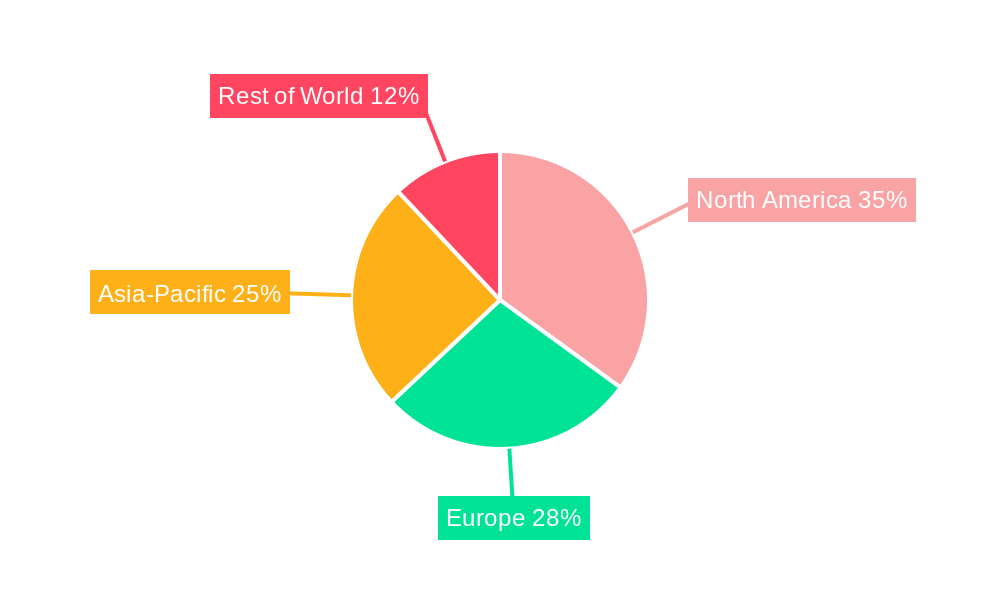
Edutainment Industry Regional Market Share
Geographic Coverage of Edutainment Industry
Edutainment Industry REPORT HIGHLIGHTS
| Aspects | Details |
|---|---|
| Study Period | 2020-2034 |
| Base Year | 2025 |
| Estimated Year | 2026 |
| Forecast Period | 2026-2034 |
| Historical Period | 2020-2025 |
| Growth Rate | CAGR of 16.1% from 2020-2034 |
| Segmentation |
|
Table of Contents
- 1. Introduction
- 1.1. Research Scope
- 1.2. Market Segmentation
- 1.3. Research Objective
- 1.4. Definitions and Assumptions
- 2. Executive Summary
- 2.1. Market Snapshot
- 3. Market Dynamics
- 3.1. Market Drivers
- 3.2. Market Restrains
- 3.3. Market Trends
- 3.4. Market Opportunities
- 4. Market Factor Analysis
- 4.1. Porters Five Forces
- 4.1.1. Bargaining Power of Suppliers
- 4.1.2. Bargaining Power of Buyers
- 4.1.3. Threat of New Entrants
- 4.1.4. Threat of Substitutes
- 4.1.5. Competitive Rivalry
- 4.2. PESTEL analysis
- 4.3. BCG Analysis
- 4.3.1. Stars (High Growth, High Market Share)
- 4.3.2. Cash Cows (Low Growth, High Market Share)
- 4.3.3. Question Mark (High Growth, Low Market Share)
- 4.3.4. Dogs (Low Growth, Low Market Share)
- 4.4. Ansoff Matrix Analysis
- 4.5. Supply Chain Analysis
- 4.6. Regulatory Landscape
- 4.7. Current Market Potential and Opportunity Assessment (TAM–SAM–SOM Framework)
- 4.8. RAX Analyst Note
- 4.1. Porters Five Forces
- 5. Market Analysis, Insights and Forecast 2021-2033
- 5.1. Market Analysis, Insights and Forecast - by product type
- 5.1.1. Interactive
- 5.1.2. Non interactive
- 5.1.3. Hybrid
- 5.1.4. Explorative
- 5.2. Market Analysis, Insights and Forecast - by end use age group
- 5.2.1. Children
- 5.2.2. Teenagers
- 5.2.3. Young Adult
- 5.3. Market Analysis, Insights and Forecast - by region/ country
- 5.3.1. United States of America
- 5.3.2. Europe
- 5.3.3. China
- 5.3.4. Japan
- 5.3.5. South East Asia
- 5.3.6. India
- 5.3.7. Central and South America
- 5.4. Market Analysis, Insights and Forecast - by Region
- 5.4.1. North America
- 5.4.2. South America
- 5.4.3. Europe
- 5.4.4. Middle East & Africa
- 5.4.5. Asia Pacific
- 5.1. Market Analysis, Insights and Forecast - by product type
- 6. Global Edutainment Industry Analysis, Insights and Forecast, 2021-2033
- 6.1. Market Analysis, Insights and Forecast - by product type
- 6.1.1. Interactive
- 6.1.2. Non interactive
- 6.1.3. Hybrid
- 6.1.4. Explorative
- 6.2. Market Analysis, Insights and Forecast - by end use age group
- 6.2.1. Children
- 6.2.2. Teenagers
- 6.2.3. Young Adult
- 6.3. Market Analysis, Insights and Forecast - by region/ country
- 6.3.1. United States of America
- 6.3.2. Europe
- 6.3.3. China
- 6.3.4. Japan
- 6.3.5. South East Asia
- 6.3.6. India
- 6.3.7. Central and South America
- 6.1. Market Analysis, Insights and Forecast - by product type
- 7. North America Edutainment Industry Analysis, Insights and Forecast, 2020-2032
- 7.1. Market Analysis, Insights and Forecast - by product type
- 7.1.1. Interactive
- 7.1.2. Non interactive
- 7.1.3. Hybrid
- 7.1.4. Explorative
- 7.2. Market Analysis, Insights and Forecast - by end use age group
- 7.2.1. Children
- 7.2.2. Teenagers
- 7.2.3. Young Adult
- 7.3. Market Analysis, Insights and Forecast - by region/ country
- 7.3.1. United States of America
- 7.3.2. Europe
- 7.3.3. China
- 7.3.4. Japan
- 7.3.5. South East Asia
- 7.3.6. India
- 7.3.7. Central and South America
- 7.1. Market Analysis, Insights and Forecast - by product type
- 8. South America Edutainment Industry Analysis, Insights and Forecast, 2020-2032
- 8.1. Market Analysis, Insights and Forecast - by product type
- 8.1.1. Interactive
- 8.1.2. Non interactive
- 8.1.3. Hybrid
- 8.1.4. Explorative
- 8.2. Market Analysis, Insights and Forecast - by end use age group
- 8.2.1. Children
- 8.2.2. Teenagers
- 8.2.3. Young Adult
- 8.3. Market Analysis, Insights and Forecast - by region/ country
- 8.3.1. United States of America
- 8.3.2. Europe
- 8.3.3. China
- 8.3.4. Japan
- 8.3.5. South East Asia
- 8.3.6. India
- 8.3.7. Central and South America
- 8.1. Market Analysis, Insights and Forecast - by product type
- 9. Europe Edutainment Industry Analysis, Insights and Forecast, 2020-2032
- 9.1. Market Analysis, Insights and Forecast - by product type
- 9.1.1. Interactive
- 9.1.2. Non interactive
- 9.1.3. Hybrid
- 9.1.4. Explorative
- 9.2. Market Analysis, Insights and Forecast - by end use age group
- 9.2.1. Children
- 9.2.2. Teenagers
- 9.2.3. Young Adult
- 9.3. Market Analysis, Insights and Forecast - by region/ country
- 9.3.1. United States of America
- 9.3.2. Europe
- 9.3.3. China
- 9.3.4. Japan
- 9.3.5. South East Asia
- 9.3.6. India
- 9.3.7. Central and South America
- 9.1. Market Analysis, Insights and Forecast - by product type
- 10. Middle East & Africa Edutainment Industry Analysis, Insights and Forecast, 2020-2032
- 10.1. Market Analysis, Insights and Forecast - by product type
- 10.1.1. Interactive
- 10.1.2. Non interactive
- 10.1.3. Hybrid
- 10.1.4. Explorative
- 10.2. Market Analysis, Insights and Forecast - by end use age group
- 10.2.1. Children
- 10.2.2. Teenagers
- 10.2.3. Young Adult
- 10.3. Market Analysis, Insights and Forecast - by region/ country
- 10.3.1. United States of America
- 10.3.2. Europe
- 10.3.3. China
- 10.3.4. Japan
- 10.3.5. South East Asia
- 10.3.6. India
- 10.3.7. Central and South America
- 10.1. Market Analysis, Insights and Forecast - by product type
- 11. Asia Pacific Edutainment Industry Analysis, Insights and Forecast, 2020-2032
- 11.1. Market Analysis, Insights and Forecast - by product type
- 11.1.1. Interactive
- 11.1.2. Non interactive
- 11.1.3. Hybrid
- 11.1.4. Explorative
- 11.2. Market Analysis, Insights and Forecast - by end use age group
- 11.2.1. Children
- 11.2.2. Teenagers
- 11.2.3. Young Adult
- 11.3. Market Analysis, Insights and Forecast - by region/ country
- 11.3.1. United States of America
- 11.3.2. Europe
- 11.3.3. China
- 11.3.4. Japan
- 11.3.5. South East Asia
- 11.3.6. India
- 11.3.7. Central and South America
- 11.1. Market Analysis, Insights and Forecast - by product type
- 12. Competitive Analysis
- 12.1. Company Profiles
- 12.1.1 Pororo Parks
- 12.1.1.1. Company Overview
- 12.1.1.2. Products
- 12.1.1.3. Company Financials
- 12.1.1.4. SWOT Analysis
- 12.1.2 Kidzania
- 12.1.2.1. Company Overview
- 12.1.2.2. Products
- 12.1.2.3. Company Financials
- 12.1.2.4. SWOT Analysis
- 12.1.3 Plabo
- 12.1.3.1. Company Overview
- 12.1.3.2. Products
- 12.1.3.3. Company Financials
- 12.1.3.4. SWOT Analysis
- 12.1.4 Legoland Discovery Center
- 12.1.4.1. Company Overview
- 12.1.4.2. Products
- 12.1.4.3. Company Financials
- 12.1.4.4. SWOT Analysis
- 12.1.5 CurioCity
- 12.1.5.1. Company Overview
- 12.1.5.2. Products
- 12.1.5.3. Company Financials
- 12.1.5.4. SWOT Analysis
- 12.1.6 Kindercity
- 12.1.6.1. Company Overview
- 12.1.6.2. Products
- 12.1.6.3. Company Financials
- 12.1.6.4. SWOT Analysis
- 12.1.7 Mattel Play! Town
- 12.1.7.1. Company Overview
- 12.1.7.2. Products
- 12.1.7.3. Company Financials
- 12.1.7.4. SWOT Analysis
- 12.1.8 Totter's Otterville
- 12.1.8.1. Company Overview
- 12.1.8.2. Products
- 12.1.8.3. Company Financials
- 12.1.8.4. SWOT Analysis
- 12.1.9 Kidz Holding S A L
- 12.1.9.1. Company Overview
- 12.1.9.2. Products
- 12.1.9.3. Company Financials
- 12.1.9.4. SWOT Analysis
- 12.1.10 Little Explorers
- 12.1.10.1. Company Overview
- 12.1.10.2. Products
- 12.1.10.3. Company Financials
- 12.1.10.4. SWOT Analysis
- 12.1.11 ConveGenius
- 12.1.11.1. Company Overview
- 12.1.11.2. Products
- 12.1.11.3. Company Financials
- 12.1.11.4. SWOT Analysis
- 12.1.12 Grey Sim
- 12.1.12.1. Company Overview
- 12.1.12.2. Products
- 12.1.12.3. Company Financials
- 12.1.12.4. SWOT Analysis
- 12.1.13 Edsys
- 12.1.13.1. Company Overview
- 12.1.13.2. Products
- 12.1.13.3. Company Financials
- 12.1.13.4. SWOT Analysis
- 12.1.14 IdeaCrate Edutainment Company
- 12.1.14.1. Company Overview
- 12.1.14.2. Products
- 12.1.14.3. Company Financials
- 12.1.14.4. SWOT Analysis
- 12.1.15 DreamUs Edutainment*List Not Exhaustive
- 12.1.15.1. Company Overview
- 12.1.15.2. Products
- 12.1.15.3. Company Financials
- 12.1.15.4. SWOT Analysis
- 12.1.1 Pororo Parks
- 12.2. Market Entropy
- 12.2.1 Company's Key Areas Served
- 12.2.2 Recent Developments
- 12.3. Company Market Share Analysis 2025
- 12.3.1 Top 5 Companies Market Share Analysis
- 12.3.2 Top 3 Companies Market Share Analysis
- 12.4. List of Potential Customers
- 13. Research Methodology
List of Figures
- Figure 1: Global Edutainment Industry Revenue Breakdown (billion, %) by Region 2025 & 2033
- Figure 2: North America Edutainment Industry Revenue (billion), by product type 2025 & 2033
- Figure 3: North America Edutainment Industry Revenue Share (%), by product type 2025 & 2033
- Figure 4: North America Edutainment Industry Revenue (billion), by end use age group 2025 & 2033
- Figure 5: North America Edutainment Industry Revenue Share (%), by end use age group 2025 & 2033
- Figure 6: North America Edutainment Industry Revenue (billion), by region/ country 2025 & 2033
- Figure 7: North America Edutainment Industry Revenue Share (%), by region/ country 2025 & 2033
- Figure 8: North America Edutainment Industry Revenue (billion), by Country 2025 & 2033
- Figure 9: North America Edutainment Industry Revenue Share (%), by Country 2025 & 2033
- Figure 10: South America Edutainment Industry Revenue (billion), by product type 2025 & 2033
- Figure 11: South America Edutainment Industry Revenue Share (%), by product type 2025 & 2033
- Figure 12: South America Edutainment Industry Revenue (billion), by end use age group 2025 & 2033
- Figure 13: South America Edutainment Industry Revenue Share (%), by end use age group 2025 & 2033
- Figure 14: South America Edutainment Industry Revenue (billion), by region/ country 2025 & 2033
- Figure 15: South America Edutainment Industry Revenue Share (%), by region/ country 2025 & 2033
- Figure 16: South America Edutainment Industry Revenue (billion), by Country 2025 & 2033
- Figure 17: South America Edutainment Industry Revenue Share (%), by Country 2025 & 2033
- Figure 18: Europe Edutainment Industry Revenue (billion), by product type 2025 & 2033
- Figure 19: Europe Edutainment Industry Revenue Share (%), by product type 2025 & 2033
- Figure 20: Europe Edutainment Industry Revenue (billion), by end use age group 2025 & 2033
- Figure 21: Europe Edutainment Industry Revenue Share (%), by end use age group 2025 & 2033
- Figure 22: Europe Edutainment Industry Revenue (billion), by region/ country 2025 & 2033
- Figure 23: Europe Edutainment Industry Revenue Share (%), by region/ country 2025 & 2033
- Figure 24: Europe Edutainment Industry Revenue (billion), by Country 2025 & 2033
- Figure 25: Europe Edutainment Industry Revenue Share (%), by Country 2025 & 2033
- Figure 26: Middle East & Africa Edutainment Industry Revenue (billion), by product type 2025 & 2033
- Figure 27: Middle East & Africa Edutainment Industry Revenue Share (%), by product type 2025 & 2033
- Figure 28: Middle East & Africa Edutainment Industry Revenue (billion), by end use age group 2025 & 2033
- Figure 29: Middle East & Africa Edutainment Industry Revenue Share (%), by end use age group 2025 & 2033
- Figure 30: Middle East & Africa Edutainment Industry Revenue (billion), by region/ country 2025 & 2033
- Figure 31: Middle East & Africa Edutainment Industry Revenue Share (%), by region/ country 2025 & 2033
- Figure 32: Middle East & Africa Edutainment Industry Revenue (billion), by Country 2025 & 2033
- Figure 33: Middle East & Africa Edutainment Industry Revenue Share (%), by Country 2025 & 2033
- Figure 34: Asia Pacific Edutainment Industry Revenue (billion), by product type 2025 & 2033
- Figure 35: Asia Pacific Edutainment Industry Revenue Share (%), by product type 2025 & 2033
- Figure 36: Asia Pacific Edutainment Industry Revenue (billion), by end use age group 2025 & 2033
- Figure 37: Asia Pacific Edutainment Industry Revenue Share (%), by end use age group 2025 & 2033
- Figure 38: Asia Pacific Edutainment Industry Revenue (billion), by region/ country 2025 & 2033
- Figure 39: Asia Pacific Edutainment Industry Revenue Share (%), by region/ country 2025 & 2033
- Figure 40: Asia Pacific Edutainment Industry Revenue (billion), by Country 2025 & 2033
- Figure 41: Asia Pacific Edutainment Industry Revenue Share (%), by Country 2025 & 2033
List of Tables
- Table 1: Global Edutainment Industry Revenue billion Forecast, by product type 2020 & 2033
- Table 2: Global Edutainment Industry Revenue billion Forecast, by end use age group 2020 & 2033
- Table 3: Global Edutainment Industry Revenue billion Forecast, by region/ country 2020 & 2033
- Table 4: Global Edutainment Industry Revenue billion Forecast, by Region 2020 & 2033
- Table 5: Global Edutainment Industry Revenue billion Forecast, by product type 2020 & 2033
- Table 6: Global Edutainment Industry Revenue billion Forecast, by end use age group 2020 & 2033
- Table 7: Global Edutainment Industry Revenue billion Forecast, by region/ country 2020 & 2033
- Table 8: Global Edutainment Industry Revenue billion Forecast, by Country 2020 & 2033
- Table 9: United States Edutainment Industry Revenue (billion) Forecast, by Application 2020 & 2033
- Table 10: Canada Edutainment Industry Revenue (billion) Forecast, by Application 2020 & 2033
- Table 11: Mexico Edutainment Industry Revenue (billion) Forecast, by Application 2020 & 2033
- Table 12: Global Edutainment Industry Revenue billion Forecast, by product type 2020 & 2033
- Table 13: Global Edutainment Industry Revenue billion Forecast, by end use age group 2020 & 2033
- Table 14: Global Edutainment Industry Revenue billion Forecast, by region/ country 2020 & 2033
- Table 15: Global Edutainment Industry Revenue billion Forecast, by Country 2020 & 2033
- Table 16: Brazil Edutainment Industry Revenue (billion) Forecast, by Application 2020 & 2033
- Table 17: Argentina Edutainment Industry Revenue (billion) Forecast, by Application 2020 & 2033
- Table 18: Rest of South America Edutainment Industry Revenue (billion) Forecast, by Application 2020 & 2033
- Table 19: Global Edutainment Industry Revenue billion Forecast, by product type 2020 & 2033
- Table 20: Global Edutainment Industry Revenue billion Forecast, by end use age group 2020 & 2033
- Table 21: Global Edutainment Industry Revenue billion Forecast, by region/ country 2020 & 2033
- Table 22: Global Edutainment Industry Revenue billion Forecast, by Country 2020 & 2033
- Table 23: United Kingdom Edutainment Industry Revenue (billion) Forecast, by Application 2020 & 2033
- Table 24: Germany Edutainment Industry Revenue (billion) Forecast, by Application 2020 & 2033
- Table 25: France Edutainment Industry Revenue (billion) Forecast, by Application 2020 & 2033
- Table 26: Italy Edutainment Industry Revenue (billion) Forecast, by Application 2020 & 2033
- Table 27: Spain Edutainment Industry Revenue (billion) Forecast, by Application 2020 & 2033
- Table 28: Russia Edutainment Industry Revenue (billion) Forecast, by Application 2020 & 2033
- Table 29: Benelux Edutainment Industry Revenue (billion) Forecast, by Application 2020 & 2033
- Table 30: Nordics Edutainment Industry Revenue (billion) Forecast, by Application 2020 & 2033
- Table 31: Rest of Europe Edutainment Industry Revenue (billion) Forecast, by Application 2020 & 2033
- Table 32: Global Edutainment Industry Revenue billion Forecast, by product type 2020 & 2033
- Table 33: Global Edutainment Industry Revenue billion Forecast, by end use age group 2020 & 2033
- Table 34: Global Edutainment Industry Revenue billion Forecast, by region/ country 2020 & 2033
- Table 35: Global Edutainment Industry Revenue billion Forecast, by Country 2020 & 2033
- Table 36: Turkey Edutainment Industry Revenue (billion) Forecast, by Application 2020 & 2033
- Table 37: Israel Edutainment Industry Revenue (billion) Forecast, by Application 2020 & 2033
- Table 38: GCC Edutainment Industry Revenue (billion) Forecast, by Application 2020 & 2033
- Table 39: North Africa Edutainment Industry Revenue (billion) Forecast, by Application 2020 & 2033
- Table 40: South Africa Edutainment Industry Revenue (billion) Forecast, by Application 2020 & 2033
- Table 41: Rest of Middle East & Africa Edutainment Industry Revenue (billion) Forecast, by Application 2020 & 2033
- Table 42: Global Edutainment Industry Revenue billion Forecast, by product type 2020 & 2033
- Table 43: Global Edutainment Industry Revenue billion Forecast, by end use age group 2020 & 2033
- Table 44: Global Edutainment Industry Revenue billion Forecast, by region/ country 2020 & 2033
- Table 45: Global Edutainment Industry Revenue billion Forecast, by Country 2020 & 2033
- Table 46: China Edutainment Industry Revenue (billion) Forecast, by Application 2020 & 2033
- Table 47: India Edutainment Industry Revenue (billion) Forecast, by Application 2020 & 2033
- Table 48: Japan Edutainment Industry Revenue (billion) Forecast, by Application 2020 & 2033
- Table 49: South Korea Edutainment Industry Revenue (billion) Forecast, by Application 2020 & 2033
- Table 50: ASEAN Edutainment Industry Revenue (billion) Forecast, by Application 2020 & 2033
- Table 51: Oceania Edutainment Industry Revenue (billion) Forecast, by Application 2020 & 2033
- Table 52: Rest of Asia Pacific Edutainment Industry Revenue (billion) Forecast, by Application 2020 & 2033
Frequently Asked Questions
1. What is the projected Compound Annual Growth Rate (CAGR) of the Edutainment Industry?
The projected CAGR is approximately 16.1%.
2. Which companies are prominent players in the Edutainment Industry?
Key companies in the market include Pororo Parks, Kidzania, Plabo, Legoland Discovery Center, CurioCity, Kindercity, Mattel Play! Town, Totter's Otterville, Kidz Holding S A L, Little Explorers, ConveGenius, Grey Sim, Edsys, IdeaCrate Edutainment Company, DreamUs Edutainment*List Not Exhaustive.
3. What are the main segments of the Edutainment Industry?
The market segments include product type, end use age group, region/ country.
4. Can you provide details about the market size?
The market size is estimated to be USD 3 billion as of 2022.
5. What are some drivers contributing to market growth?
N/A
6. What are the notable trends driving market growth?
Technological Advancement Is Driving Edutech To Newer Heights.
7. Are there any restraints impacting market growth?
N/A
8. Can you provide examples of recent developments in the market?
N/A
9. What pricing options are available for accessing the report?
Pricing options include single-user, multi-user, and enterprise licenses priced at USD 4750, USD 4950, and USD 6800 respectively.
10. Is the market size provided in terms of value or volume?
The market size is provided in terms of value, measured in billion.
11. Are there any specific market keywords associated with the report?
Yes, the market keyword associated with the report is "Edutainment Industry," which aids in identifying and referencing the specific market segment covered.
12. How do I determine which pricing option suits my needs best?
The pricing options vary based on user requirements and access needs. Individual users may opt for single-user licenses, while businesses requiring broader access may choose multi-user or enterprise licenses for cost-effective access to the report.
13. Are there any additional resources or data provided in the Edutainment Industry report?
While the report offers comprehensive insights, it's advisable to review the specific contents or supplementary materials provided to ascertain if additional resources or data are available.
14. How can I stay updated on further developments or reports in the Edutainment Industry?
To stay informed about further developments, trends, and reports in the Edutainment Industry, consider subscribing to industry newsletters, following relevant companies and organizations, or regularly checking reputable industry news sources and publications.
Methodology
Step 1 - Identification of Relevant Samples Size from Population Database


Step 2 - Approaches for Defining Global Market Size (Value, Volume* & Price*)

Note*: In applicable scenarios
Step 3 - Data Sources
Primary Research
- Web Analytics
- Survey Reports
- Research Institute
- Latest Research Reports
- Opinion Leaders
Secondary Research
- Annual Reports
- White Paper
- Latest Press Release
- Industry Association
- Paid Database
- Investor Presentations

Step 4 - Data Triangulation
Involves using different sources of information in order to increase the validity of a study
These sources are likely to be stakeholders in a program - participants, other researchers, program staff, other community members, and so on.
Then we put all data in single framework & apply various statistical tools to find out the dynamic on the market.
During the analysis stage, feedback from the stakeholder groups would be compared to determine areas of agreement as well as areas of divergence

