

Key Insights
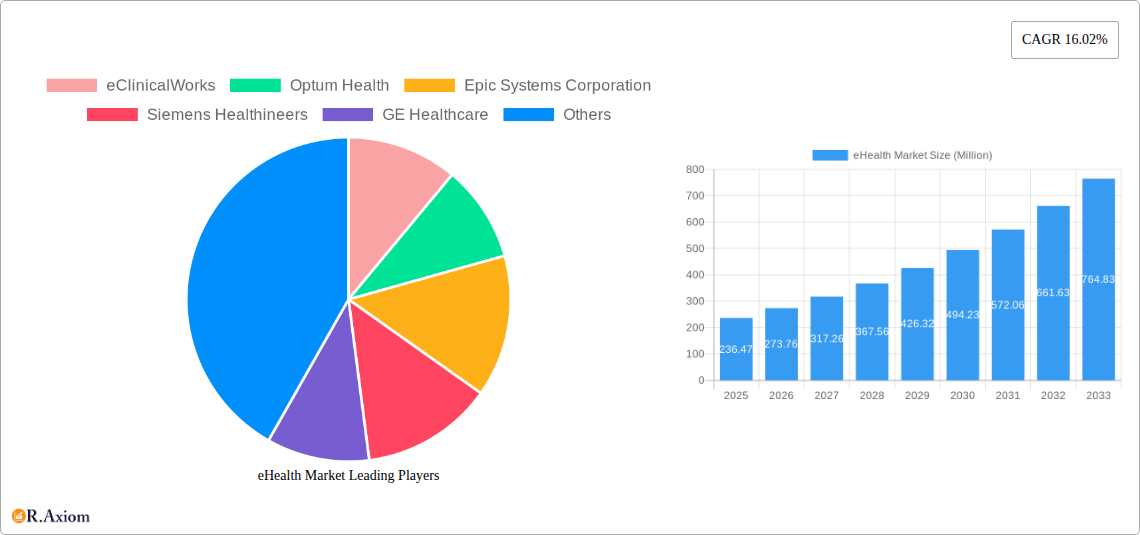
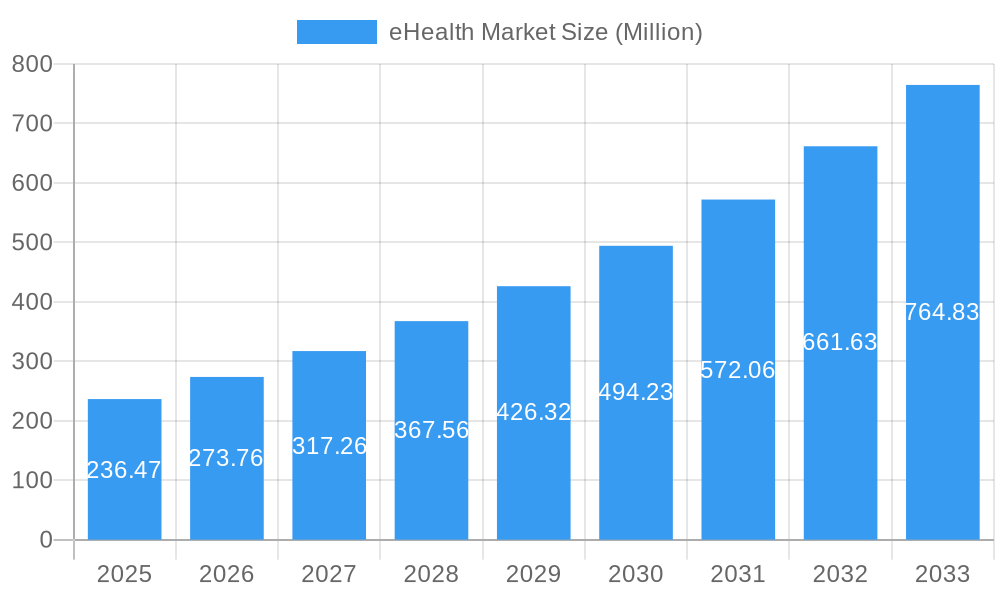
The global eHealth market, valued at $236.47 million in 2025, is experiencing robust growth, projected to expand significantly by 2033. A compound annual growth rate (CAGR) of 16.02% indicates a substantial increase in market size driven by several key factors. The rising adoption of electronic health records (EHRs) and e-prescribing systems streamlines healthcare processes, improving efficiency and reducing administrative burdens. Furthermore, the increasing prevalence of chronic diseases necessitates remote patient monitoring and telehealth solutions, fueling the demand for telemedicine and related services. Technological advancements, such as AI-powered clinical decision support systems, enhance diagnostic accuracy and treatment efficacy, contributing to market expansion. Government initiatives promoting digital health infrastructure and increasing healthcare expenditure further bolster market growth. However, challenges such as data security concerns, interoperability issues between different systems, and the digital divide among certain populations might act as restraints. The market is segmented by end-user (hospitals, insurance companies, others), component (EHRs, e-prescribing, clinical decision support systems, telemedicine, others), and type of service (monitoring, diagnosis, therapeutic, others). North America currently holds a dominant market share due to robust technological infrastructure and high healthcare spending, but the Asia-Pacific region is poised for rapid expansion driven by increasing internet penetration and rising healthcare investments.
eHealth Market Market Size (In Million)
The diverse range of eHealth solutions caters to various healthcare needs, driving market segmentation. Hospitals are the largest adopters of EHRs and clinical decision support systems, while insurance companies leverage eHealth technologies for claims processing and patient management. The increasing adoption of cloud-based solutions enhances scalability and accessibility, contributing to market growth. Major players like eClinicalWorks, Epic Systems Corporation, and others are actively innovating and expanding their product portfolios to cater to the evolving market demands. Competition is intense, with companies focusing on strategic partnerships, mergers, and acquisitions to expand their market reach and product offerings. The continued development of sophisticated analytics and AI-driven tools within eHealth solutions will further accelerate market growth in the coming years, making it a lucrative sector for investment and innovation.
eHealth Market Company Market Share
eHealth Market: A Comprehensive Report (2019-2033)
This detailed report provides a comprehensive analysis of the eHealth market, covering its evolution, current state, and future trajectory from 2019 to 2033. The study encompasses market sizing, segmentation, competitive landscape, and key growth drivers, offering actionable insights for stakeholders across the industry. With a base year of 2025 and a forecast period spanning 2025-2033, this report is an invaluable resource for strategic decision-making. Key companies analyzed include eClinicalWorks, Optum Health, Epic Systems Corporation, Siemens Healthineers, GE Healthcare, Koninklijke Philips NV, CompuMed Inc, Veradigm LLC, athenahealth Inc, Boston Scientific Corporation, and Oracle Cerner.
eHealth Market Concentration & Innovation
This section analyzes the level of market concentration, identifying key players and their market share. We examine the innovation drivers shaping the market, including technological advancements, regulatory changes, and evolving end-user needs. The influence of mergers and acquisitions (M&A) activity on market dynamics is also assessed, including the value of significant deals. The report further explores the impact of substitute products and services, along with emerging trends and regulatory frameworks affecting competition.
- Market Concentration: The eHealth market exhibits a moderately concentrated structure, with a few major players holding significant market share (xx%). However, the emergence of smaller, specialized firms is also noticeable.
- Innovation Drivers: Artificial intelligence (AI), machine learning (ML), big data analytics, and the Internet of Medical Things (IoMT) are driving innovation, leading to improved diagnostic tools, personalized medicine, and remote patient monitoring capabilities.
- Regulatory Framework: Stringent data privacy regulations (e.g., HIPAA, GDPR) are shaping market practices, impacting data security and interoperability.
- M&A Activity: The number of M&A deals in the eHealth sector has increased in recent years, driven by the desire to expand product portfolios, enhance technological capabilities, and access new markets. Total M&A deal value during the historical period reached approximately xx Million.
- Product Substitutes: The market faces potential competition from traditional healthcare approaches, but technological advancements are gradually increasing the adoption of eHealth solutions.
- End-User Trends: The growing preference for convenient and cost-effective healthcare solutions is fueling demand for eHealth services.
eHealth Market Industry Trends & Insights
This section delves into the key trends shaping the eHealth market, examining market growth drivers, technological disruptions, consumer preferences, and competitive dynamics. It provides a comprehensive overview of the market’s evolution, highlighting the factors that have contributed to its growth and the challenges it faces. The analysis incorporates quantitative data, including the Compound Annual Growth Rate (CAGR) and market penetration rates.
The eHealth market has experienced significant growth, driven by factors such as the increasing prevalence of chronic diseases, rising healthcare costs, and the growing adoption of digital technologies. The CAGR during the historical period (2019-2024) is estimated at xx%, with a projected CAGR of xx% during the forecast period (2025-2033). Market penetration in key regions is also analyzed, highlighting the variations in adoption rates across different geographical areas. Technological disruptions, such as the rise of AI and ML, are transforming the delivery of healthcare services. Consumer preferences are shifting towards personalized, convenient, and cost-effective solutions. Competitive dynamics are characterized by both fierce competition among established players and the emergence of new entrants.
Dominant Markets & Segments in eHealth Market
This section identifies the leading regions, countries, and market segments within the eHealth market. We analyze market dominance based on various factors, including economic policies, infrastructure development, technological advancement, and regulatory frameworks.
By End User:
- Hospitals: Hospitals represent a major segment, driven by the need for improved efficiency, patient care, and operational effectiveness. Key drivers include government initiatives to promote digital health and increasing adoption of electronic health records (EHRs).
- Insurance Companies: Insurance companies are increasingly adopting eHealth solutions to manage costs, improve care coordination, and enhance patient engagement.
- Other End Users: This segment includes clinics, physician offices, and other healthcare providers. Growth in this segment is fueled by factors such as the increasing affordability of eHealth solutions and the growing awareness of their benefits.
By Component:
- Electronic Health Records (EHRs): This remains the largest segment, due to the growing need for efficient record-keeping and data management. Government mandates for EHR adoption further fuel market growth.
- Telemedicine: This segment is experiencing rapid growth due to its convenience and cost-effectiveness, especially during and post pandemic.
- Clinical Decision Support Systems (CDSS): This segment is growing as healthcare providers increasingly rely on data-driven decision-making tools to improve patient outcomes.
- e-Prescribing: e-Prescribing systems are gaining popularity as they improve prescription accuracy, reduce errors, and streamline the prescribing process.
By Type of Service:
- Monitoring Service: The remote patient monitoring segment is experiencing significant growth, driven by the increasing prevalence of chronic diseases and the need for convenient and cost-effective monitoring solutions.
- Diagnosis Service: This segment is being driven by the development of advanced diagnostic tools and technologies, including AI and ML-powered diagnostic systems.
- Therapeutic and Other Services: This segment includes virtual therapy, remote consultations, and other eHealth services, growing as the adoption of digital health technologies increases. The North American region is currently the leading market, followed by Europe and Asia-Pacific.
eHealth Market Product Developments
Recent product innovations in eHealth include AI-powered diagnostic tools, improved telehealth platforms, and more user-friendly EHR systems. These developments enhance accuracy, efficiency, and patient engagement, boosting market competitiveness and market fit by addressing key unmet needs in healthcare delivery. The focus is on integrating various technologies to create comprehensive solutions that improve patient outcomes and streamline healthcare processes.
Report Scope & Segmentation Analysis
This report covers the global eHealth market, segmented by end-user (hospitals, insurance companies, other end users), component (electronic health records, e-prescribing, clinical decision support systems, telemedicine, other components), and type of service (monitoring, diagnosis, therapeutic and other services). Each segment is analyzed in terms of growth projections, market size (in Million), and competitive dynamics. Growth projections vary across segments, with telemedicine and AI-powered diagnostics exhibiting particularly high growth potential. Competitive dynamics are shaped by technological advancements, regulatory changes, and the entry of new players.
Key Drivers of eHealth Market Growth
Several factors drive the growth of the eHealth market, including:
- Technological advancements: AI, ML, and big data analytics are revolutionizing healthcare, improving diagnostics, treatment, and patient care.
- Rising healthcare costs: eHealth solutions offer cost-effective alternatives to traditional healthcare methods.
- Government initiatives: Governments worldwide are promoting the adoption of eHealth to improve access to healthcare and enhance efficiency.
- Increased prevalence of chronic diseases: The growing burden of chronic diseases necessitates effective remote patient monitoring and management solutions.
- Growing demand for personalized medicine: eHealth technologies enable the development and delivery of personalized healthcare solutions tailored to individual needs.
Challenges in the eHealth Market Sector
The eHealth market faces several challenges:
- Data security and privacy concerns: The sensitive nature of healthcare data necessitates robust security measures to prevent data breaches.
- Interoperability issues: Lack of interoperability between different eHealth systems can hinder data exchange and coordination of care.
- Regulatory hurdles: Complex and evolving regulatory frameworks can pose challenges for market entry and expansion.
- Lack of digital literacy: Limited digital literacy among healthcare professionals and patients can hinder the adoption of eHealth solutions.
- High initial investment costs: Implementing eHealth solutions can require substantial upfront investments, potentially limiting adoption among smaller healthcare providers.
Emerging Opportunities in eHealth Market
The eHealth market presents significant opportunities:
- Expansion into emerging markets: The adoption of eHealth solutions is growing rapidly in developing countries, creating new market opportunities.
- Development of new technologies: Innovations in AI, ML, and other technologies are creating opportunities for new and improved eHealth solutions.
- Growing demand for remote patient monitoring: The increasing prevalence of chronic diseases is fueling the demand for remote patient monitoring solutions.
- Integration of wearable technology: Wearable devices are generating large amounts of data which can be used to improve diagnostics and treatment outcomes.
- Focus on preventative care: eHealth technologies can be used to promote preventative care and reduce the risk of chronic diseases.
Leading Players in the eHealth Market Market
Key Developments in eHealth Market Industry
- January 2023: India's National Health Authority launched an incentive scheme to promote the creation of digital health records, significantly boosting the adoption of eHealth solutions within the country.
- January 2023: Health Services Management (HSM) partnered with Sound Physicians Telemedicine Services, expanding access to telemedicine services in Texas, Indiana, and Florida, highlighting the growing adoption of telehealth solutions.
Strategic Outlook for eHealth Market Market
The eHealth market is poised for continued growth, driven by technological advancements, increasing demand for convenient and cost-effective healthcare solutions, and supportive government policies. The integration of AI, ML, and big data analytics will further enhance the capabilities of eHealth solutions, leading to improved patient outcomes and operational efficiencies. Expansion into new markets and the development of innovative applications will create new opportunities for growth. The market is expected to witness significant consolidation through M&A activity, further shaping the competitive landscape.
eHealth Market Segmentation
-
1. Component
- 1.1. Electronic Health Records
- 1.2. e-Prescribing
- 1.3. Clinical Decision Support Systems
- 1.4. Telemedicine
- 1.5. Other Components
-
2. Type of Service
- 2.1. Monitoring Service
- 2.2. Diagnosis Service
- 2.3. Therapeutic and Other Services
-
3. End User
- 3.1. Hospitals
- 3.2. Insurance Companies
- 3.3. Other End Users
eHealth Market Segmentation By Geography
-
1. North America
- 1.1. United States
- 1.2. Canada
- 1.3. Mexico
-
2. Europe
- 2.1. United Kingdom
- 2.2. Germany
- 2.3. France
- 2.4. Italy
- 2.5. Spain
- 2.6. Rest of Europe
-
3. Asia Pacific
- 3.1. China
- 3.2. Japan
- 3.3. India
- 3.4. Australia
- 3.5. South Korea
- 3.6. Rest of Asia Pacific
-
4. Middle East and Africa
- 4.1. GCC
- 4.2. South Africa
- 4.3. Rest of Middle East and Africa
-
5. South America
- 5.1. Brazil
- 5.2. Argentina
- 5.3. Rest of South America
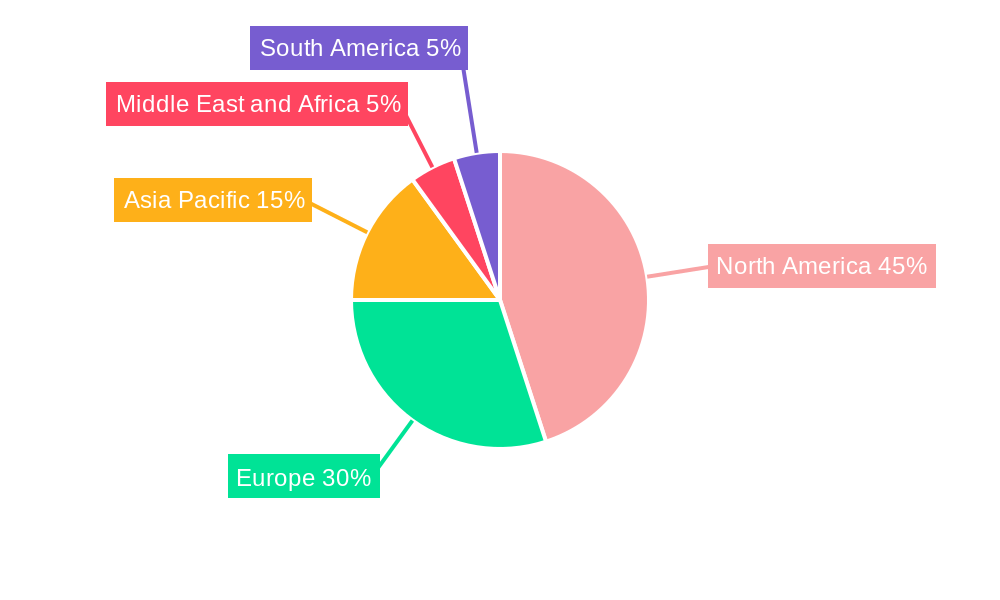
eHealth Market Regional Market Share
Geographic Coverage of eHealth Market
eHealth Market REPORT HIGHLIGHTS
| Aspects | Details |
|---|---|
| Study Period | 2020-2034 |
| Base Year | 2025 |
| Estimated Year | 2026 |
| Forecast Period | 2026-2034 |
| Historical Period | 2020-2025 |
| Growth Rate | CAGR of 16.02% from 2020-2034 |
| Segmentation |
|
Table of Contents
- 1. Introduction
- 1.1. Research Scope
- 1.2. Market Segmentation
- 1.3. Research Objective
- 1.4. Definitions and Assumptions
- 2. Executive Summary
- 2.1. Market Snapshot
- 3. Market Dynamics
- 3.1. Market Drivers
- 3.2. Market Restrains
- 3.3. Market Trends
- 3.4. Market Opportunities
- 4. Market Factor Analysis
- 4.1. Porters Five Forces
- 4.1.1. Bargaining Power of Suppliers
- 4.1.2. Bargaining Power of Buyers
- 4.1.3. Threat of New Entrants
- 4.1.4. Threat of Substitutes
- 4.1.5. Competitive Rivalry
- 4.2. PESTEL analysis
- 4.3. BCG Analysis
- 4.3.1. Stars (High Growth, High Market Share)
- 4.3.2. Cash Cows (Low Growth, High Market Share)
- 4.3.3. Question Mark (High Growth, Low Market Share)
- 4.3.4. Dogs (Low Growth, Low Market Share)
- 4.4. Ansoff Matrix Analysis
- 4.5. Supply Chain Analysis
- 4.6. Regulatory Landscape
- 4.7. Current Market Potential and Opportunity Assessment (TAM–SAM–SOM Framework)
- 4.8. RAX Analyst Note
- 4.1. Porters Five Forces
- 5. Market Analysis, Insights and Forecast 2021-2033
- 5.1. Market Analysis, Insights and Forecast - by Component
- 5.1.1. Electronic Health Records
- 5.1.2. e-Prescribing
- 5.1.3. Clinical Decision Support Systems
- 5.1.4. Telemedicine
- 5.1.5. Other Components
- 5.2. Market Analysis, Insights and Forecast - by Type of Service
- 5.2.1. Monitoring Service
- 5.2.2. Diagnosis Service
- 5.2.3. Therapeutic and Other Services
- 5.3. Market Analysis, Insights and Forecast - by End User
- 5.3.1. Hospitals
- 5.3.2. Insurance Companies
- 5.3.3. Other End Users
- 5.4. Market Analysis, Insights and Forecast - by Region
- 5.4.1. North America
- 5.4.2. Europe
- 5.4.3. Asia Pacific
- 5.4.4. Middle East and Africa
- 5.4.5. South America
- 5.1. Market Analysis, Insights and Forecast - by Component
- 6. Global eHealth Market Analysis, Insights and Forecast, 2021-2033
- 6.1. Market Analysis, Insights and Forecast - by Component
- 6.1.1. Electronic Health Records
- 6.1.2. e-Prescribing
- 6.1.3. Clinical Decision Support Systems
- 6.1.4. Telemedicine
- 6.1.5. Other Components
- 6.2. Market Analysis, Insights and Forecast - by Type of Service
- 6.2.1. Monitoring Service
- 6.2.2. Diagnosis Service
- 6.2.3. Therapeutic and Other Services
- 6.3. Market Analysis, Insights and Forecast - by End User
- 6.3.1. Hospitals
- 6.3.2. Insurance Companies
- 6.3.3. Other End Users
- 6.1. Market Analysis, Insights and Forecast - by Component
- 7. North America eHealth Market Analysis, Insights and Forecast, 2020-2032
- 7.1. Market Analysis, Insights and Forecast - by Component
- 7.1.1. Electronic Health Records
- 7.1.2. e-Prescribing
- 7.1.3. Clinical Decision Support Systems
- 7.1.4. Telemedicine
- 7.1.5. Other Components
- 7.2. Market Analysis, Insights and Forecast - by Type of Service
- 7.2.1. Monitoring Service
- 7.2.2. Diagnosis Service
- 7.2.3. Therapeutic and Other Services
- 7.3. Market Analysis, Insights and Forecast - by End User
- 7.3.1. Hospitals
- 7.3.2. Insurance Companies
- 7.3.3. Other End Users
- 7.1. Market Analysis, Insights and Forecast - by Component
- 8. Europe eHealth Market Analysis, Insights and Forecast, 2020-2032
- 8.1. Market Analysis, Insights and Forecast - by Component
- 8.1.1. Electronic Health Records
- 8.1.2. e-Prescribing
- 8.1.3. Clinical Decision Support Systems
- 8.1.4. Telemedicine
- 8.1.5. Other Components
- 8.2. Market Analysis, Insights and Forecast - by Type of Service
- 8.2.1. Monitoring Service
- 8.2.2. Diagnosis Service
- 8.2.3. Therapeutic and Other Services
- 8.3. Market Analysis, Insights and Forecast - by End User
- 8.3.1. Hospitals
- 8.3.2. Insurance Companies
- 8.3.3. Other End Users
- 8.1. Market Analysis, Insights and Forecast - by Component
- 9. Asia Pacific eHealth Market Analysis, Insights and Forecast, 2020-2032
- 9.1. Market Analysis, Insights and Forecast - by Component
- 9.1.1. Electronic Health Records
- 9.1.2. e-Prescribing
- 9.1.3. Clinical Decision Support Systems
- 9.1.4. Telemedicine
- 9.1.5. Other Components
- 9.2. Market Analysis, Insights and Forecast - by Type of Service
- 9.2.1. Monitoring Service
- 9.2.2. Diagnosis Service
- 9.2.3. Therapeutic and Other Services
- 9.3. Market Analysis, Insights and Forecast - by End User
- 9.3.1. Hospitals
- 9.3.2. Insurance Companies
- 9.3.3. Other End Users
- 9.1. Market Analysis, Insights and Forecast - by Component
- 10. Middle East and Africa eHealth Market Analysis, Insights and Forecast, 2020-2032
- 10.1. Market Analysis, Insights and Forecast - by Component
- 10.1.1. Electronic Health Records
- 10.1.2. e-Prescribing
- 10.1.3. Clinical Decision Support Systems
- 10.1.4. Telemedicine
- 10.1.5. Other Components
- 10.2. Market Analysis, Insights and Forecast - by Type of Service
- 10.2.1. Monitoring Service
- 10.2.2. Diagnosis Service
- 10.2.3. Therapeutic and Other Services
- 10.3. Market Analysis, Insights and Forecast - by End User
- 10.3.1. Hospitals
- 10.3.2. Insurance Companies
- 10.3.3. Other End Users
- 10.1. Market Analysis, Insights and Forecast - by Component
- 11. South America eHealth Market Analysis, Insights and Forecast, 2020-2032
- 11.1. Market Analysis, Insights and Forecast - by Component
- 11.1.1. Electronic Health Records
- 11.1.2. e-Prescribing
- 11.1.3. Clinical Decision Support Systems
- 11.1.4. Telemedicine
- 11.1.5. Other Components
- 11.2. Market Analysis, Insights and Forecast - by Type of Service
- 11.2.1. Monitoring Service
- 11.2.2. Diagnosis Service
- 11.2.3. Therapeutic and Other Services
- 11.3. Market Analysis, Insights and Forecast - by End User
- 11.3.1. Hospitals
- 11.3.2. Insurance Companies
- 11.3.3. Other End Users
- 11.1. Market Analysis, Insights and Forecast - by Component
- 12. Competitive Analysis
- 12.1. Company Profiles
- 12.1.1 eClinicalWorks
- 12.1.1.1. Company Overview
- 12.1.1.2. Products
- 12.1.1.3. Company Financials
- 12.1.1.4. SWOT Analysis
- 12.1.2 Optum Health
- 12.1.2.1. Company Overview
- 12.1.2.2. Products
- 12.1.2.3. Company Financials
- 12.1.2.4. SWOT Analysis
- 12.1.3 Epic Systems Corporation
- 12.1.3.1. Company Overview
- 12.1.3.2. Products
- 12.1.3.3. Company Financials
- 12.1.3.4. SWOT Analysis
- 12.1.4 Siemens Healthineers
- 12.1.4.1. Company Overview
- 12.1.4.2. Products
- 12.1.4.3. Company Financials
- 12.1.4.4. SWOT Analysis
- 12.1.5 GE Healthcare
- 12.1.5.1. Company Overview
- 12.1.5.2. Products
- 12.1.5.3. Company Financials
- 12.1.5.4. SWOT Analysis
- 12.1.6 Koninklijke Philips NV
- 12.1.6.1. Company Overview
- 12.1.6.2. Products
- 12.1.6.3. Company Financials
- 12.1.6.4. SWOT Analysis
- 12.1.7 CompuMed Inc
- 12.1.7.1. Company Overview
- 12.1.7.2. Products
- 12.1.7.3. Company Financials
- 12.1.7.4. SWOT Analysis
- 12.1.8 Veradigm LLC
- 12.1.8.1. Company Overview
- 12.1.8.2. Products
- 12.1.8.3. Company Financials
- 12.1.8.4. SWOT Analysis
- 12.1.9 athenahealth Inc
- 12.1.9.1. Company Overview
- 12.1.9.2. Products
- 12.1.9.3. Company Financials
- 12.1.9.4. SWOT Analysis
- 12.1.10 Boston Scientific Corporation
- 12.1.10.1. Company Overview
- 12.1.10.2. Products
- 12.1.10.3. Company Financials
- 12.1.10.4. SWOT Analysis
- 12.1.11 Oracle Cerner
- 12.1.11.1. Company Overview
- 12.1.11.2. Products
- 12.1.11.3. Company Financials
- 12.1.11.4. SWOT Analysis
- 12.1.1 eClinicalWorks
- 12.2. Market Entropy
- 12.2.1 Company's Key Areas Served
- 12.2.2 Recent Developments
- 12.3. Company Market Share Analysis 2025
- 12.3.1 Top 5 Companies Market Share Analysis
- 12.3.2 Top 3 Companies Market Share Analysis
- 12.4. List of Potential Customers
- 13. Research Methodology
List of Figures
- Figure 1: Global eHealth Market Revenue Breakdown (Million, %) by Region 2025 & 2033
- Figure 2: Global eHealth Market Volume Breakdown (K Unit, %) by Region 2025 & 2033
- Figure 3: North America eHealth Market Revenue (Million), by Component 2025 & 2033
- Figure 4: North America eHealth Market Volume (K Unit), by Component 2025 & 2033
- Figure 5: North America eHealth Market Revenue Share (%), by Component 2025 & 2033
- Figure 6: North America eHealth Market Volume Share (%), by Component 2025 & 2033
- Figure 7: North America eHealth Market Revenue (Million), by Type of Service 2025 & 2033
- Figure 8: North America eHealth Market Volume (K Unit), by Type of Service 2025 & 2033
- Figure 9: North America eHealth Market Revenue Share (%), by Type of Service 2025 & 2033
- Figure 10: North America eHealth Market Volume Share (%), by Type of Service 2025 & 2033
- Figure 11: North America eHealth Market Revenue (Million), by End User 2025 & 2033
- Figure 12: North America eHealth Market Volume (K Unit), by End User 2025 & 2033
- Figure 13: North America eHealth Market Revenue Share (%), by End User 2025 & 2033
- Figure 14: North America eHealth Market Volume Share (%), by End User 2025 & 2033
- Figure 15: North America eHealth Market Revenue (Million), by Country 2025 & 2033
- Figure 16: North America eHealth Market Volume (K Unit), by Country 2025 & 2033
- Figure 17: North America eHealth Market Revenue Share (%), by Country 2025 & 2033
- Figure 18: North America eHealth Market Volume Share (%), by Country 2025 & 2033
- Figure 19: Europe eHealth Market Revenue (Million), by Component 2025 & 2033
- Figure 20: Europe eHealth Market Volume (K Unit), by Component 2025 & 2033
- Figure 21: Europe eHealth Market Revenue Share (%), by Component 2025 & 2033
- Figure 22: Europe eHealth Market Volume Share (%), by Component 2025 & 2033
- Figure 23: Europe eHealth Market Revenue (Million), by Type of Service 2025 & 2033
- Figure 24: Europe eHealth Market Volume (K Unit), by Type of Service 2025 & 2033
- Figure 25: Europe eHealth Market Revenue Share (%), by Type of Service 2025 & 2033
- Figure 26: Europe eHealth Market Volume Share (%), by Type of Service 2025 & 2033
- Figure 27: Europe eHealth Market Revenue (Million), by End User 2025 & 2033
- Figure 28: Europe eHealth Market Volume (K Unit), by End User 2025 & 2033
- Figure 29: Europe eHealth Market Revenue Share (%), by End User 2025 & 2033
- Figure 30: Europe eHealth Market Volume Share (%), by End User 2025 & 2033
- Figure 31: Europe eHealth Market Revenue (Million), by Country 2025 & 2033
- Figure 32: Europe eHealth Market Volume (K Unit), by Country 2025 & 2033
- Figure 33: Europe eHealth Market Revenue Share (%), by Country 2025 & 2033
- Figure 34: Europe eHealth Market Volume Share (%), by Country 2025 & 2033
- Figure 35: Asia Pacific eHealth Market Revenue (Million), by Component 2025 & 2033
- Figure 36: Asia Pacific eHealth Market Volume (K Unit), by Component 2025 & 2033
- Figure 37: Asia Pacific eHealth Market Revenue Share (%), by Component 2025 & 2033
- Figure 38: Asia Pacific eHealth Market Volume Share (%), by Component 2025 & 2033
- Figure 39: Asia Pacific eHealth Market Revenue (Million), by Type of Service 2025 & 2033
- Figure 40: Asia Pacific eHealth Market Volume (K Unit), by Type of Service 2025 & 2033
- Figure 41: Asia Pacific eHealth Market Revenue Share (%), by Type of Service 2025 & 2033
- Figure 42: Asia Pacific eHealth Market Volume Share (%), by Type of Service 2025 & 2033
- Figure 43: Asia Pacific eHealth Market Revenue (Million), by End User 2025 & 2033
- Figure 44: Asia Pacific eHealth Market Volume (K Unit), by End User 2025 & 2033
- Figure 45: Asia Pacific eHealth Market Revenue Share (%), by End User 2025 & 2033
- Figure 46: Asia Pacific eHealth Market Volume Share (%), by End User 2025 & 2033
- Figure 47: Asia Pacific eHealth Market Revenue (Million), by Country 2025 & 2033
- Figure 48: Asia Pacific eHealth Market Volume (K Unit), by Country 2025 & 2033
- Figure 49: Asia Pacific eHealth Market Revenue Share (%), by Country 2025 & 2033
- Figure 50: Asia Pacific eHealth Market Volume Share (%), by Country 2025 & 2033
- Figure 51: Middle East and Africa eHealth Market Revenue (Million), by Component 2025 & 2033
- Figure 52: Middle East and Africa eHealth Market Volume (K Unit), by Component 2025 & 2033
- Figure 53: Middle East and Africa eHealth Market Revenue Share (%), by Component 2025 & 2033
- Figure 54: Middle East and Africa eHealth Market Volume Share (%), by Component 2025 & 2033
- Figure 55: Middle East and Africa eHealth Market Revenue (Million), by Type of Service 2025 & 2033
- Figure 56: Middle East and Africa eHealth Market Volume (K Unit), by Type of Service 2025 & 2033
- Figure 57: Middle East and Africa eHealth Market Revenue Share (%), by Type of Service 2025 & 2033
- Figure 58: Middle East and Africa eHealth Market Volume Share (%), by Type of Service 2025 & 2033
- Figure 59: Middle East and Africa eHealth Market Revenue (Million), by End User 2025 & 2033
- Figure 60: Middle East and Africa eHealth Market Volume (K Unit), by End User 2025 & 2033
- Figure 61: Middle East and Africa eHealth Market Revenue Share (%), by End User 2025 & 2033
- Figure 62: Middle East and Africa eHealth Market Volume Share (%), by End User 2025 & 2033
- Figure 63: Middle East and Africa eHealth Market Revenue (Million), by Country 2025 & 2033
- Figure 64: Middle East and Africa eHealth Market Volume (K Unit), by Country 2025 & 2033
- Figure 65: Middle East and Africa eHealth Market Revenue Share (%), by Country 2025 & 2033
- Figure 66: Middle East and Africa eHealth Market Volume Share (%), by Country 2025 & 2033
- Figure 67: South America eHealth Market Revenue (Million), by Component 2025 & 2033
- Figure 68: South America eHealth Market Volume (K Unit), by Component 2025 & 2033
- Figure 69: South America eHealth Market Revenue Share (%), by Component 2025 & 2033
- Figure 70: South America eHealth Market Volume Share (%), by Component 2025 & 2033
- Figure 71: South America eHealth Market Revenue (Million), by Type of Service 2025 & 2033
- Figure 72: South America eHealth Market Volume (K Unit), by Type of Service 2025 & 2033
- Figure 73: South America eHealth Market Revenue Share (%), by Type of Service 2025 & 2033
- Figure 74: South America eHealth Market Volume Share (%), by Type of Service 2025 & 2033
- Figure 75: South America eHealth Market Revenue (Million), by End User 2025 & 2033
- Figure 76: South America eHealth Market Volume (K Unit), by End User 2025 & 2033
- Figure 77: South America eHealth Market Revenue Share (%), by End User 2025 & 2033
- Figure 78: South America eHealth Market Volume Share (%), by End User 2025 & 2033
- Figure 79: South America eHealth Market Revenue (Million), by Country 2025 & 2033
- Figure 80: South America eHealth Market Volume (K Unit), by Country 2025 & 2033
- Figure 81: South America eHealth Market Revenue Share (%), by Country 2025 & 2033
- Figure 82: South America eHealth Market Volume Share (%), by Country 2025 & 2033
List of Tables
- Table 1: Global eHealth Market Revenue Million Forecast, by Component 2020 & 2033
- Table 2: Global eHealth Market Volume K Unit Forecast, by Component 2020 & 2033
- Table 3: Global eHealth Market Revenue Million Forecast, by Type of Service 2020 & 2033
- Table 4: Global eHealth Market Volume K Unit Forecast, by Type of Service 2020 & 2033
- Table 5: Global eHealth Market Revenue Million Forecast, by End User 2020 & 2033
- Table 6: Global eHealth Market Volume K Unit Forecast, by End User 2020 & 2033
- Table 7: Global eHealth Market Revenue Million Forecast, by Region 2020 & 2033
- Table 8: Global eHealth Market Volume K Unit Forecast, by Region 2020 & 2033
- Table 9: Global eHealth Market Revenue Million Forecast, by Component 2020 & 2033
- Table 10: Global eHealth Market Volume K Unit Forecast, by Component 2020 & 2033
- Table 11: Global eHealth Market Revenue Million Forecast, by Type of Service 2020 & 2033
- Table 12: Global eHealth Market Volume K Unit Forecast, by Type of Service 2020 & 2033
- Table 13: Global eHealth Market Revenue Million Forecast, by End User 2020 & 2033
- Table 14: Global eHealth Market Volume K Unit Forecast, by End User 2020 & 2033
- Table 15: Global eHealth Market Revenue Million Forecast, by Country 2020 & 2033
- Table 16: Global eHealth Market Volume K Unit Forecast, by Country 2020 & 2033
- Table 17: United States eHealth Market Revenue (Million) Forecast, by Application 2020 & 2033
- Table 18: United States eHealth Market Volume (K Unit) Forecast, by Application 2020 & 2033
- Table 19: Canada eHealth Market Revenue (Million) Forecast, by Application 2020 & 2033
- Table 20: Canada eHealth Market Volume (K Unit) Forecast, by Application 2020 & 2033
- Table 21: Mexico eHealth Market Revenue (Million) Forecast, by Application 2020 & 2033
- Table 22: Mexico eHealth Market Volume (K Unit) Forecast, by Application 2020 & 2033
- Table 23: Global eHealth Market Revenue Million Forecast, by Component 2020 & 2033
- Table 24: Global eHealth Market Volume K Unit Forecast, by Component 2020 & 2033
- Table 25: Global eHealth Market Revenue Million Forecast, by Type of Service 2020 & 2033
- Table 26: Global eHealth Market Volume K Unit Forecast, by Type of Service 2020 & 2033
- Table 27: Global eHealth Market Revenue Million Forecast, by End User 2020 & 2033
- Table 28: Global eHealth Market Volume K Unit Forecast, by End User 2020 & 2033
- Table 29: Global eHealth Market Revenue Million Forecast, by Country 2020 & 2033
- Table 30: Global eHealth Market Volume K Unit Forecast, by Country 2020 & 2033
- Table 31: United Kingdom eHealth Market Revenue (Million) Forecast, by Application 2020 & 2033
- Table 32: United Kingdom eHealth Market Volume (K Unit) Forecast, by Application 2020 & 2033
- Table 33: Germany eHealth Market Revenue (Million) Forecast, by Application 2020 & 2033
- Table 34: Germany eHealth Market Volume (K Unit) Forecast, by Application 2020 & 2033
- Table 35: France eHealth Market Revenue (Million) Forecast, by Application 2020 & 2033
- Table 36: France eHealth Market Volume (K Unit) Forecast, by Application 2020 & 2033
- Table 37: Italy eHealth Market Revenue (Million) Forecast, by Application 2020 & 2033
- Table 38: Italy eHealth Market Volume (K Unit) Forecast, by Application 2020 & 2033
- Table 39: Spain eHealth Market Revenue (Million) Forecast, by Application 2020 & 2033
- Table 40: Spain eHealth Market Volume (K Unit) Forecast, by Application 2020 & 2033
- Table 41: Rest of Europe eHealth Market Revenue (Million) Forecast, by Application 2020 & 2033
- Table 42: Rest of Europe eHealth Market Volume (K Unit) Forecast, by Application 2020 & 2033
- Table 43: Global eHealth Market Revenue Million Forecast, by Component 2020 & 2033
- Table 44: Global eHealth Market Volume K Unit Forecast, by Component 2020 & 2033
- Table 45: Global eHealth Market Revenue Million Forecast, by Type of Service 2020 & 2033
- Table 46: Global eHealth Market Volume K Unit Forecast, by Type of Service 2020 & 2033
- Table 47: Global eHealth Market Revenue Million Forecast, by End User 2020 & 2033
- Table 48: Global eHealth Market Volume K Unit Forecast, by End User 2020 & 2033
- Table 49: Global eHealth Market Revenue Million Forecast, by Country 2020 & 2033
- Table 50: Global eHealth Market Volume K Unit Forecast, by Country 2020 & 2033
- Table 51: China eHealth Market Revenue (Million) Forecast, by Application 2020 & 2033
- Table 52: China eHealth Market Volume (K Unit) Forecast, by Application 2020 & 2033
- Table 53: Japan eHealth Market Revenue (Million) Forecast, by Application 2020 & 2033
- Table 54: Japan eHealth Market Volume (K Unit) Forecast, by Application 2020 & 2033
- Table 55: India eHealth Market Revenue (Million) Forecast, by Application 2020 & 2033
- Table 56: India eHealth Market Volume (K Unit) Forecast, by Application 2020 & 2033
- Table 57: Australia eHealth Market Revenue (Million) Forecast, by Application 2020 & 2033
- Table 58: Australia eHealth Market Volume (K Unit) Forecast, by Application 2020 & 2033
- Table 59: South Korea eHealth Market Revenue (Million) Forecast, by Application 2020 & 2033
- Table 60: South Korea eHealth Market Volume (K Unit) Forecast, by Application 2020 & 2033
- Table 61: Rest of Asia Pacific eHealth Market Revenue (Million) Forecast, by Application 2020 & 2033
- Table 62: Rest of Asia Pacific eHealth Market Volume (K Unit) Forecast, by Application 2020 & 2033
- Table 63: Global eHealth Market Revenue Million Forecast, by Component 2020 & 2033
- Table 64: Global eHealth Market Volume K Unit Forecast, by Component 2020 & 2033
- Table 65: Global eHealth Market Revenue Million Forecast, by Type of Service 2020 & 2033
- Table 66: Global eHealth Market Volume K Unit Forecast, by Type of Service 2020 & 2033
- Table 67: Global eHealth Market Revenue Million Forecast, by End User 2020 & 2033
- Table 68: Global eHealth Market Volume K Unit Forecast, by End User 2020 & 2033
- Table 69: Global eHealth Market Revenue Million Forecast, by Country 2020 & 2033
- Table 70: Global eHealth Market Volume K Unit Forecast, by Country 2020 & 2033
- Table 71: GCC eHealth Market Revenue (Million) Forecast, by Application 2020 & 2033
- Table 72: GCC eHealth Market Volume (K Unit) Forecast, by Application 2020 & 2033
- Table 73: South Africa eHealth Market Revenue (Million) Forecast, by Application 2020 & 2033
- Table 74: South Africa eHealth Market Volume (K Unit) Forecast, by Application 2020 & 2033
- Table 75: Rest of Middle East and Africa eHealth Market Revenue (Million) Forecast, by Application 2020 & 2033
- Table 76: Rest of Middle East and Africa eHealth Market Volume (K Unit) Forecast, by Application 2020 & 2033
- Table 77: Global eHealth Market Revenue Million Forecast, by Component 2020 & 2033
- Table 78: Global eHealth Market Volume K Unit Forecast, by Component 2020 & 2033
- Table 79: Global eHealth Market Revenue Million Forecast, by Type of Service 2020 & 2033
- Table 80: Global eHealth Market Volume K Unit Forecast, by Type of Service 2020 & 2033
- Table 81: Global eHealth Market Revenue Million Forecast, by End User 2020 & 2033
- Table 82: Global eHealth Market Volume K Unit Forecast, by End User 2020 & 2033
- Table 83: Global eHealth Market Revenue Million Forecast, by Country 2020 & 2033
- Table 84: Global eHealth Market Volume K Unit Forecast, by Country 2020 & 2033
- Table 85: Brazil eHealth Market Revenue (Million) Forecast, by Application 2020 & 2033
- Table 86: Brazil eHealth Market Volume (K Unit) Forecast, by Application 2020 & 2033
- Table 87: Argentina eHealth Market Revenue (Million) Forecast, by Application 2020 & 2033
- Table 88: Argentina eHealth Market Volume (K Unit) Forecast, by Application 2020 & 2033
- Table 89: Rest of South America eHealth Market Revenue (Million) Forecast, by Application 2020 & 2033
- Table 90: Rest of South America eHealth Market Volume (K Unit) Forecast, by Application 2020 & 2033
Frequently Asked Questions
1. What is the projected Compound Annual Growth Rate (CAGR) of the eHealth Market?
The projected CAGR is approximately 16.02%.
2. Which companies are prominent players in the eHealth Market?
Key companies in the market include eClinicalWorks, Optum Health, Epic Systems Corporation, Siemens Healthineers, GE Healthcare, Koninklijke Philips NV, CompuMed Inc, Veradigm LLC, athenahealth Inc, Boston Scientific Corporation, Oracle Cerner.
3. What are the main segments of the eHealth Market?
The market segments include Component, Type of Service, End User.
4. Can you provide details about the market size?
The market size is estimated to be USD 236.47 Million as of 2022.
5. What are some drivers contributing to market growth?
Growth in IoT and Technological Innovations; Rising Preference Toward Mobile Technology and Internet; Rising Demand for Population Health Management.
6. What are the notable trends driving market growth?
e-Prescribing Segment is Expected to Hold a Significant Market Share Over The Forecast Period.
7. Are there any restraints impacting market growth?
Concerns over Data Security; Lack of Reimbursement Policies in the Emerging Markets; Lack of Proper Infrastructure for eHealth in Emerging Markets.
8. Can you provide examples of recent developments in the market?
January 2023: India's National Health Authority launched an incentive scheme for healthcare providers and other stakeholders of the country's digital health ecosystem to promote the creation of digital health records.
9. What pricing options are available for accessing the report?
Pricing options include single-user, multi-user, and enterprise licenses priced at USD 4750, USD 5250, and USD 8750 respectively.
10. Is the market size provided in terms of value or volume?
The market size is provided in terms of value, measured in Million and volume, measured in K Unit.
11. Are there any specific market keywords associated with the report?
Yes, the market keyword associated with the report is "eHealth Market," which aids in identifying and referencing the specific market segment covered.
12. How do I determine which pricing option suits my needs best?
The pricing options vary based on user requirements and access needs. Individual users may opt for single-user licenses, while businesses requiring broader access may choose multi-user or enterprise licenses for cost-effective access to the report.
13. Are there any additional resources or data provided in the eHealth Market report?
While the report offers comprehensive insights, it's advisable to review the specific contents or supplementary materials provided to ascertain if additional resources or data are available.
14. How can I stay updated on further developments or reports in the eHealth Market?
To stay informed about further developments, trends, and reports in the eHealth Market, consider subscribing to industry newsletters, following relevant companies and organizations, or regularly checking reputable industry news sources and publications.
Methodology
Step 1 - Identification of Relevant Samples Size from Population Database


Step 2 - Approaches for Defining Global Market Size (Value, Volume* & Price*)

Note*: In applicable scenarios
Step 3 - Data Sources
Primary Research
- Web Analytics
- Survey Reports
- Research Institute
- Latest Research Reports
- Opinion Leaders
Secondary Research
- Annual Reports
- White Paper
- Latest Press Release
- Industry Association
- Paid Database
- Investor Presentations

Step 4 - Data Triangulation
Involves using different sources of information in order to increase the validity of a study
These sources are likely to be stakeholders in a program - participants, other researchers, program staff, other community members, and so on.
Then we put all data in single framework & apply various statistical tools to find out the dynamic on the market.
During the analysis stage, feedback from the stakeholder groups would be compared to determine areas of agreement as well as areas of divergence