

Key Insights
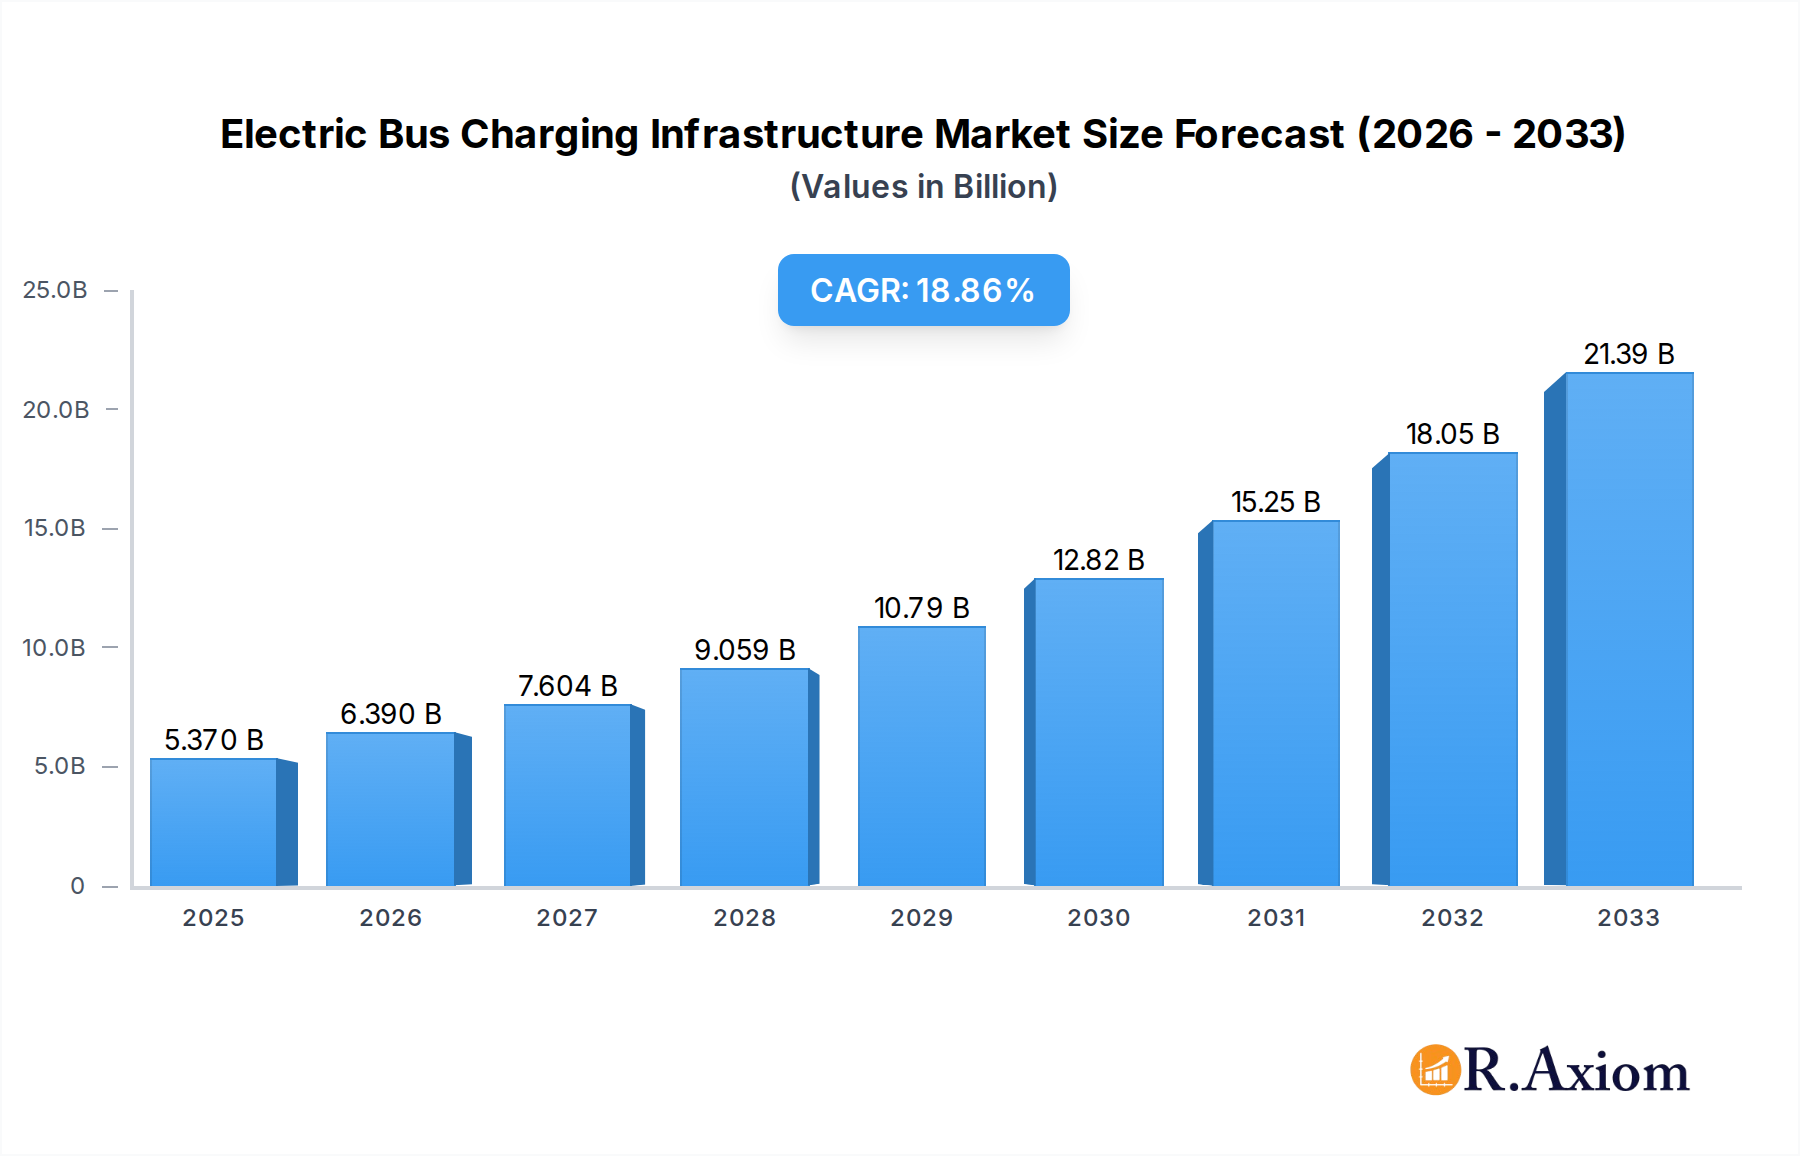
The global Electric Bus Charging Infrastructure Market is poised for significant expansion, projected to reach a valuation of $5,370 Million in 2025, with a robust CAGR of 19.00% anticipated through 2033. This impressive growth is primarily fueled by aggressive government initiatives aimed at decarbonizing public transportation, coupled with the increasing demand for sustainable and eco-friendly urban mobility solutions. The rising awareness of environmental concerns and the declining total cost of ownership for electric buses, driven by lower operational and maintenance costs compared to their diesel counterparts, are further propelling market adoption. Key drivers include supportive policies such as subsidies, tax incentives, and mandates for zero-emission public transport fleets. Furthermore, advancements in charging technology, including faster charging speeds and the development of smart charging solutions that optimize energy consumption and grid integration, are crucial in addressing range anxiety and ensuring the efficient operation of electric bus fleets. The market is witnessing a surge in investment from both public and private sectors, fostering innovation and accelerating the deployment of widespread charging networks.

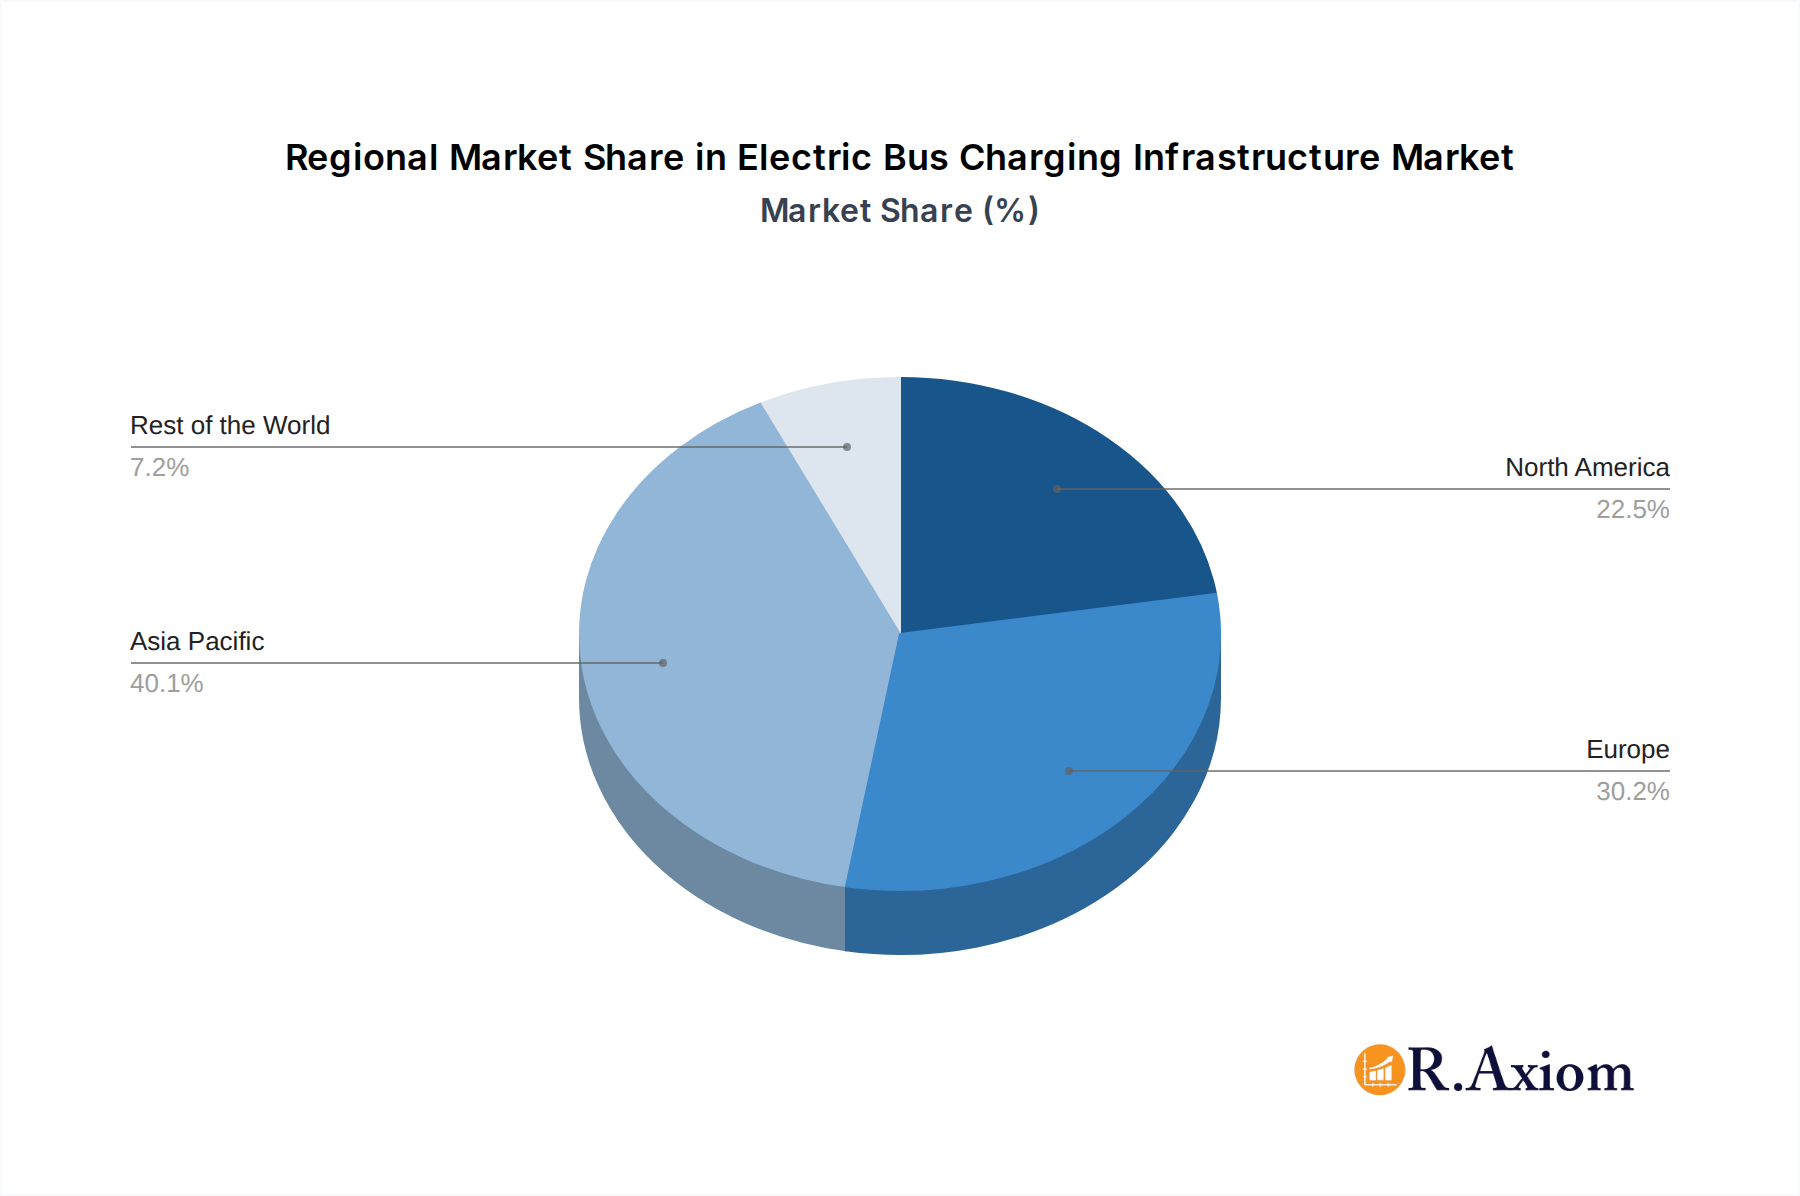
Electric Bus Charging Infrastructure Market Market Size (In Billion)
The market segmentation reveals a dual approach to electric bus charging, with Plug-in Charging and Overhead Charging holding significant sway. Plug-in charging offers flexibility and can be deployed at depots, while overhead charging, often seen at bus stops or terminals, provides rapid opportunity charging, crucial for maintaining service schedules. Leading companies such as BYD Auto Co Ltd, Proterra Inc, and ABB Ltd are at the forefront, not only manufacturing electric buses but also developing and deploying integrated charging solutions. The competitive landscape is characterized by collaborations and strategic partnerships between electric bus manufacturers, charging infrastructure suppliers, and utility providers, all working towards creating a seamless charging ecosystem. Geographically, Asia Pacific, led by China, is expected to dominate the market due to its extensive electric bus deployments and proactive government policies. North America and Europe are also witnessing substantial growth, driven by stringent emission regulations and a strong focus on sustainable urban development. Challenges such as high initial investment costs for charging infrastructure and grid capacity limitations are being addressed through technological advancements and supportive regulatory frameworks, paving the way for a sustainable future for electric bus transportation.
Electric Bus Charging Infrastructure Market Company Market Share
Electric Bus Charging Infrastructure Market Market Concentration & Innovation
The electric bus charging infrastructure market is characterized by a moderate level of concentration, with a few dominant players controlling a significant share of the market. Leading electric bus manufacturers like BYD Auto Co Ltd and Zhengzhou Yutong Bus Co Ltd are increasingly integrating charging solutions, blurring the lines between vehicle and infrastructure supply. Innovation is primarily driven by the need for faster charging, higher efficiency, smart grid integration, and autonomous charging solutions. Regulatory frameworks, such as government incentives for EV adoption and charging infrastructure development, are crucial catalysts. Product substitutes include traditional diesel buses and alternative fuel vehicles, though their market share is steadily declining due to environmental concerns and evolving technology. End-user trends are heavily influenced by public transportation authorities' sustainability goals and the total cost of ownership benefits offered by electric buses. Mergers and acquisition (M&A) activities, such as ABB E-Mobility's pre-IPO private placement of USD 214 million, indicate significant investment and consolidation efforts within the sector. Companies like ABB Ltd, Siemens AG, and ChargePoint Inc. are actively expanding their market reach through strategic partnerships and capital infusion to bolster organic and inorganic growth, including potential M&A opportunities. The market share of key players is continuously evolving as new technologies and business models emerge.
Electric Bus Charging Infrastructure Market Industry Trends & Insights
The global electric bus charging infrastructure market is experiencing robust growth, fueled by an accelerating shift towards sustainable urban transportation. Driven by increasing environmental regulations, government mandates for zero-emission fleets, and growing public awareness of climate change, the adoption of electric buses is projected to witness a significant compound annual growth rate (CAGR) of approximately 25-30% during the forecast period of 2025–2033. This surge in electric bus deployment directly translates into a substantial demand for advanced and reliable charging solutions. Technological disruptions are playing a pivotal role, with continuous advancements in charging speeds, battery technology, and grid integration solutions. Fast charging, opportunity charging (charging during short stops), and depot charging remain key segments, with ongoing innovation in inductive and wireless charging technologies poised to further enhance convenience and operational efficiency. Consumer preferences, largely dictated by public transit authorities and fleet operators, are prioritizing total cost of ownership, charging reliability, and scalability of charging infrastructure. Competitive dynamics are intensifying, with established players in the energy, automotive, and technology sectors vying for market share. Strategic collaborations and vertical integration are becoming common as companies aim to offer comprehensive end-to-end solutions. For instance, the collaboration between Siemens AG and MAHLE Group on wireless charging systems highlights the industry's commitment to future-proofing electric mobility. Market penetration for electric buses is rapidly increasing in developed regions like North America and Europe, and emerging economies are also showing strong adoption rates, driven by urbanization and a focus on improving air quality. The market is moving towards smart charging solutions that optimize energy consumption and grid stability, incorporating features like vehicle-to-grid (V2G) capabilities.
Dominant Markets & Segments in Electric Bus Charging Infrastructure Market
The electric bus charging infrastructure market is witnessing dominance from regions and segments that are at the forefront of electric mobility adoption and supportive regulatory policies. North America and Europe are currently the leading geographical markets, propelled by stringent emission standards, substantial government subsidies for electric vehicle procurement and infrastructure development, and the proactive initiatives of major transit authorities. For example, the United States and various European nations have set ambitious targets for electrifying their public transport fleets, driving significant investment in charging solutions. Within the charging type segmentation, Plug-in Charging currently holds a dominant position.
- Plug-in Charging:
- High Installation Base: The established infrastructure and familiarity with plug-in technology make it the preferred choice for many transit agencies.
- Cost-Effectiveness: Generally, plug-in charging solutions offer a lower upfront cost compared to some overhead or wireless charging systems, making them more accessible for budget-conscious municipalities.
- Technological Maturity: The technology for plug-in charging is well-developed and reliable, offering various power outputs to meet different operational needs, from overnight depot charging to faster opportunity charging.
- Versatility: Plug-in chargers can be deployed at depots, bus stops, and other strategic locations, providing flexibility for charging schedules.
- Government Incentives: Many governmental incentives and grants are specifically tailored to support the deployment of plug-in electric bus charging infrastructure.
While Plug-in Charging leads, Overhead Charging is steadily gaining traction, particularly for high-frequency routes and situations where minimizing dwell time is critical. Technologies like pantograph-based systems are enabling rapid charging at intermediate stops, enhancing the operational range and efficiency of electric buses. The continued growth of electric bus fleets across major urban centers globally is the primary driver for this segment's expansion. The economic policies favoring sustainable transportation, coupled with the evolving infrastructure needs of transit agencies aiming for operational efficiency and reduced emissions, are key factors shaping the dominance of these segments.
Electric Bus Charging Infrastructure Market Product Developments
Product development in the electric bus charging infrastructure market is focused on enhancing charging speed, efficiency, and integration with the smart grid. Companies are innovating with high-power DC fast chargers (up to 600 kW and beyond) to minimize charging times for electric buses. Advancements in smart charging software enable optimized energy management, load balancing, and integration with renewable energy sources. The development of robust and weatherproof charging solutions designed for harsh environmental conditions and high-usage public transit operations is also a key trend.
Report Scope & Segmentation Analysis
This report provides a comprehensive analysis of the global Electric Bus Charging Infrastructure Market, segmented by Charging Type. The study period spans from 2019 to 2033, with a base year of 2025 and a forecast period from 2025 to 2033.
- Plug-in Charging: This segment encompasses charging solutions where electric buses are physically connected via cables and connectors to the power grid. It is projected to maintain a significant market share due to its established nature and cost-effectiveness. Growth is driven by the increasing deployment of electric buses and the availability of diverse charging power levels.
- Overhead Charging: This segment includes charging systems where power is delivered from an overhead source, such as pantograph systems. It is expected to witness robust growth due to its suitability for rapid charging at opportune moments and its role in enabling longer operational ranges for electric buses, particularly in high-demand transit routes.
Key Drivers of Electric Bus Charging Infrastructure Market Growth
The electric bus charging infrastructure market is propelled by several key drivers. Foremost is the escalating global commitment to decarbonization and the reduction of air pollution in urban areas, leading to government mandates and incentives for electric bus adoption. Technological advancements in battery technology and charging solutions are making electric buses more viable and cost-effective. Furthermore, the growing operational cost savings associated with electric buses compared to their diesel counterparts, including reduced fuel and maintenance expenses, are significant economic motivators.
Challenges in the Electric Bus Charging Infrastructure Market Sector
Despite the positive outlook, the electric bus charging infrastructure market faces several challenges. High upfront capital investment for charging infrastructure remains a significant barrier for many transit authorities. Grid capacity limitations and the need for substantial grid upgrades to support large-scale electric bus charging can also pose challenges. The standardization of charging protocols and connectors is still evolving, creating interoperability concerns. Additionally, the availability of skilled labor for installation and maintenance of complex charging systems can be a constraint.
Emerging Opportunities in Electric Bus Charging Infrastructure Market
Emerging opportunities in the electric bus charging infrastructure market lie in the development of smart charging solutions that integrate with renewable energy sources and optimize grid stability through V2G (Vehicle-to-Grid) technology. The expansion into new geographical markets with nascent electric bus adoption, particularly in developing economies, presents significant growth potential. Innovations in autonomous charging and wireless charging technologies offer new avenues for enhanced convenience and operational efficiency. The increasing focus on sustainability and circular economy principles also opens opportunities for battery recycling and second-life applications.
Leading Players in the Electric Bus Charging Infrastructure Market Market
- 10 Starline Holdings LLC
- Electric Bus Manufacturers
- 2 Proterra Inc (also an electric bus manufacturer)
- 11 EV Solutions (Webasto)
- 4 AB Volvo
- 3 ChargePoint Inc
- 1 BYD Auto Co Ltd
- 1 ABB Ltd
- 8 Heliox Energy
- 6 ALSTOM
- 5 Zhengzhou Yutong Bus Co Ltd
- 7 SemaConnect Inc
- 2 Mercedes-Benz AG
- 3 Traton SE
- 4 Siemens AG
- 7 NFI Group Inc
- 5 Schneider Electric SE
- 6 IVECO S p A
- 9 Vital EV Solutions
- Electric Charging Infrastructure Suppliers
Key Developments in Electric Bus Charging Infrastructure Market Industry
- November 2022: ABB E-Mobility, the electric vehicle charging solutions subsidiary of ABB Ltd., successfully raised CHF 200 million (USD 214 million) in a pre-IPO private placement. This capital infusion will support the company's growth strategy, including mergers and acquisitions, and is expected to be finalized in Q4 2022.
- September 2022: ABB E-Mobility commenced manufacturing operations in Columbia, South Carolina, creating over 100 new jobs. The multimillion-dollar investment in a new facility with an annual production capacity of up to 10,000 chargers (20 kW to 180 kW) will produce EV chargers, including those compliant with the Buy America Act, for fleets, school buses, and public charging stations.
- August 2022: Siemens and MAHLE Group partnered to collaborate on cutting-edge wireless charging systems for electric vehicles, focusing on developing and testing comprehensive infrastructure and automotive engineering systems, and establishing technological standards for inductive charging.
Strategic Outlook for Electric Bus Charging Infrastructure Market Market
The strategic outlook for the electric bus charging infrastructure market is overwhelmingly positive, driven by a confluence of strong governmental support, rapid technological advancements, and increasing environmental consciousness. The forecast period is expected to witness significant investments in expanding charging networks, particularly in urban centers transitioning towards sustainable public transportation. Innovations in smart grid integration and wireless charging will play a crucial role in enhancing operational efficiency and user convenience. Companies that can offer integrated solutions, from charging hardware to software management and grid services, are poised for substantial growth. The market's trajectory is set to be shaped by a growing demand for faster, more efficient, and scalable charging infrastructure to support the ever-expanding electric bus fleet.
Electric Bus Charging Infrastructure Market Segmentation
-
1. Charging Type
- 1.1. Plug-in Charging
- 1.2. Overhead Charging
Electric Bus Charging Infrastructure Market Segmentation By Geography
-
1. North America
- 1.1. United States
- 1.2. Canada
- 1.3. Rest of North America
-
2. Europe
- 2.1. Germany
- 2.2. United Kingdom
- 2.3. France
- 2.4. Italy
- 2.5. Spain
- 2.6. Rest of Europe
-
3. Asia Pacific
- 3.1. China
- 3.2. India
- 3.3. Japan
- 3.4. South Korea
- 3.5. Rest of Asia Pacific
-
4. Rest of the World
- 4.1. South America
- 4.2. Middle East and Africa
Electric Bus Charging Infrastructure Market Regional Market Share
Geographic Coverage of Electric Bus Charging Infrastructure Market
Electric Bus Charging Infrastructure Market REPORT HIGHLIGHTS
| Aspects | Details |
|---|---|
| Study Period | 2020-2034 |
| Base Year | 2025 |
| Estimated Year | 2026 |
| Forecast Period | 2026-2034 |
| Historical Period | 2020-2025 |
| Growth Rate | CAGR of 19.00% from 2020-2034 |
| Segmentation |
|
Table of Contents
- 1. Introduction
- 1.1. Research Scope
- 1.2. Market Segmentation
- 1.3. Research Objective
- 1.4. Definitions and Assumptions
- 2. Executive Summary
- 2.1. Market Snapshot
- 3. Market Dynamics
- 3.1. Market Drivers
- 3.2. Market Restrains
- 3.3. Market Trends
- 3.4. Market Opportunities
- 4. Market Factor Analysis
- 4.1. Porters Five Forces
- 4.1.1. Bargaining Power of Suppliers
- 4.1.2. Bargaining Power of Buyers
- 4.1.3. Threat of New Entrants
- 4.1.4. Threat of Substitutes
- 4.1.5. Competitive Rivalry
- 4.2. PESTEL analysis
- 4.3. BCG Analysis
- 4.3.1. Stars (High Growth, High Market Share)
- 4.3.2. Cash Cows (Low Growth, High Market Share)
- 4.3.3. Question Mark (High Growth, Low Market Share)
- 4.3.4. Dogs (Low Growth, Low Market Share)
- 4.4. Ansoff Matrix Analysis
- 4.5. Supply Chain Analysis
- 4.6. Regulatory Landscape
- 4.7. Current Market Potential and Opportunity Assessment (TAM–SAM–SOM Framework)
- 4.8. RAX Analyst Note
- 4.1. Porters Five Forces
- 5. Market Analysis, Insights and Forecast 2021-2033
- 5.1. Market Analysis, Insights and Forecast - by Charging Type
- 5.1.1. Plug-in Charging
- 5.1.2. Overhead Charging
- 5.2. Market Analysis, Insights and Forecast - by Region
- 5.2.1. North America
- 5.2.2. Europe
- 5.2.3. Asia Pacific
- 5.2.4. Rest of the World
- 5.1. Market Analysis, Insights and Forecast - by Charging Type
- 6. Global Electric Bus Charging Infrastructure Market Analysis, Insights and Forecast, 2021-2033
- 6.1. Market Analysis, Insights and Forecast - by Charging Type
- 6.1.1. Plug-in Charging
- 6.1.2. Overhead Charging
- 6.1. Market Analysis, Insights and Forecast - by Charging Type
- 7. North America Electric Bus Charging Infrastructure Market Analysis, Insights and Forecast, 2020-2032
- 7.1. Market Analysis, Insights and Forecast - by Charging Type
- 7.1.1. Plug-in Charging
- 7.1.2. Overhead Charging
- 7.1. Market Analysis, Insights and Forecast - by Charging Type
- 8. Europe Electric Bus Charging Infrastructure Market Analysis, Insights and Forecast, 2020-2032
- 8.1. Market Analysis, Insights and Forecast - by Charging Type
- 8.1.1. Plug-in Charging
- 8.1.2. Overhead Charging
- 8.1. Market Analysis, Insights and Forecast - by Charging Type
- 9. Asia Pacific Electric Bus Charging Infrastructure Market Analysis, Insights and Forecast, 2020-2032
- 9.1. Market Analysis, Insights and Forecast - by Charging Type
- 9.1.1. Plug-in Charging
- 9.1.2. Overhead Charging
- 9.1. Market Analysis, Insights and Forecast - by Charging Type
- 10. Rest of the World Electric Bus Charging Infrastructure Market Analysis, Insights and Forecast, 2020-2032
- 10.1. Market Analysis, Insights and Forecast - by Charging Type
- 10.1.1. Plug-in Charging
- 10.1.2. Overhead Charging
- 10.1. Market Analysis, Insights and Forecast - by Charging Type
- 11. Competitive Analysis
- 11.1. Company Profiles
- 11.1.1 10 Starline Holdings LLC
- 11.1.1.1. Company Overview
- 11.1.1.2. Products
- 11.1.1.3. Company Financials
- 11.1.1.4. SWOT Analysis
- 11.1.2 Electric Bus Manufacturers
- 11.1.2.1. Company Overview
- 11.1.2.2. Products
- 11.1.2.3. Company Financials
- 11.1.2.4. SWOT Analysis
- 11.1.3 2 Proterra Inc (also an electric bus manufacturer)
- 11.1.3.1. Company Overview
- 11.1.3.2. Products
- 11.1.3.3. Company Financials
- 11.1.3.4. SWOT Analysis
- 11.1.4 11 EV Solutions (Webasto)
- 11.1.4.1. Company Overview
- 11.1.4.2. Products
- 11.1.4.3. Company Financials
- 11.1.4.4. SWOT Analysis
- 11.1.5 4 AB Volvo
- 11.1.5.1. Company Overview
- 11.1.5.2. Products
- 11.1.5.3. Company Financials
- 11.1.5.4. SWOT Analysis
- 11.1.6 3 ChargePoint Inc
- 11.1.6.1. Company Overview
- 11.1.6.2. Products
- 11.1.6.3. Company Financials
- 11.1.6.4. SWOT Analysis
- 11.1.7 1 BYD Auto Co Ltd
- 11.1.7.1. Company Overview
- 11.1.7.2. Products
- 11.1.7.3. Company Financials
- 11.1.7.4. SWOT Analysis
- 11.1.8 1 ABB Ltd
- 11.1.8.1. Company Overview
- 11.1.8.2. Products
- 11.1.8.3. Company Financials
- 11.1.8.4. SWOT Analysis
- 11.1.9 8 Heliox Energy
- 11.1.9.1. Company Overview
- 11.1.9.2. Products
- 11.1.9.3. Company Financials
- 11.1.9.4. SWOT Analysis
- 11.1.10 6 ALSTOM
- 11.1.10.1. Company Overview
- 11.1.10.2. Products
- 11.1.10.3. Company Financials
- 11.1.10.4. SWOT Analysis
- 11.1.11 5 Zhengzhou Yutong Bus Co Ltd
- 11.1.11.1. Company Overview
- 11.1.11.2. Products
- 11.1.11.3. Company Financials
- 11.1.11.4. SWOT Analysis
- 11.1.12 7 SemaConnect Inc
- 11.1.12.1. Company Overview
- 11.1.12.2. Products
- 11.1.12.3. Company Financials
- 11.1.12.4. SWOT Analysis
- 11.1.13 2 Mercedes-Benz AG
- 11.1.13.1. Company Overview
- 11.1.13.2. Products
- 11.1.13.3. Company Financials
- 11.1.13.4. SWOT Analysis
- 11.1.14 3 Traton SE
- 11.1.14.1. Company Overview
- 11.1.14.2. Products
- 11.1.14.3. Company Financials
- 11.1.14.4. SWOT Analysis
- 11.1.15 4 Siemens AG
- 11.1.15.1. Company Overview
- 11.1.15.2. Products
- 11.1.15.3. Company Financials
- 11.1.15.4. SWOT Analysis
- 11.1.16 7 NFI Group Inc
- 11.1.16.1. Company Overview
- 11.1.16.2. Products
- 11.1.16.3. Company Financials
- 11.1.16.4. SWOT Analysis
- 11.1.17 5 Schneider Electric SE
- 11.1.17.1. Company Overview
- 11.1.17.2. Products
- 11.1.17.3. Company Financials
- 11.1.17.4. SWOT Analysis
- 11.1.18 6 IVECO S p A
- 11.1.18.1. Company Overview
- 11.1.18.2. Products
- 11.1.18.3. Company Financials
- 11.1.18.4. SWOT Analysis
- 11.1.19 9 Vital EV Solutions
- 11.1.19.1. Company Overview
- 11.1.19.2. Products
- 11.1.19.3. Company Financials
- 11.1.19.4. SWOT Analysis
- 11.1.20 Electric Charging Infrastructure Suppliers
- 11.1.20.1. Company Overview
- 11.1.20.2. Products
- 11.1.20.3. Company Financials
- 11.1.20.4. SWOT Analysis
- 11.1.1 10 Starline Holdings LLC
- 11.2. Market Entropy
- 11.2.1 Company's Key Areas Served
- 11.2.2 Recent Developments
- 11.3. Company Market Share Analysis 2025
- 11.3.1 Top 5 Companies Market Share Analysis
- 11.3.2 Top 3 Companies Market Share Analysis
- 11.4. List of Potential Customers
- 12. Research Methodology
List of Figures
- Figure 1: Global Electric Bus Charging Infrastructure Market Revenue Breakdown (Million, %) by Region 2025 & 2033
- Figure 2: North America Electric Bus Charging Infrastructure Market Revenue (Million), by Charging Type 2025 & 2033
- Figure 3: North America Electric Bus Charging Infrastructure Market Revenue Share (%), by Charging Type 2025 & 2033
- Figure 4: North America Electric Bus Charging Infrastructure Market Revenue (Million), by Country 2025 & 2033
- Figure 5: North America Electric Bus Charging Infrastructure Market Revenue Share (%), by Country 2025 & 2033
- Figure 6: Europe Electric Bus Charging Infrastructure Market Revenue (Million), by Charging Type 2025 & 2033
- Figure 7: Europe Electric Bus Charging Infrastructure Market Revenue Share (%), by Charging Type 2025 & 2033
- Figure 8: Europe Electric Bus Charging Infrastructure Market Revenue (Million), by Country 2025 & 2033
- Figure 9: Europe Electric Bus Charging Infrastructure Market Revenue Share (%), by Country 2025 & 2033
- Figure 10: Asia Pacific Electric Bus Charging Infrastructure Market Revenue (Million), by Charging Type 2025 & 2033
- Figure 11: Asia Pacific Electric Bus Charging Infrastructure Market Revenue Share (%), by Charging Type 2025 & 2033
- Figure 12: Asia Pacific Electric Bus Charging Infrastructure Market Revenue (Million), by Country 2025 & 2033
- Figure 13: Asia Pacific Electric Bus Charging Infrastructure Market Revenue Share (%), by Country 2025 & 2033
- Figure 14: Rest of the World Electric Bus Charging Infrastructure Market Revenue (Million), by Charging Type 2025 & 2033
- Figure 15: Rest of the World Electric Bus Charging Infrastructure Market Revenue Share (%), by Charging Type 2025 & 2033
- Figure 16: Rest of the World Electric Bus Charging Infrastructure Market Revenue (Million), by Country 2025 & 2033
- Figure 17: Rest of the World Electric Bus Charging Infrastructure Market Revenue Share (%), by Country 2025 & 2033
List of Tables
- Table 1: Global Electric Bus Charging Infrastructure Market Revenue Million Forecast, by Charging Type 2020 & 2033
- Table 2: Global Electric Bus Charging Infrastructure Market Revenue Million Forecast, by Region 2020 & 2033
- Table 3: Global Electric Bus Charging Infrastructure Market Revenue Million Forecast, by Charging Type 2020 & 2033
- Table 4: Global Electric Bus Charging Infrastructure Market Revenue Million Forecast, by Country 2020 & 2033
- Table 5: United States Electric Bus Charging Infrastructure Market Revenue (Million) Forecast, by Application 2020 & 2033
- Table 6: Canada Electric Bus Charging Infrastructure Market Revenue (Million) Forecast, by Application 2020 & 2033
- Table 7: Rest of North America Electric Bus Charging Infrastructure Market Revenue (Million) Forecast, by Application 2020 & 2033
- Table 8: Global Electric Bus Charging Infrastructure Market Revenue Million Forecast, by Charging Type 2020 & 2033
- Table 9: Global Electric Bus Charging Infrastructure Market Revenue Million Forecast, by Country 2020 & 2033
- Table 10: Germany Electric Bus Charging Infrastructure Market Revenue (Million) Forecast, by Application 2020 & 2033
- Table 11: United Kingdom Electric Bus Charging Infrastructure Market Revenue (Million) Forecast, by Application 2020 & 2033
- Table 12: France Electric Bus Charging Infrastructure Market Revenue (Million) Forecast, by Application 2020 & 2033
- Table 13: Italy Electric Bus Charging Infrastructure Market Revenue (Million) Forecast, by Application 2020 & 2033
- Table 14: Spain Electric Bus Charging Infrastructure Market Revenue (Million) Forecast, by Application 2020 & 2033
- Table 15: Rest of Europe Electric Bus Charging Infrastructure Market Revenue (Million) Forecast, by Application 2020 & 2033
- Table 16: Global Electric Bus Charging Infrastructure Market Revenue Million Forecast, by Charging Type 2020 & 2033
- Table 17: Global Electric Bus Charging Infrastructure Market Revenue Million Forecast, by Country 2020 & 2033
- Table 18: China Electric Bus Charging Infrastructure Market Revenue (Million) Forecast, by Application 2020 & 2033
- Table 19: India Electric Bus Charging Infrastructure Market Revenue (Million) Forecast, by Application 2020 & 2033
- Table 20: Japan Electric Bus Charging Infrastructure Market Revenue (Million) Forecast, by Application 2020 & 2033
- Table 21: South Korea Electric Bus Charging Infrastructure Market Revenue (Million) Forecast, by Application 2020 & 2033
- Table 22: Rest of Asia Pacific Electric Bus Charging Infrastructure Market Revenue (Million) Forecast, by Application 2020 & 2033
- Table 23: Global Electric Bus Charging Infrastructure Market Revenue Million Forecast, by Charging Type 2020 & 2033
- Table 24: Global Electric Bus Charging Infrastructure Market Revenue Million Forecast, by Country 2020 & 2033
- Table 25: South America Electric Bus Charging Infrastructure Market Revenue (Million) Forecast, by Application 2020 & 2033
- Table 26: Middle East and Africa Electric Bus Charging Infrastructure Market Revenue (Million) Forecast, by Application 2020 & 2033
Frequently Asked Questions
1. What is the projected Compound Annual Growth Rate (CAGR) of the Electric Bus Charging Infrastructure Market?
The projected CAGR is approximately 19.00%.
2. Which companies are prominent players in the Electric Bus Charging Infrastructure Market?
Key companies in the market include 10 Starline Holdings LLC, Electric Bus Manufacturers, 2 Proterra Inc (also an electric bus manufacturer), 11 EV Solutions (Webasto), 4 AB Volvo, 3 ChargePoint Inc, 1 BYD Auto Co Ltd, 1 ABB Ltd, 8 Heliox Energy, 6 ALSTOM, 5 Zhengzhou Yutong Bus Co Ltd, 7 SemaConnect Inc, 2 Mercedes-Benz AG, 3 Traton SE, 4 Siemens AG, 7 NFI Group Inc, 5 Schneider Electric SE, 6 IVECO S p A, 9 Vital EV Solutions, Electric Charging Infrastructure Suppliers.
3. What are the main segments of the Electric Bus Charging Infrastructure Market?
The market segments include Charging Type.
4. Can you provide details about the market size?
The market size is estimated to be USD 2 Million as of 2022.
5. What are some drivers contributing to market growth?
Rising Adoption of Electric Buses.
6. What are the notable trends driving market growth?
Governmental Efforts to Increase in the Number of Electric Buses Will Boost Overhead Charging Type.
7. Are there any restraints impacting market growth?
High Upfront Investment.
8. Can you provide examples of recent developments in the market?
November 2022: ABB E-Mobility, the electric vehicle charging solutions subsidiary of ABB Ltd., successfully raised CHF 200 million (USD 214 million) in a pre-IPO private placement led by a group of minority investors. The capital infusion will play a crucial role in supporting the company's growth strategy, which includes pursuing both organic and inorganic opportunities, such as potential mergers and acquisitions. The transaction is expected to be finalized in the fourth quarter of 2022.
9. What pricing options are available for accessing the report?
Pricing options include single-user, multi-user, and enterprise licenses priced at USD 4750, USD 5250, and USD 8750 respectively.
10. Is the market size provided in terms of value or volume?
The market size is provided in terms of value, measured in Million.
11. Are there any specific market keywords associated with the report?
Yes, the market keyword associated with the report is "Electric Bus Charging Infrastructure Market," which aids in identifying and referencing the specific market segment covered.
12. How do I determine which pricing option suits my needs best?
The pricing options vary based on user requirements and access needs. Individual users may opt for single-user licenses, while businesses requiring broader access may choose multi-user or enterprise licenses for cost-effective access to the report.
13. Are there any additional resources or data provided in the Electric Bus Charging Infrastructure Market report?
While the report offers comprehensive insights, it's advisable to review the specific contents or supplementary materials provided to ascertain if additional resources or data are available.
14. How can I stay updated on further developments or reports in the Electric Bus Charging Infrastructure Market?
To stay informed about further developments, trends, and reports in the Electric Bus Charging Infrastructure Market, consider subscribing to industry newsletters, following relevant companies and organizations, or regularly checking reputable industry news sources and publications.
Methodology
Step 1 - Identification of Relevant Samples Size from Population Database


Step 2 - Approaches for Defining Global Market Size (Value, Volume* & Price*)

Note*: In applicable scenarios
Step 3 - Data Sources
Primary Research
- Web Analytics
- Survey Reports
- Research Institute
- Latest Research Reports
- Opinion Leaders
Secondary Research
- Annual Reports
- White Paper
- Latest Press Release
- Industry Association
- Paid Database
- Investor Presentations

Step 4 - Data Triangulation
Involves using different sources of information in order to increase the validity of a study
These sources are likely to be stakeholders in a program - participants, other researchers, program staff, other community members, and so on.
Then we put all data in single framework & apply various statistical tools to find out the dynamic on the market.
During the analysis stage, feedback from the stakeholder groups would be compared to determine areas of agreement as well as areas of divergence