
Key Insights
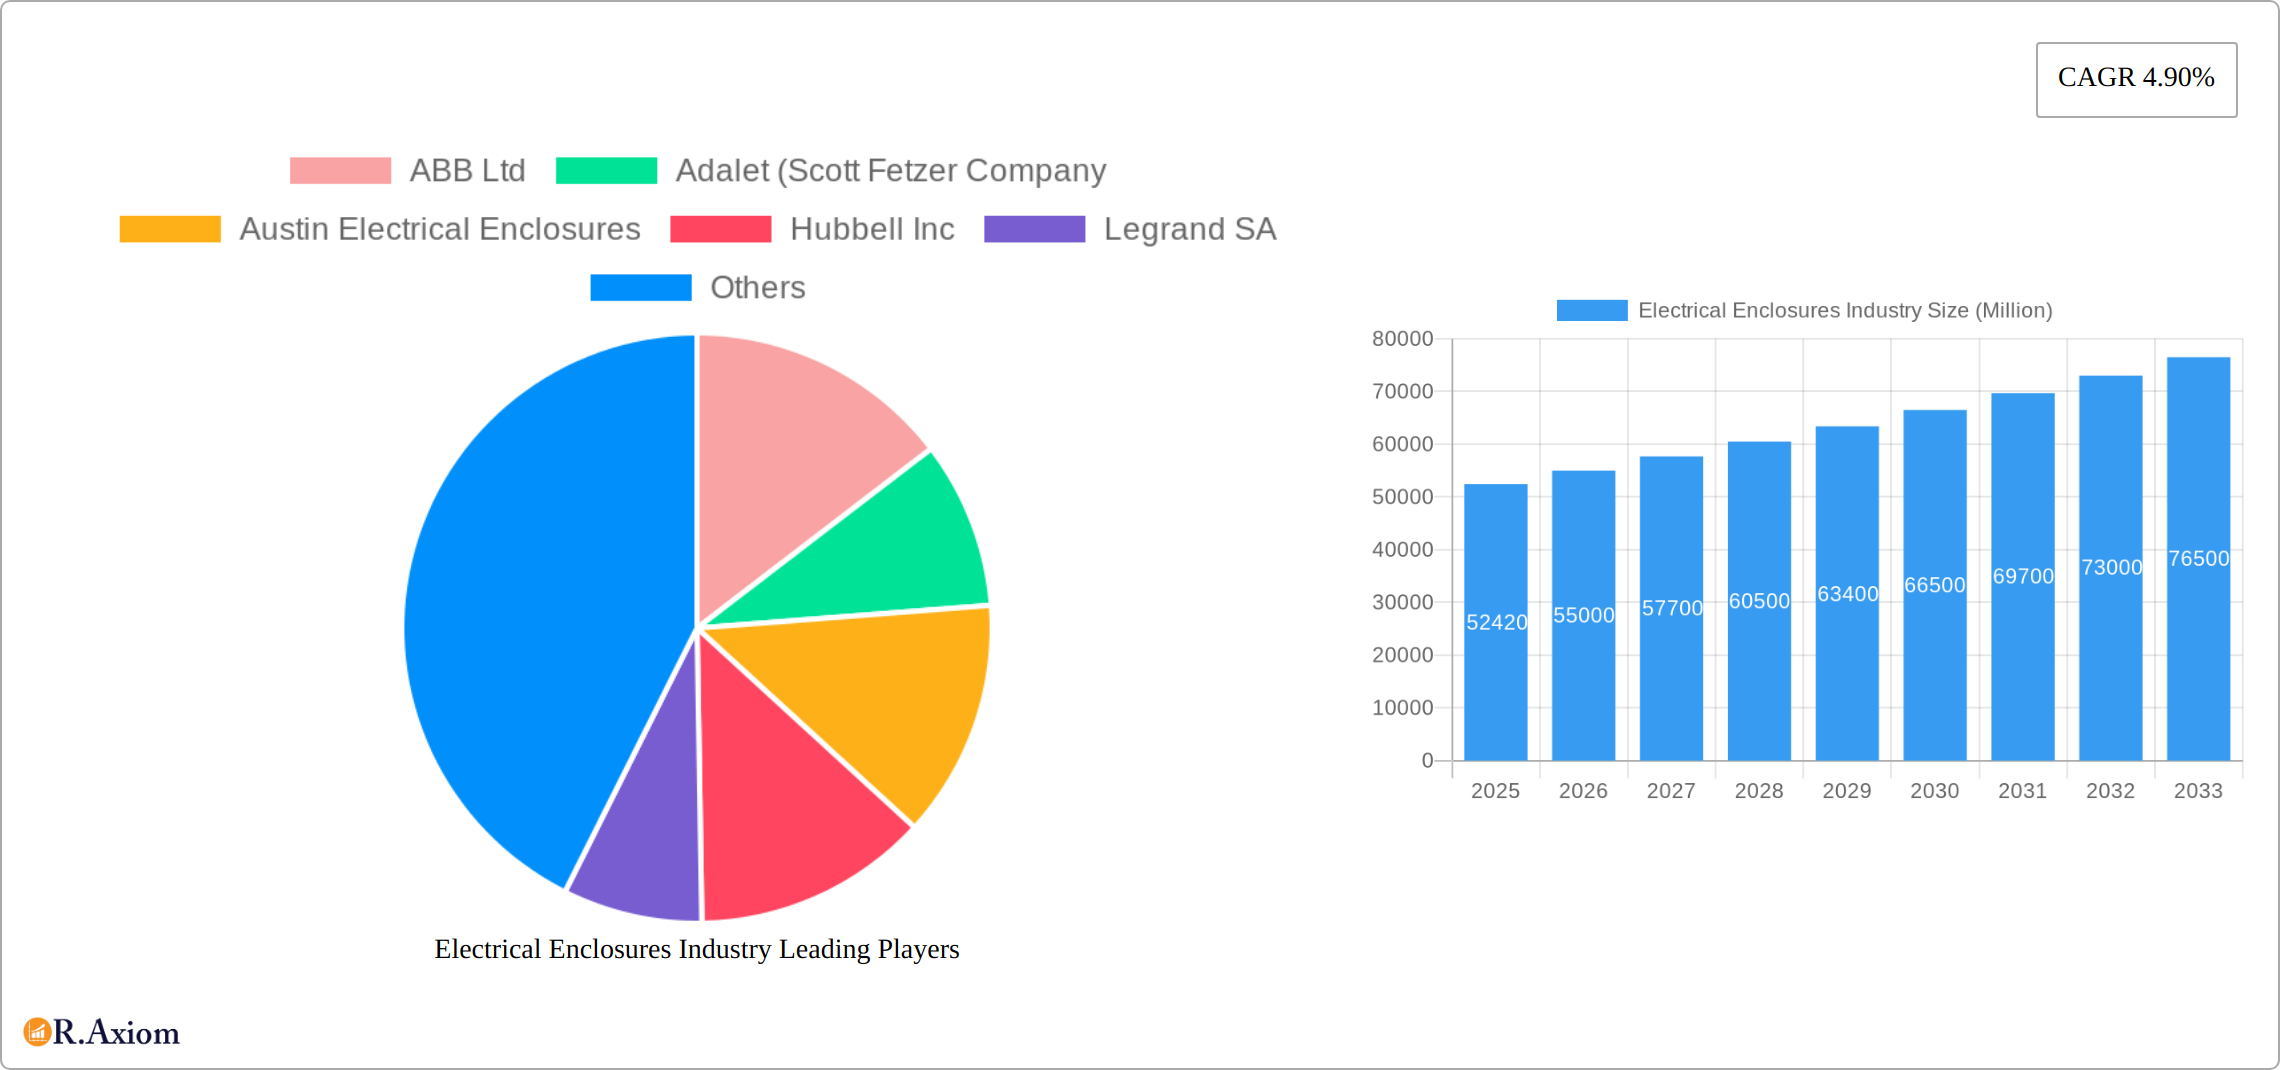
The global electrical enclosures market, valued at $52.42 billion in 2025, is projected to experience robust growth, exhibiting a compound annual growth rate (CAGR) of 4.90% from 2025 to 2033. This expansion is driven primarily by the burgeoning energy and power sector, necessitating robust and reliable enclosure solutions for power generation, transmission, and distribution infrastructure. The increasing automation across industrial sectors, particularly in automotive manufacturing and process industries, further fuels market demand. Growth is also supported by the expansion of telecommunication networks and infrastructure projects globally, requiring advanced electrical enclosures for protecting sensitive equipment. The preference for metallic enclosures due to their superior durability and protection against harsh environmental conditions continues to dominate the material segment. However, the non-metallic segment is gaining traction due to its lightweight nature and cost-effectiveness in specific applications. Geographic expansion is another key factor, with North America and Europe currently holding significant market shares, while Asia-Pacific, particularly China and India, presents substantial growth opportunities due to rapid industrialization and infrastructure development. While the market faces restraints such as fluctuating raw material prices and potential supply chain disruptions, the long-term outlook remains optimistic, driven by ongoing technological advancements and the increasing demand for smart and energy-efficient infrastructure.
The competitive landscape is characterized by a mix of established global players and regional manufacturers. Key players such as ABB Ltd., Siemens AG, Schneider Electric SE, and Rittal GmbH & Co. KG are investing heavily in research and development to enhance their product portfolios and expand their global reach. Strategic partnerships, acquisitions, and product innovations are vital strategies adopted by market participants to maintain a competitive edge. The market is also witnessing the rise of customized enclosure solutions tailored to specific industry needs, reflecting the increasing focus on operational efficiency and safety standards. This trend towards customization is particularly pronounced in the energy and power sector, where specialized enclosures are required to handle high voltage and extreme environmental conditions. The continued growth in renewable energy and the push for sustainable practices further contributes to the positive trajectory of this market.
This comprehensive report provides a detailed analysis of the global electrical enclosures industry, covering market size, segmentation, key players, trends, and future outlook. The study period spans from 2019 to 2033, with 2025 serving as the base and estimated year. The forecast period is 2025-2033, and the historical period is 2019-2024. The report offers actionable insights for industry stakeholders, including manufacturers, distributors, investors, and researchers. The market is valued at xx Million in 2025 and is projected to reach xx Million by 2033.
Electrical Enclosures Industry Market Concentration & Innovation
This section analyzes the competitive landscape of the electrical enclosures market, focusing on market concentration, innovation drivers, regulatory frameworks, product substitutes, end-user trends, and mergers and acquisitions (M&A) activities. The global electrical enclosures market exhibits a moderately concentrated structure, with key players like ABB Ltd, Siemens AG, Schneider Electric SE, and Rittal GmbH & Co Kg holding significant market share. However, the presence of numerous smaller players fosters competition and innovation.
The industry is driven by innovations in materials, designs, and smart technologies. The increasing adoption of IoT and Industry 4.0 technologies is fueling demand for intelligent enclosures with integrated sensors and communication capabilities. Stringent safety and environmental regulations are shaping product development, pushing manufacturers to adopt sustainable materials and energy-efficient designs. The rising adoption of renewable energy sources, particularly solar and wind power, is a significant growth driver, as these applications necessitate robust and reliable electrical enclosures.
Substitute products such as fiber optic enclosures present a competitive challenge, but the dominance of traditional metallic enclosures is expected to persist due to cost-effectiveness and familiarity. End-user trends such as the shift towards automation in manufacturing and increased adoption of smart grids are significantly impacting market demand. M&A activities have been relatively frequent in recent years, with deal values exceeding xx Million in the past five years. This consolidation aims to expand market reach, enhance technological capabilities, and optimize production processes.
- Market Share: Top 5 players hold approximately 55% of the global market share (estimated).
- M&A Deal Values: Over xx Million in the past five years (estimated).
- Key Innovation Drivers: IoT integration, Industry 4.0, sustainability concerns, renewable energy growth.
Electrical Enclosures Industry Industry Trends & Insights
The global electrical enclosures market is experiencing robust growth, driven by several key factors. The rising demand for electricity across various sectors, including energy and power, industrial manufacturing, and infrastructure development, is a primary driver. Technological advancements, such as the development of lightweight and high-strength materials, are improving product performance and efficiency. Moreover, increasing automation in manufacturing processes is boosting demand for specialized enclosures suitable for diverse industrial applications. Consumer preferences are shifting towards energy-efficient, compact, and aesthetically pleasing enclosures.
The market is witnessing technological disruptions, including the adoption of advanced manufacturing techniques such as 3D printing and the integration of smart technologies, leading to the development of intelligent enclosures capable of real-time monitoring and data analysis. The competitive dynamics are intensifying, with major players focusing on product innovation, strategic partnerships, and expansion into new markets. The market is experiencing a Compound Annual Growth Rate (CAGR) of xx% during the forecast period (2025-2033), with market penetration increasing across key end-user industries. This growth reflects the rising global demand for electrical infrastructure and the increasing adoption of automation technologies.

Dominant Markets & Segments in Electrical Enclosures Industry
The Asia Pacific region dominates the global electrical enclosures market, driven by rapid industrialization, infrastructure development, and rising investments in renewable energy projects. China and India, in particular, are major growth hubs.
By Material:
- Metallic Enclosures: Metallic enclosures remain dominant due to their durability and cost-effectiveness.
- Non-metallic Enclosures: The non-metallic segment is experiencing moderate growth, driven by increased demand for lightweight and corrosion-resistant solutions. Key drivers include the use of advanced polymers and composites offering higher strength-to-weight ratios.
By End-user Industry:
- Energy and Power: This segment is a major driver, fueled by expanding power grids and renewable energy projects.
- Industrial (Automotive and Manufacturing): The industrial segment is significant due to automation and increased production volumes.
- Process Industries: Demand is driven by process control and automation systems in chemical, oil, and gas industries.
- Other End-user Industries (Transportation, Infrastructure, and Telecommunication): These sectors exhibit consistent growth driven by infrastructure development and digitalization.
Electrical Enclosures Industry Product Developments
Recent product innovations focus on lightweight, high-strength materials such as carbon fiber-reinforced thermoplastics (CFRTP) and improved environmental protection to meet stringent regulatory requirements. Smart enclosures with integrated sensors and communication capabilities are gaining traction, offering advanced monitoring and control features. These developments enhance product reliability, improve operational efficiency, and offer better cost-effectiveness. The market fit of these new products is excellent, driven by industrial automation and the rise of smart grids.
Report Scope & Segmentation Analysis
This report segments the electrical enclosures market by material (metallic and non-metallic) and end-user industry (energy and power, industrial, process industries, and other end-user industries). Each segment's market size, growth projections, and competitive dynamics are analyzed in detail. Metallic enclosures are projected to maintain the largest market share due to their cost-effectiveness and reliability. However, the non-metallic segment is expected to witness faster growth owing to the rising demand for lightweight, corrosion-resistant, and aesthetically pleasing enclosures. The energy and power segment is expected to be the largest end-user sector, driven by renewable energy expansion and grid modernization.
Key Drivers of Electrical Enclosures Industry Growth
Several factors contribute to the market's growth. The expansion of renewable energy infrastructure is creating significant demand for specialized enclosures. Government initiatives promoting energy efficiency and automation are fostering market growth. Economic growth in emerging economies is also driving demand for electrical enclosures across various sectors. The industrial automation boom in numerous sectors boosts the need for specialized enclosures.
Challenges in the Electrical Enclosures Industry Sector
The industry faces challenges such as fluctuating raw material prices, intense competition, and stringent environmental regulations. Supply chain disruptions due to geopolitical events can impact production and delivery schedules. Economic downturns can lead to reduced investment in infrastructure projects, affecting demand. The availability of skilled labor is also a challenge affecting overall production and timelines.
Emerging Opportunities in Electrical Enclosures Industry
The industry presents opportunities in the development of smart enclosures with advanced features like integrated sensors, data analytics, and remote monitoring. The growth of electric vehicles (EVs) is driving demand for specialized enclosures in charging stations. Expansion into new markets such as the developing economies of Africa and South America presents significant growth potential. The development of lighter and more sustainable enclosures presents opportunities for the industry.
Leading Players in the Electrical Enclosures Industry Market
- ABB Ltd
- Adalet (Scott Fetzer Company)
- Austin Electrical Enclosures
- Hubbell Inc
- Legrand SA
- Emerson Electric Co
- Eldon Holding AB
- Siemens AG
- Schneider Electric SE
- Rittal GmbH & Co Kg
- AZZ Inc
- Pentair PLC
- Eaton Corporation
Key Developments in Electrical Enclosures Industry Industry
- Oct 2022: Tri-Mack Plastics Manufacturing Corp announced a lightweight, high-strength enclosure made from unidirectional (UD) carbon fiber-reinforced thermoplastic (CFRTP) tape. This development signifies a shift towards lighter and more durable enclosures.
- Feb 2022: Siemens, in partnership with Nexii Building Solutions, launched a sustainable EV charging concept structure (VersiCharge XL), highlighting the increasing focus on sustainable solutions in the industry. This reflects the growing demand for electric vehicle charging infrastructure.
Strategic Outlook for Electrical Enclosures Industry Market
The electrical enclosures market is poised for continued growth, driven by technological advancements, increasing automation, and the expansion of renewable energy. The focus on sustainability, lightweight designs, and smart technologies will shape future product development. The industry will continue to witness consolidation through mergers and acquisitions, leading to a more concentrated market structure. Growth in developing economies and the expansion of electric vehicle charging infrastructure present significant opportunities for market expansion.
Electrical Enclosures Industry Segmentation
-
1. Material
- 1.1. Metallic
- 1.2. Non-metallic
-
2. End-user Industry
- 2.1. Energy and Power
- 2.2. Industrial (Automotive and Manufacturing)
- 2.3. Process Industries
- 2.4. Other En
Electrical Enclosures Industry Segmentation By Geography
-
1. North America
- 1.1. United States
- 1.2. Canada
-
2. Europe
- 2.1. United Kingdom
- 2.2. Germany
-
3. Asia
- 3.1. China
- 3.2. India
- 3.3. Japan
- 4. Australia and New Zealand
- 5. Latin America
- 6. Middle East and Africa

Electrical Enclosures Industry REPORT HIGHLIGHTS
| Aspects | Details |
|---|---|
| Study Period | 2019-2033 |
| Base Year | 2024 |
| Estimated Year | 2025 |
| Forecast Period | 2025-2033 |
| Historical Period | 2019-2024 |
| Growth Rate | CAGR of 4.90% from 2019-2033 |
| Segmentation |
|
Table of Contents
- 1. Introduction
- 1.1. Research Scope
- 1.2. Market Segmentation
- 1.3. Research Methodology
- 1.4. Definitions and Assumptions
- 2. Executive Summary
- 2.1. Introduction
- 3. Market Dynamics
- 3.1. Introduction
- 3.2. Market Drivers
- 3.2.1. Growing Power Infrastructure Developments; Rising Adoption of Industrial Automation
- 3.3. Market Restrains
- 3.3.1. Quality and Safety Concerns
- 3.4. Market Trends
- 3.4.1. Energy and Power End-User Industry to Hold a Significant Share
- 4. Market Factor Analysis
- 4.1. Porters Five Forces
- 4.2. Supply/Value Chain
- 4.3. PESTEL analysis
- 4.4. Market Entropy
- 4.5. Patent/Trademark Analysis
- 5. Global Electrical Enclosures Industry Analysis, Insights and Forecast, 2019-2031
- 5.1. Market Analysis, Insights and Forecast - by Material
- 5.1.1. Metallic
- 5.1.2. Non-metallic
- 5.2. Market Analysis, Insights and Forecast - by End-user Industry
- 5.2.1. Energy and Power
- 5.2.2. Industrial (Automotive and Manufacturing)
- 5.2.3. Process Industries
- 5.2.4. Other En
- 5.3. Market Analysis, Insights and Forecast - by Region
- 5.3.1. North America
- 5.3.2. Europe
- 5.3.3. Asia
- 5.3.4. Australia and New Zealand
- 5.3.5. Latin America
- 5.3.6. Middle East and Africa
- 5.1. Market Analysis, Insights and Forecast - by Material
- 6. North America Electrical Enclosures Industry Analysis, Insights and Forecast, 2019-2031
- 6.1. Market Analysis, Insights and Forecast - by Material
- 6.1.1. Metallic
- 6.1.2. Non-metallic
- 6.2. Market Analysis, Insights and Forecast - by End-user Industry
- 6.2.1. Energy and Power
- 6.2.2. Industrial (Automotive and Manufacturing)
- 6.2.3. Process Industries
- 6.2.4. Other En
- 6.1. Market Analysis, Insights and Forecast - by Material
- 7. Europe Electrical Enclosures Industry Analysis, Insights and Forecast, 2019-2031
- 7.1. Market Analysis, Insights and Forecast - by Material
- 7.1.1. Metallic
- 7.1.2. Non-metallic
- 7.2. Market Analysis, Insights and Forecast - by End-user Industry
- 7.2.1. Energy and Power
- 7.2.2. Industrial (Automotive and Manufacturing)
- 7.2.3. Process Industries
- 7.2.4. Other En
- 7.1. Market Analysis, Insights and Forecast - by Material
- 8. Asia Electrical Enclosures Industry Analysis, Insights and Forecast, 2019-2031
- 8.1. Market Analysis, Insights and Forecast - by Material
- 8.1.1. Metallic
- 8.1.2. Non-metallic
- 8.2. Market Analysis, Insights and Forecast - by End-user Industry
- 8.2.1. Energy and Power
- 8.2.2. Industrial (Automotive and Manufacturing)
- 8.2.3. Process Industries
- 8.2.4. Other En
- 8.1. Market Analysis, Insights and Forecast - by Material
- 9. Australia and New Zealand Electrical Enclosures Industry Analysis, Insights and Forecast, 2019-2031
- 9.1. Market Analysis, Insights and Forecast - by Material
- 9.1.1. Metallic
- 9.1.2. Non-metallic
- 9.2. Market Analysis, Insights and Forecast - by End-user Industry
- 9.2.1. Energy and Power
- 9.2.2. Industrial (Automotive and Manufacturing)
- 9.2.3. Process Industries
- 9.2.4. Other En
- 9.1. Market Analysis, Insights and Forecast - by Material
- 10. Latin America Electrical Enclosures Industry Analysis, Insights and Forecast, 2019-2031
- 10.1. Market Analysis, Insights and Forecast - by Material
- 10.1.1. Metallic
- 10.1.2. Non-metallic
- 10.2. Market Analysis, Insights and Forecast - by End-user Industry
- 10.2.1. Energy and Power
- 10.2.2. Industrial (Automotive and Manufacturing)
- 10.2.3. Process Industries
- 10.2.4. Other En
- 10.1. Market Analysis, Insights and Forecast - by Material
- 11. Middle East and Africa Electrical Enclosures Industry Analysis, Insights and Forecast, 2019-2031
- 11.1. Market Analysis, Insights and Forecast - by Material
- 11.1.1. Metallic
- 11.1.2. Non-metallic
- 11.2. Market Analysis, Insights and Forecast - by End-user Industry
- 11.2.1. Energy and Power
- 11.2.2. Industrial (Automotive and Manufacturing)
- 11.2.3. Process Industries
- 11.2.4. Other En
- 11.1. Market Analysis, Insights and Forecast - by Material
- 12. North America Electrical Enclosures Industry Analysis, Insights and Forecast, 2019-2031
- 12.1. Market Analysis, Insights and Forecast - By Country/Sub-region
- 12.1.1 United States
- 12.1.2 Canada
- 13. Europe Electrical Enclosures Industry Analysis, Insights and Forecast, 2019-2031
- 13.1. Market Analysis, Insights and Forecast - By Country/Sub-region
- 13.1.1 United Kingdom
- 13.1.2 Germany
- 14. Asia Electrical Enclosures Industry Analysis, Insights and Forecast, 2019-2031
- 14.1. Market Analysis, Insights and Forecast - By Country/Sub-region
- 14.1.1 China
- 14.1.2 India
- 14.1.3 Japan
- 15. Australia and New Zealand Electrical Enclosures Industry Analysis, Insights and Forecast, 2019-2031
- 15.1. Market Analysis, Insights and Forecast - By Country/Sub-region
- 15.1.1.
- 16. Latin America Electrical Enclosures Industry Analysis, Insights and Forecast, 2019-2031
- 16.1. Market Analysis, Insights and Forecast - By Country/Sub-region
- 16.1.1.
- 17. Middle East and Africa Electrical Enclosures Industry Analysis, Insights and Forecast, 2019-2031
- 17.1. Market Analysis, Insights and Forecast - By Country/Sub-region
- 17.1.1.
- 18. Competitive Analysis
- 18.1. Global Market Share Analysis 2024
- 18.2. Company Profiles
- 18.2.1 ABB Ltd
- 18.2.1.1. Overview
- 18.2.1.2. Products
- 18.2.1.3. SWOT Analysis
- 18.2.1.4. Recent Developments
- 18.2.1.5. Financials (Based on Availability)
- 18.2.2 Adalet (Scott Fetzer Company
- 18.2.2.1. Overview
- 18.2.2.2. Products
- 18.2.2.3. SWOT Analysis
- 18.2.2.4. Recent Developments
- 18.2.2.5. Financials (Based on Availability)
- 18.2.3 Austin Electrical Enclosures
- 18.2.3.1. Overview
- 18.2.3.2. Products
- 18.2.3.3. SWOT Analysis
- 18.2.3.4. Recent Developments
- 18.2.3.5. Financials (Based on Availability)
- 18.2.4 Hubbell Inc
- 18.2.4.1. Overview
- 18.2.4.2. Products
- 18.2.4.3. SWOT Analysis
- 18.2.4.4. Recent Developments
- 18.2.4.5. Financials (Based on Availability)
- 18.2.5 Legrand SA
- 18.2.5.1. Overview
- 18.2.5.2. Products
- 18.2.5.3. SWOT Analysis
- 18.2.5.4. Recent Developments
- 18.2.5.5. Financials (Based on Availability)
- 18.2.6 Emerson Electric Co
- 18.2.6.1. Overview
- 18.2.6.2. Products
- 18.2.6.3. SWOT Analysis
- 18.2.6.4. Recent Developments
- 18.2.6.5. Financials (Based on Availability)
- 18.2.7 Eldon Holding AB
- 18.2.7.1. Overview
- 18.2.7.2. Products
- 18.2.7.3. SWOT Analysis
- 18.2.7.4. Recent Developments
- 18.2.7.5. Financials (Based on Availability)
- 18.2.8 Siemens AG
- 18.2.8.1. Overview
- 18.2.8.2. Products
- 18.2.8.3. SWOT Analysis
- 18.2.8.4. Recent Developments
- 18.2.8.5. Financials (Based on Availability)
- 18.2.9 Schneider Electric SE
- 18.2.9.1. Overview
- 18.2.9.2. Products
- 18.2.9.3. SWOT Analysis
- 18.2.9.4. Recent Developments
- 18.2.9.5. Financials (Based on Availability)
- 18.2.10 Rittal GmbH & Co Kg
- 18.2.10.1. Overview
- 18.2.10.2. Products
- 18.2.10.3. SWOT Analysis
- 18.2.10.4. Recent Developments
- 18.2.10.5. Financials (Based on Availability)
- 18.2.11 AZZ Inc
- 18.2.11.1. Overview
- 18.2.11.2. Products
- 18.2.11.3. SWOT Analysis
- 18.2.11.4. Recent Developments
- 18.2.11.5. Financials (Based on Availability)
- 18.2.12 Pentair PLC
- 18.2.12.1. Overview
- 18.2.12.2. Products
- 18.2.12.3. SWOT Analysis
- 18.2.12.4. Recent Developments
- 18.2.12.5. Financials (Based on Availability)
- 18.2.13 Eaton Corporation
- 18.2.13.1. Overview
- 18.2.13.2. Products
- 18.2.13.3. SWOT Analysis
- 18.2.13.4. Recent Developments
- 18.2.13.5. Financials (Based on Availability)
- 18.2.1 ABB Ltd
List of Figures
- Figure 1: Global Electrical Enclosures Industry Revenue Breakdown (Million, %) by Region 2024 & 2032
- Figure 2: North America Electrical Enclosures Industry Revenue (Million), by Country 2024 & 2032
- Figure 3: North America Electrical Enclosures Industry Revenue Share (%), by Country 2024 & 2032
- Figure 4: Europe Electrical Enclosures Industry Revenue (Million), by Country 2024 & 2032
- Figure 5: Europe Electrical Enclosures Industry Revenue Share (%), by Country 2024 & 2032
- Figure 6: Asia Electrical Enclosures Industry Revenue (Million), by Country 2024 & 2032
- Figure 7: Asia Electrical Enclosures Industry Revenue Share (%), by Country 2024 & 2032
- Figure 8: Australia and New Zealand Electrical Enclosures Industry Revenue (Million), by Country 2024 & 2032
- Figure 9: Australia and New Zealand Electrical Enclosures Industry Revenue Share (%), by Country 2024 & 2032
- Figure 10: Latin America Electrical Enclosures Industry Revenue (Million), by Country 2024 & 2032
- Figure 11: Latin America Electrical Enclosures Industry Revenue Share (%), by Country 2024 & 2032
- Figure 12: Middle East and Africa Electrical Enclosures Industry Revenue (Million), by Country 2024 & 2032
- Figure 13: Middle East and Africa Electrical Enclosures Industry Revenue Share (%), by Country 2024 & 2032
- Figure 14: North America Electrical Enclosures Industry Revenue (Million), by Material 2024 & 2032
- Figure 15: North America Electrical Enclosures Industry Revenue Share (%), by Material 2024 & 2032
- Figure 16: North America Electrical Enclosures Industry Revenue (Million), by End-user Industry 2024 & 2032
- Figure 17: North America Electrical Enclosures Industry Revenue Share (%), by End-user Industry 2024 & 2032
- Figure 18: North America Electrical Enclosures Industry Revenue (Million), by Country 2024 & 2032
- Figure 19: North America Electrical Enclosures Industry Revenue Share (%), by Country 2024 & 2032
- Figure 20: Europe Electrical Enclosures Industry Revenue (Million), by Material 2024 & 2032
- Figure 21: Europe Electrical Enclosures Industry Revenue Share (%), by Material 2024 & 2032
- Figure 22: Europe Electrical Enclosures Industry Revenue (Million), by End-user Industry 2024 & 2032
- Figure 23: Europe Electrical Enclosures Industry Revenue Share (%), by End-user Industry 2024 & 2032
- Figure 24: Europe Electrical Enclosures Industry Revenue (Million), by Country 2024 & 2032
- Figure 25: Europe Electrical Enclosures Industry Revenue Share (%), by Country 2024 & 2032
- Figure 26: Asia Electrical Enclosures Industry Revenue (Million), by Material 2024 & 2032
- Figure 27: Asia Electrical Enclosures Industry Revenue Share (%), by Material 2024 & 2032
- Figure 28: Asia Electrical Enclosures Industry Revenue (Million), by End-user Industry 2024 & 2032
- Figure 29: Asia Electrical Enclosures Industry Revenue Share (%), by End-user Industry 2024 & 2032
- Figure 30: Asia Electrical Enclosures Industry Revenue (Million), by Country 2024 & 2032
- Figure 31: Asia Electrical Enclosures Industry Revenue Share (%), by Country 2024 & 2032
- Figure 32: Australia and New Zealand Electrical Enclosures Industry Revenue (Million), by Material 2024 & 2032
- Figure 33: Australia and New Zealand Electrical Enclosures Industry Revenue Share (%), by Material 2024 & 2032
- Figure 34: Australia and New Zealand Electrical Enclosures Industry Revenue (Million), by End-user Industry 2024 & 2032
- Figure 35: Australia and New Zealand Electrical Enclosures Industry Revenue Share (%), by End-user Industry 2024 & 2032
- Figure 36: Australia and New Zealand Electrical Enclosures Industry Revenue (Million), by Country 2024 & 2032
- Figure 37: Australia and New Zealand Electrical Enclosures Industry Revenue Share (%), by Country 2024 & 2032
- Figure 38: Latin America Electrical Enclosures Industry Revenue (Million), by Material 2024 & 2032
- Figure 39: Latin America Electrical Enclosures Industry Revenue Share (%), by Material 2024 & 2032
- Figure 40: Latin America Electrical Enclosures Industry Revenue (Million), by End-user Industry 2024 & 2032
- Figure 41: Latin America Electrical Enclosures Industry Revenue Share (%), by End-user Industry 2024 & 2032
- Figure 42: Latin America Electrical Enclosures Industry Revenue (Million), by Country 2024 & 2032
- Figure 43: Latin America Electrical Enclosures Industry Revenue Share (%), by Country 2024 & 2032
- Figure 44: Middle East and Africa Electrical Enclosures Industry Revenue (Million), by Material 2024 & 2032
- Figure 45: Middle East and Africa Electrical Enclosures Industry Revenue Share (%), by Material 2024 & 2032
- Figure 46: Middle East and Africa Electrical Enclosures Industry Revenue (Million), by End-user Industry 2024 & 2032
- Figure 47: Middle East and Africa Electrical Enclosures Industry Revenue Share (%), by End-user Industry 2024 & 2032
- Figure 48: Middle East and Africa Electrical Enclosures Industry Revenue (Million), by Country 2024 & 2032
- Figure 49: Middle East and Africa Electrical Enclosures Industry Revenue Share (%), by Country 2024 & 2032
List of Tables
- Table 1: Global Electrical Enclosures Industry Revenue Million Forecast, by Region 2019 & 2032
- Table 2: Global Electrical Enclosures Industry Revenue Million Forecast, by Material 2019 & 2032
- Table 3: Global Electrical Enclosures Industry Revenue Million Forecast, by End-user Industry 2019 & 2032
- Table 4: Global Electrical Enclosures Industry Revenue Million Forecast, by Region 2019 & 2032
- Table 5: Global Electrical Enclosures Industry Revenue Million Forecast, by Country 2019 & 2032
- Table 6: United States Electrical Enclosures Industry Revenue (Million) Forecast, by Application 2019 & 2032
- Table 7: Canada Electrical Enclosures Industry Revenue (Million) Forecast, by Application 2019 & 2032
- Table 8: Global Electrical Enclosures Industry Revenue Million Forecast, by Country 2019 & 2032
- Table 9: United Kingdom Electrical Enclosures Industry Revenue (Million) Forecast, by Application 2019 & 2032
- Table 10: Germany Electrical Enclosures Industry Revenue (Million) Forecast, by Application 2019 & 2032
- Table 11: Global Electrical Enclosures Industry Revenue Million Forecast, by Country 2019 & 2032
- Table 12: China Electrical Enclosures Industry Revenue (Million) Forecast, by Application 2019 & 2032
- Table 13: India Electrical Enclosures Industry Revenue (Million) Forecast, by Application 2019 & 2032
- Table 14: Japan Electrical Enclosures Industry Revenue (Million) Forecast, by Application 2019 & 2032
- Table 15: Global Electrical Enclosures Industry Revenue Million Forecast, by Country 2019 & 2032
- Table 16: Electrical Enclosures Industry Revenue (Million) Forecast, by Application 2019 & 2032
- Table 17: Global Electrical Enclosures Industry Revenue Million Forecast, by Country 2019 & 2032
- Table 18: Electrical Enclosures Industry Revenue (Million) Forecast, by Application 2019 & 2032
- Table 19: Global Electrical Enclosures Industry Revenue Million Forecast, by Country 2019 & 2032
- Table 20: Electrical Enclosures Industry Revenue (Million) Forecast, by Application 2019 & 2032
- Table 21: Global Electrical Enclosures Industry Revenue Million Forecast, by Material 2019 & 2032
- Table 22: Global Electrical Enclosures Industry Revenue Million Forecast, by End-user Industry 2019 & 2032
- Table 23: Global Electrical Enclosures Industry Revenue Million Forecast, by Country 2019 & 2032
- Table 24: United States Electrical Enclosures Industry Revenue (Million) Forecast, by Application 2019 & 2032
- Table 25: Canada Electrical Enclosures Industry Revenue (Million) Forecast, by Application 2019 & 2032
- Table 26: Global Electrical Enclosures Industry Revenue Million Forecast, by Material 2019 & 2032
- Table 27: Global Electrical Enclosures Industry Revenue Million Forecast, by End-user Industry 2019 & 2032
- Table 28: Global Electrical Enclosures Industry Revenue Million Forecast, by Country 2019 & 2032
- Table 29: United Kingdom Electrical Enclosures Industry Revenue (Million) Forecast, by Application 2019 & 2032
- Table 30: Germany Electrical Enclosures Industry Revenue (Million) Forecast, by Application 2019 & 2032
- Table 31: Global Electrical Enclosures Industry Revenue Million Forecast, by Material 2019 & 2032
- Table 32: Global Electrical Enclosures Industry Revenue Million Forecast, by End-user Industry 2019 & 2032
- Table 33: Global Electrical Enclosures Industry Revenue Million Forecast, by Country 2019 & 2032
- Table 34: China Electrical Enclosures Industry Revenue (Million) Forecast, by Application 2019 & 2032
- Table 35: India Electrical Enclosures Industry Revenue (Million) Forecast, by Application 2019 & 2032
- Table 36: Japan Electrical Enclosures Industry Revenue (Million) Forecast, by Application 2019 & 2032
- Table 37: Global Electrical Enclosures Industry Revenue Million Forecast, by Material 2019 & 2032
- Table 38: Global Electrical Enclosures Industry Revenue Million Forecast, by End-user Industry 2019 & 2032
- Table 39: Global Electrical Enclosures Industry Revenue Million Forecast, by Country 2019 & 2032
- Table 40: Global Electrical Enclosures Industry Revenue Million Forecast, by Material 2019 & 2032
- Table 41: Global Electrical Enclosures Industry Revenue Million Forecast, by End-user Industry 2019 & 2032
- Table 42: Global Electrical Enclosures Industry Revenue Million Forecast, by Country 2019 & 2032
- Table 43: Global Electrical Enclosures Industry Revenue Million Forecast, by Material 2019 & 2032
- Table 44: Global Electrical Enclosures Industry Revenue Million Forecast, by End-user Industry 2019 & 2032
- Table 45: Global Electrical Enclosures Industry Revenue Million Forecast, by Country 2019 & 2032
Frequently Asked Questions
1. What is the projected Compound Annual Growth Rate (CAGR) of the Electrical Enclosures Industry?
The projected CAGR is approximately 4.90%.
2. Which companies are prominent players in the Electrical Enclosures Industry?
Key companies in the market include ABB Ltd, Adalet (Scott Fetzer Company, Austin Electrical Enclosures, Hubbell Inc, Legrand SA, Emerson Electric Co, Eldon Holding AB, Siemens AG, Schneider Electric SE, Rittal GmbH & Co Kg, AZZ Inc, Pentair PLC, Eaton Corporation.
3. What are the main segments of the Electrical Enclosures Industry?
The market segments include Material, End-user Industry.
4. Can you provide details about the market size?
The market size is estimated to be USD 52.42 Million as of 2022.
5. What are some drivers contributing to market growth?
Growing Power Infrastructure Developments; Rising Adoption of Industrial Automation.
6. What are the notable trends driving market growth?
Energy and Power End-User Industry to Hold a Significant Share.
7. Are there any restraints impacting market growth?
Quality and Safety Concerns.
8. Can you provide examples of recent developments in the market?
Oct 2022 - Tri-Mack Plastics Manufacturing Corp, a high-performance thermoplastic parts manufacturer, announced the development of a lightweight, high-strength enclosure made from unidirectional (UD) carbon fiber-reinforced thermoplastic (CFRTP) tape and only forty-thousandths of an inch (0.40-inch) thick.
9. What pricing options are available for accessing the report?
Pricing options include single-user, multi-user, and enterprise licenses priced at USD 4750, USD 5250, and USD 8750 respectively.
10. Is the market size provided in terms of value or volume?
The market size is provided in terms of value, measured in Million.
11. Are there any specific market keywords associated with the report?
Yes, the market keyword associated with the report is "Electrical Enclosures Industry," which aids in identifying and referencing the specific market segment covered.
12. How do I determine which pricing option suits my needs best?
The pricing options vary based on user requirements and access needs. Individual users may opt for single-user licenses, while businesses requiring broader access may choose multi-user or enterprise licenses for cost-effective access to the report.
13. Are there any additional resources or data provided in the Electrical Enclosures Industry report?
While the report offers comprehensive insights, it's advisable to review the specific contents or supplementary materials provided to ascertain if additional resources or data are available.
14. How can I stay updated on further developments or reports in the Electrical Enclosures Industry?
To stay informed about further developments, trends, and reports in the Electrical Enclosures Industry, consider subscribing to industry newsletters, following relevant companies and organizations, or regularly checking reputable industry news sources and publications.
Methodology
Step 1 - Identification of Relevant Samples Size from Population Database


Step 2 - Approaches for Defining Global Market Size (Value, Volume* & Price*)

Note*: In applicable scenarios
Step 3 - Data Sources
Primary Research
- Web Analytics
- Survey Reports
- Research Institute
- Latest Research Reports
- Opinion Leaders
Secondary Research
- Annual Reports
- White Paper
- Latest Press Release
- Industry Association
- Paid Database
- Investor Presentations

Step 4 - Data Triangulation
Involves using different sources of information in order to increase the validity of a study
These sources are likely to be stakeholders in a program - participants, other researchers, program staff, other community members, and so on.
Then we put all data in single framework & apply various statistical tools to find out the dynamic on the market.
During the analysis stage, feedback from the stakeholder groups would be compared to determine areas of agreement as well as areas of divergence


