
Key Insights
The Electro-Optics (EO) Systems market is experiencing robust growth, driven by increasing defense budgets globally, advancements in sensor technology, and the rising demand for improved surveillance and targeting capabilities across defense, aerospace, and homeland security sectors. The market's Compound Annual Growth Rate (CAGR) of 4.03% from 2019-2033 indicates a steady expansion, projected to reach a significant market value. Key drivers include the miniaturization and enhanced performance of EO sensors, leading to wider adoption in unmanned aerial vehicles (UAVs) and other platforms. Furthermore, the integration of EO systems with artificial intelligence (AI) and machine learning (ML) algorithms is revolutionizing their applications in object recognition, target tracking, and situational awareness. The development of advanced thermal imaging cameras, laser rangefinders, and high-resolution imaging systems is further fueling market growth. While technological advancements are propelling the market forward, certain restraints such as high initial investment costs and the complexity of integrating these systems into existing platforms might somewhat hinder growth.
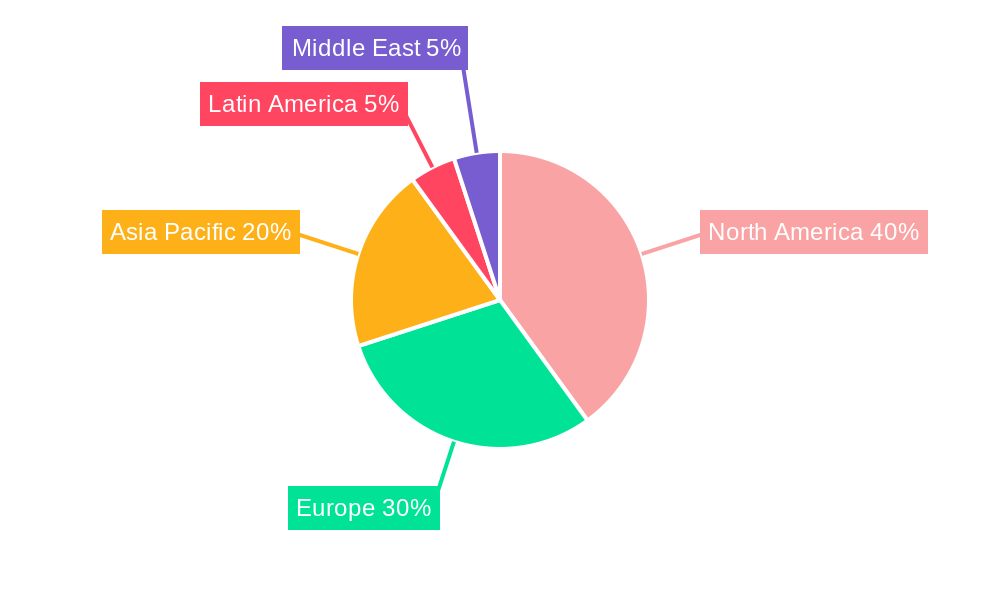
The market segmentation reveals strong demand across various applications and end-users. Air-based platforms dominate the application segment due to the widespread use of EO systems in fighter jets, helicopters, and UAVs. However, land-based and naval-based applications are also witnessing significant growth, driven by modernization efforts in ground forces and navies. Within the end-user segment, the defense sector is the largest contributor, accounting for a substantial portion of the market. However, increased focus on border security and counter-terrorism measures contributes to strong growth in the homeland security segment. Geographically, North America and Europe currently hold a significant market share, but the Asia-Pacific region is expected to experience the fastest growth rate in the coming years, driven by increasing defense spending and technological advancements in several countries. Leading companies like Lockheed Martin, Raytheon, Thales, and others are actively engaged in R&D and strategic partnerships, further driving innovation and consolidation within the market.
This in-depth report provides a comprehensive analysis of the Electro-Optics Systems industry, offering actionable insights for stakeholders across the value chain. The study covers the period from 2019 to 2033, with a base year of 2025 and a forecast period extending to 2033. The report utilizes a robust methodology to analyze market dynamics, including market sizing, segmentation, competitive landscape, and future growth projections. The total market value in 2025 is estimated at $XX Million.
Electro Optics Systems Industry Market Concentration & Innovation
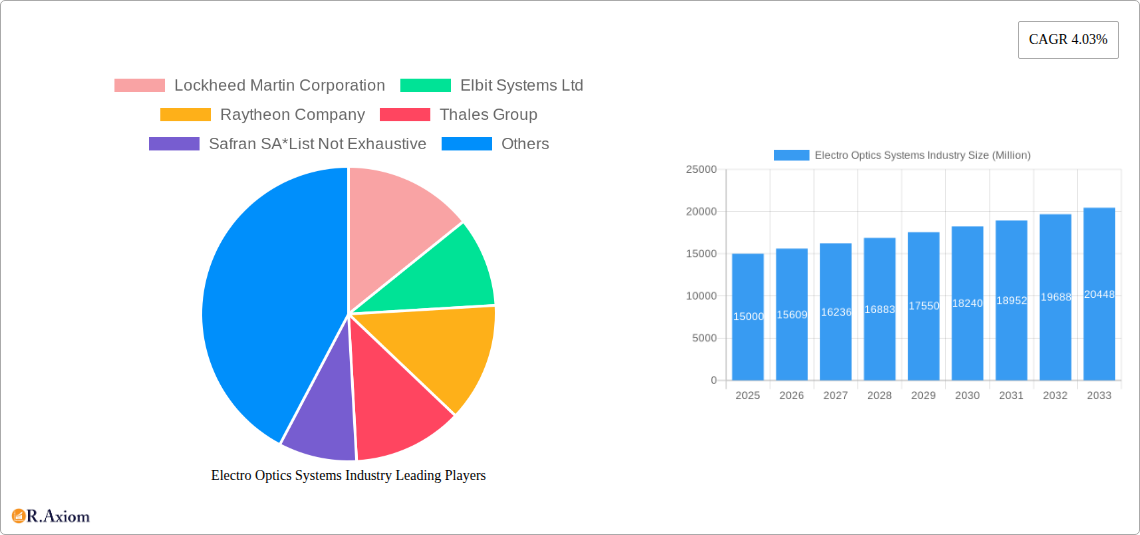
This section analyzes the competitive landscape of the electro-optics systems market, exploring key aspects influencing market concentration and innovation. The industry exhibits a moderately concentrated structure, with a handful of major players holding significant market share. Lockheed Martin Corporation, Elbit Systems Ltd, Raytheon Company, and Thales Group are among the leading players, each commanding a substantial portion of the global market. However, the market also accommodates numerous smaller companies specializing in niche applications and technologies.
Market Share (Estimated 2025):
- Lockheed Martin Corporation: xx%
- Elbit Systems Ltd: xx%
- Raytheon Company: xx%
- Thales Group: xx%
- Safran SA: xx%
- Others: xx%
Innovation Drivers: Technological advancements in sensor technology, including improved image resolution, miniaturization, and enhanced processing capabilities, are driving significant innovation. Furthermore, growing demand for improved situational awareness and targeting precision across various applications fuels substantial R&D investment.
Regulatory Frameworks: Stringent regulatory compliance requirements across defense and aerospace sectors impact industry players, especially concerning export controls and data security. These regulations can influence market entry barriers and innovation strategies.
Product Substitutes: While electro-optical systems remain crucial, alternative technologies, such as radar and lidar, are increasingly deployed, presenting subtle competitive pressures in specific applications.
Mergers & Acquisitions (M&A) Activity: The electro-optics systems industry witnesses consistent M&A activity, with major players acquiring smaller companies to expand their product portfolios, technological expertise, and market reach. The total value of M&A deals in the industry during 2019-2024 is estimated to be $XX Million.
Electro Optics Systems Industry Industry Trends & Insights
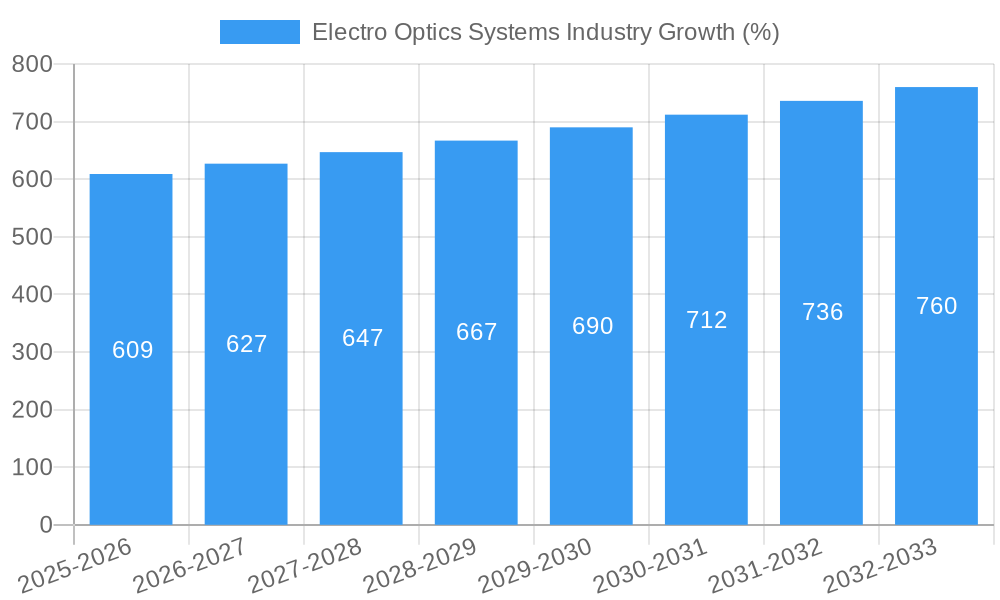
The global electro-optics systems market is witnessing robust growth, driven by increasing defense budgets globally, the rising adoption of advanced surveillance and targeting systems, and continuous technological advancements in sensor and imaging technologies. The compound annual growth rate (CAGR) during the forecast period (2025-2033) is projected to be xx%. Market penetration for advanced electro-optical systems in defense applications is expected to exceed xx% by 2033.
Technological disruptions, such as the integration of artificial intelligence (AI) and machine learning (ML) into electro-optical systems, are significantly enhancing their capabilities and expanding their applications across various sectors. Consumer preferences are evolving toward lighter, more energy-efficient, and higher-resolution systems, which is pushing innovation in miniaturization and power management. Intense competition among established players and emerging technology firms drives continuous improvements in product performance and affordability.
Dominant Markets & Segments in Electro Optics Systems Industry
The defense sector accounts for the largest share of the electro-optics systems market, driven by significant military modernization and investment in advanced weaponry. Air-based platforms dominate the application segment, followed by land-based and naval-based applications. North America remains the largest regional market, fueled by substantial defense spending and technological leadership.
Key Drivers for Regional Dominance (North America):
- High defense spending and government initiatives
- Strong technological base and R&D capabilities
- Presence of major industry players
- Well-developed infrastructure and supply chains
Dominant Segments:
- By Application Platform: Air-based systems represent the most significant segment due to their widespread application in aerial surveillance, targeting, and reconnaissance.
- By End User: The defense segment overwhelmingly dominates due to the critical role of electro-optical systems in military operations.
Electro Optics Systems Industry Product Developments
Recent product innovations focus on enhanced image processing, improved sensor resolution, miniaturization, and the integration of AI for automated target recognition. Advanced features like thermal imaging and multispectral capabilities enhance system performance. These advancements cater to the rising demand for better situational awareness and precision targeting in diverse applications such as defense, aerospace, and homeland security. The competitive advantage is derived from superior image quality, advanced data processing, and robust system integration.
Report Scope & Segmentation Analysis
This report segments the electro-optics systems market by application platform (air-based, land-based, naval-based) and end-user (defense, aerospace, homeland security). Each segment is analyzed to ascertain market size, growth projections, and competitive dynamics. The air-based segment is projected to witness the highest growth, driven by modernization of air forces worldwide. The defense segment will remain the largest end-user, continuing to drive demand for advanced electro-optical systems.
Key Drivers of Electro Optics Systems Industry Growth
Technological advancements (AI, enhanced sensors), increasing defense budgets, the growing need for improved surveillance, and the expansion of applications into commercial sectors (e.g., autonomous vehicles) are key growth drivers. Favorable government policies supporting defense modernization and technological innovation also stimulate growth.
Challenges in the Electro Optics Systems Industry Sector
Stringent regulations related to export controls and data security pose significant challenges. Supply chain disruptions can affect production and cost structures. Intense competition and technological obsolescence pressure profit margins. The estimated impact of these challenges on market growth is approximately xx% reduction.
Emerging Opportunities in Electro Optics Systems Industry
The integration of AI/ML, the expansion of applications into commercial sectors (e.g., autonomous vehicles, infrastructure monitoring), and the development of lightweight and energy-efficient systems represent significant emerging opportunities. New markets in developing countries, driven by increasing defense expenditure and modernization programs, also promise growth.
Leading Players in the Electro Optics Systems Industry Market
- Lockheed Martin Corporation
- Elbit Systems Ltd
- Raytheon Company
- Thales Group
- Safran SA
- Leonardo DRS
- BAE Systems plc
- Northrop Grumman Corporation
- FLIR Systems
- L-3 Technologies
Key Developments in Electro Optics Systems Industry Industry
- Jan 2023: Lockheed Martin announces the launch of a new generation of high-resolution infrared sensors.
- May 2022: Raytheon and Thales collaborate on the development of a next-generation targeting system.
- Oct 2021: Elbit Systems acquires a smaller company specializing in AI-based image processing technology.
- (Add more developments with specific dates as needed)
Strategic Outlook for Electro Optics Systems Industry Market
The electro-optics systems market exhibits strong growth potential, driven by continuous technological advancements and sustained demand from defense and commercial sectors. Future opportunities lie in the integration of AI/ML, the development of multi-sensor fusion systems, and the expansion into new applications. The market is expected to witness a steady expansion, with continued innovation and consolidation among key players shaping the industry landscape.
Electro Optics Systems Industry Segmentation
-
1. Application Platform
- 1.1. Air Based
- 1.2. Land Based
- 1.3. Naval Based
-
2. End User
- 2.1. Defense
- 2.2. Aerospace
- 2.3. Homeland Security
Electro Optics Systems Industry Segmentation By Geography
- 1. North America
- 2. Europe
- 3. Asia Pacific
- 4. Latin America
- 5. Middle East
Electro Optics Systems Industry REPORT HIGHLIGHTS
| Aspects | Details |
|---|---|
| Study Period | 2019-2033 |
| Base Year | 2024 |
| Estimated Year | 2025 |
| Forecast Period | 2025-2033 |
| Historical Period | 2019-2024 |
| Growth Rate | CAGR of 4.03% from 2019-2033 |
| Segmentation |
|
Table of Contents
- 1. Introduction
- 1.1. Research Scope
- 1.2. Market Segmentation
- 1.3. Research Methodology
- 1.4. Definitions and Assumptions
- 2. Executive Summary
- 2.1. Introduction
- 3. Market Dynamics
- 3.1. Introduction
- 3.2. Market Drivers
- 3.2.1. ; Increased Deployment of Electro Optics for Unmanned Vehicles
- 3.3. Market Restrains
- 3.3.1. ; High Implementation Cost and Long-term Return on Investment
- 3.4. Market Trends
- 3.4.1. Defense Segment to Witness High Growth
- 4. Market Factor Analysis
- 4.1. Porters Five Forces
- 4.2. Supply/Value Chain
- 4.3. PESTEL analysis
- 4.4. Market Entropy
- 4.5. Patent/Trademark Analysis
- 5. Global Electro Optics Systems Industry Analysis, Insights and Forecast, 2019-2031
- 5.1. Market Analysis, Insights and Forecast - by Application Platform
- 5.1.1. Air Based
- 5.1.2. Land Based
- 5.1.3. Naval Based
- 5.2. Market Analysis, Insights and Forecast - by End User
- 5.2.1. Defense
- 5.2.2. Aerospace
- 5.2.3. Homeland Security
- 5.3. Market Analysis, Insights and Forecast - by Region
- 5.3.1. North America
- 5.3.2. Europe
- 5.3.3. Asia Pacific
- 5.3.4. Latin America
- 5.3.5. Middle East
- 5.1. Market Analysis, Insights and Forecast - by Application Platform
- 6. North America Electro Optics Systems Industry Analysis, Insights and Forecast, 2019-2031
- 6.1. Market Analysis, Insights and Forecast - by Application Platform
- 6.1.1. Air Based
- 6.1.2. Land Based
- 6.1.3. Naval Based
- 6.2. Market Analysis, Insights and Forecast - by End User
- 6.2.1. Defense
- 6.2.2. Aerospace
- 6.2.3. Homeland Security
- 6.1. Market Analysis, Insights and Forecast - by Application Platform
- 7. Europe Electro Optics Systems Industry Analysis, Insights and Forecast, 2019-2031
- 7.1. Market Analysis, Insights and Forecast - by Application Platform
- 7.1.1. Air Based
- 7.1.2. Land Based
- 7.1.3. Naval Based
- 7.2. Market Analysis, Insights and Forecast - by End User
- 7.2.1. Defense
- 7.2.2. Aerospace
- 7.2.3. Homeland Security
- 7.1. Market Analysis, Insights and Forecast - by Application Platform
- 8. Asia Pacific Electro Optics Systems Industry Analysis, Insights and Forecast, 2019-2031
- 8.1. Market Analysis, Insights and Forecast - by Application Platform
- 8.1.1. Air Based
- 8.1.2. Land Based
- 8.1.3. Naval Based
- 8.2. Market Analysis, Insights and Forecast - by End User
- 8.2.1. Defense
- 8.2.2. Aerospace
- 8.2.3. Homeland Security
- 8.1. Market Analysis, Insights and Forecast - by Application Platform
- 9. Latin America Electro Optics Systems Industry Analysis, Insights and Forecast, 2019-2031
- 9.1. Market Analysis, Insights and Forecast - by Application Platform
- 9.1.1. Air Based
- 9.1.2. Land Based
- 9.1.3. Naval Based
- 9.2. Market Analysis, Insights and Forecast - by End User
- 9.2.1. Defense
- 9.2.2. Aerospace
- 9.2.3. Homeland Security
- 9.1. Market Analysis, Insights and Forecast - by Application Platform
- 10. Middle East Electro Optics Systems Industry Analysis, Insights and Forecast, 2019-2031
- 10.1. Market Analysis, Insights and Forecast - by Application Platform
- 10.1.1. Air Based
- 10.1.2. Land Based
- 10.1.3. Naval Based
- 10.2. Market Analysis, Insights and Forecast - by End User
- 10.2.1. Defense
- 10.2.2. Aerospace
- 10.2.3. Homeland Security
- 10.1. Market Analysis, Insights and Forecast - by Application Platform
- 11. North America Electro Optics Systems Industry Analysis, Insights and Forecast, 2019-2031
- 11.1. Market Analysis, Insights and Forecast - By Country/Sub-region
- 11.1.1.
- 12. Europe Electro Optics Systems Industry Analysis, Insights and Forecast, 2019-2031
- 12.1. Market Analysis, Insights and Forecast - By Country/Sub-region
- 12.1.1.
- 13. Asia Pacific Electro Optics Systems Industry Analysis, Insights and Forecast, 2019-2031
- 13.1. Market Analysis, Insights and Forecast - By Country/Sub-region
- 13.1.1.
- 14. Latin America Electro Optics Systems Industry Analysis, Insights and Forecast, 2019-2031
- 14.1. Market Analysis, Insights and Forecast - By Country/Sub-region
- 14.1.1.
- 15. Middle East Electro Optics Systems Industry Analysis, Insights and Forecast, 2019-2031
- 15.1. Market Analysis, Insights and Forecast - By Country/Sub-region
- 15.1.1.
- 16. Competitive Analysis
- 16.1. Global Market Share Analysis 2024
- 16.2. Company Profiles
- 16.2.1 Lockheed Martin Corporation
- 16.2.1.1. Overview
- 16.2.1.2. Products
- 16.2.1.3. SWOT Analysis
- 16.2.1.4. Recent Developments
- 16.2.1.5. Financials (Based on Availability)
- 16.2.2 Elbit Systems Ltd
- 16.2.2.1. Overview
- 16.2.2.2. Products
- 16.2.2.3. SWOT Analysis
- 16.2.2.4. Recent Developments
- 16.2.2.5. Financials (Based on Availability)
- 16.2.3 Raytheon Company
- 16.2.3.1. Overview
- 16.2.3.2. Products
- 16.2.3.3. SWOT Analysis
- 16.2.3.4. Recent Developments
- 16.2.3.5. Financials (Based on Availability)
- 16.2.4 Thales Group
- 16.2.4.1. Overview
- 16.2.4.2. Products
- 16.2.4.3. SWOT Analysis
- 16.2.4.4. Recent Developments
- 16.2.4.5. Financials (Based on Availability)
- 16.2.5 Safran SA*List Not Exhaustive
- 16.2.5.1. Overview
- 16.2.5.2. Products
- 16.2.5.3. SWOT Analysis
- 16.2.5.4. Recent Developments
- 16.2.5.5. Financials (Based on Availability)
- 16.2.6 Leonardo DRS
- 16.2.6.1. Overview
- 16.2.6.2. Products
- 16.2.6.3. SWOT Analysis
- 16.2.6.4. Recent Developments
- 16.2.6.5. Financials (Based on Availability)
- 16.2.7 BAE Systems plc
- 16.2.7.1. Overview
- 16.2.7.2. Products
- 16.2.7.3. SWOT Analysis
- 16.2.7.4. Recent Developments
- 16.2.7.5. Financials (Based on Availability)
- 16.2.8 Northrop Grumman Corporation
- 16.2.8.1. Overview
- 16.2.8.2. Products
- 16.2.8.3. SWOT Analysis
- 16.2.8.4. Recent Developments
- 16.2.8.5. Financials (Based on Availability)
- 16.2.9 FLIR Systems
- 16.2.9.1. Overview
- 16.2.9.2. Products
- 16.2.9.3. SWOT Analysis
- 16.2.9.4. Recent Developments
- 16.2.9.5. Financials (Based on Availability)
- 16.2.10 L-3 Technologies
- 16.2.10.1. Overview
- 16.2.10.2. Products
- 16.2.10.3. SWOT Analysis
- 16.2.10.4. Recent Developments
- 16.2.10.5. Financials (Based on Availability)
- 16.2.1 Lockheed Martin Corporation
List of Figures
- Figure 1: Global Electro Optics Systems Industry Revenue Breakdown (Million, %) by Region 2024 & 2032
- Figure 2: North America Electro Optics Systems Industry Revenue (Million), by Country 2024 & 2032
- Figure 3: North America Electro Optics Systems Industry Revenue Share (%), by Country 2024 & 2032
- Figure 4: Europe Electro Optics Systems Industry Revenue (Million), by Country 2024 & 2032
- Figure 5: Europe Electro Optics Systems Industry Revenue Share (%), by Country 2024 & 2032
- Figure 6: Asia Pacific Electro Optics Systems Industry Revenue (Million), by Country 2024 & 2032
- Figure 7: Asia Pacific Electro Optics Systems Industry Revenue Share (%), by Country 2024 & 2032
- Figure 8: Latin America Electro Optics Systems Industry Revenue (Million), by Country 2024 & 2032
- Figure 9: Latin America Electro Optics Systems Industry Revenue Share (%), by Country 2024 & 2032
- Figure 10: Middle East Electro Optics Systems Industry Revenue (Million), by Country 2024 & 2032
- Figure 11: Middle East Electro Optics Systems Industry Revenue Share (%), by Country 2024 & 2032
- Figure 12: North America Electro Optics Systems Industry Revenue (Million), by Application Platform 2024 & 2032
- Figure 13: North America Electro Optics Systems Industry Revenue Share (%), by Application Platform 2024 & 2032
- Figure 14: North America Electro Optics Systems Industry Revenue (Million), by End User 2024 & 2032
- Figure 15: North America Electro Optics Systems Industry Revenue Share (%), by End User 2024 & 2032
- Figure 16: North America Electro Optics Systems Industry Revenue (Million), by Country 2024 & 2032
- Figure 17: North America Electro Optics Systems Industry Revenue Share (%), by Country 2024 & 2032
- Figure 18: Europe Electro Optics Systems Industry Revenue (Million), by Application Platform 2024 & 2032
- Figure 19: Europe Electro Optics Systems Industry Revenue Share (%), by Application Platform 2024 & 2032
- Figure 20: Europe Electro Optics Systems Industry Revenue (Million), by End User 2024 & 2032
- Figure 21: Europe Electro Optics Systems Industry Revenue Share (%), by End User 2024 & 2032
- Figure 22: Europe Electro Optics Systems Industry Revenue (Million), by Country 2024 & 2032
- Figure 23: Europe Electro Optics Systems Industry Revenue Share (%), by Country 2024 & 2032
- Figure 24: Asia Pacific Electro Optics Systems Industry Revenue (Million), by Application Platform 2024 & 2032
- Figure 25: Asia Pacific Electro Optics Systems Industry Revenue Share (%), by Application Platform 2024 & 2032
- Figure 26: Asia Pacific Electro Optics Systems Industry Revenue (Million), by End User 2024 & 2032
- Figure 27: Asia Pacific Electro Optics Systems Industry Revenue Share (%), by End User 2024 & 2032
- Figure 28: Asia Pacific Electro Optics Systems Industry Revenue (Million), by Country 2024 & 2032
- Figure 29: Asia Pacific Electro Optics Systems Industry Revenue Share (%), by Country 2024 & 2032
- Figure 30: Latin America Electro Optics Systems Industry Revenue (Million), by Application Platform 2024 & 2032
- Figure 31: Latin America Electro Optics Systems Industry Revenue Share (%), by Application Platform 2024 & 2032
- Figure 32: Latin America Electro Optics Systems Industry Revenue (Million), by End User 2024 & 2032
- Figure 33: Latin America Electro Optics Systems Industry Revenue Share (%), by End User 2024 & 2032
- Figure 34: Latin America Electro Optics Systems Industry Revenue (Million), by Country 2024 & 2032
- Figure 35: Latin America Electro Optics Systems Industry Revenue Share (%), by Country 2024 & 2032
- Figure 36: Middle East Electro Optics Systems Industry Revenue (Million), by Application Platform 2024 & 2032
- Figure 37: Middle East Electro Optics Systems Industry Revenue Share (%), by Application Platform 2024 & 2032
- Figure 38: Middle East Electro Optics Systems Industry Revenue (Million), by End User 2024 & 2032
- Figure 39: Middle East Electro Optics Systems Industry Revenue Share (%), by End User 2024 & 2032
- Figure 40: Middle East Electro Optics Systems Industry Revenue (Million), by Country 2024 & 2032
- Figure 41: Middle East Electro Optics Systems Industry Revenue Share (%), by Country 2024 & 2032
List of Tables
- Table 1: Global Electro Optics Systems Industry Revenue Million Forecast, by Region 2019 & 2032
- Table 2: Global Electro Optics Systems Industry Revenue Million Forecast, by Application Platform 2019 & 2032
- Table 3: Global Electro Optics Systems Industry Revenue Million Forecast, by End User 2019 & 2032
- Table 4: Global Electro Optics Systems Industry Revenue Million Forecast, by Region 2019 & 2032
- Table 5: Global Electro Optics Systems Industry Revenue Million Forecast, by Country 2019 & 2032
- Table 6: Electro Optics Systems Industry Revenue (Million) Forecast, by Application 2019 & 2032
- Table 7: Global Electro Optics Systems Industry Revenue Million Forecast, by Country 2019 & 2032
- Table 8: Electro Optics Systems Industry Revenue (Million) Forecast, by Application 2019 & 2032
- Table 9: Global Electro Optics Systems Industry Revenue Million Forecast, by Country 2019 & 2032
- Table 10: Electro Optics Systems Industry Revenue (Million) Forecast, by Application 2019 & 2032
- Table 11: Global Electro Optics Systems Industry Revenue Million Forecast, by Country 2019 & 2032
- Table 12: Electro Optics Systems Industry Revenue (Million) Forecast, by Application 2019 & 2032
- Table 13: Global Electro Optics Systems Industry Revenue Million Forecast, by Country 2019 & 2032
- Table 14: Electro Optics Systems Industry Revenue (Million) Forecast, by Application 2019 & 2032
- Table 15: Global Electro Optics Systems Industry Revenue Million Forecast, by Application Platform 2019 & 2032
- Table 16: Global Electro Optics Systems Industry Revenue Million Forecast, by End User 2019 & 2032
- Table 17: Global Electro Optics Systems Industry Revenue Million Forecast, by Country 2019 & 2032
- Table 18: Global Electro Optics Systems Industry Revenue Million Forecast, by Application Platform 2019 & 2032
- Table 19: Global Electro Optics Systems Industry Revenue Million Forecast, by End User 2019 & 2032
- Table 20: Global Electro Optics Systems Industry Revenue Million Forecast, by Country 2019 & 2032
- Table 21: Global Electro Optics Systems Industry Revenue Million Forecast, by Application Platform 2019 & 2032
- Table 22: Global Electro Optics Systems Industry Revenue Million Forecast, by End User 2019 & 2032
- Table 23: Global Electro Optics Systems Industry Revenue Million Forecast, by Country 2019 & 2032
- Table 24: Global Electro Optics Systems Industry Revenue Million Forecast, by Application Platform 2019 & 2032
- Table 25: Global Electro Optics Systems Industry Revenue Million Forecast, by End User 2019 & 2032
- Table 26: Global Electro Optics Systems Industry Revenue Million Forecast, by Country 2019 & 2032
- Table 27: Global Electro Optics Systems Industry Revenue Million Forecast, by Application Platform 2019 & 2032
- Table 28: Global Electro Optics Systems Industry Revenue Million Forecast, by End User 2019 & 2032
- Table 29: Global Electro Optics Systems Industry Revenue Million Forecast, by Country 2019 & 2032
Frequently Asked Questions
1. What is the projected Compound Annual Growth Rate (CAGR) of the Electro Optics Systems Industry?
The projected CAGR is approximately 4.03%.
2. Which companies are prominent players in the Electro Optics Systems Industry?
Key companies in the market include Lockheed Martin Corporation, Elbit Systems Ltd, Raytheon Company, Thales Group, Safran SA*List Not Exhaustive, Leonardo DRS, BAE Systems plc, Northrop Grumman Corporation, FLIR Systems, L-3 Technologies.
3. What are the main segments of the Electro Optics Systems Industry?
The market segments include Application Platform, End User.
4. Can you provide details about the market size?
The market size is estimated to be USD XX Million as of 2022.
5. What are some drivers contributing to market growth?
; Increased Deployment of Electro Optics for Unmanned Vehicles.
6. What are the notable trends driving market growth?
Defense Segment to Witness High Growth.
7. Are there any restraints impacting market growth?
; High Implementation Cost and Long-term Return on Investment.
8. Can you provide examples of recent developments in the market?
N/A
9. What pricing options are available for accessing the report?
Pricing options include single-user, multi-user, and enterprise licenses priced at USD 4750, USD 5250, and USD 8750 respectively.
10. Is the market size provided in terms of value or volume?
The market size is provided in terms of value, measured in Million.
11. Are there any specific market keywords associated with the report?
Yes, the market keyword associated with the report is "Electro Optics Systems Industry," which aids in identifying and referencing the specific market segment covered.
12. How do I determine which pricing option suits my needs best?
The pricing options vary based on user requirements and access needs. Individual users may opt for single-user licenses, while businesses requiring broader access may choose multi-user or enterprise licenses for cost-effective access to the report.
13. Are there any additional resources or data provided in the Electro Optics Systems Industry report?
While the report offers comprehensive insights, it's advisable to review the specific contents or supplementary materials provided to ascertain if additional resources or data are available.
14. How can I stay updated on further developments or reports in the Electro Optics Systems Industry?
To stay informed about further developments, trends, and reports in the Electro Optics Systems Industry, consider subscribing to industry newsletters, following relevant companies and organizations, or regularly checking reputable industry news sources and publications.
Methodology
Step 1 - Identification of Relevant Samples Size from Population Database


Step 2 - Approaches for Defining Global Market Size (Value, Volume* & Price*)

Note*: In applicable scenarios
Step 3 - Data Sources
Primary Research
- Web Analytics
- Survey Reports
- Research Institute
- Latest Research Reports
- Opinion Leaders
Secondary Research
- Annual Reports
- White Paper
- Latest Press Release
- Industry Association
- Paid Database
- Investor Presentations

Step 4 - Data Triangulation
Involves using different sources of information in order to increase the validity of a study
These sources are likely to be stakeholders in a program - participants, other researchers, program staff, other community members, and so on.
Then we put all data in single framework & apply various statistical tools to find out the dynamic on the market.
During the analysis stage, feedback from the stakeholder groups would be compared to determine areas of agreement as well as areas of divergence


