


Key Insights
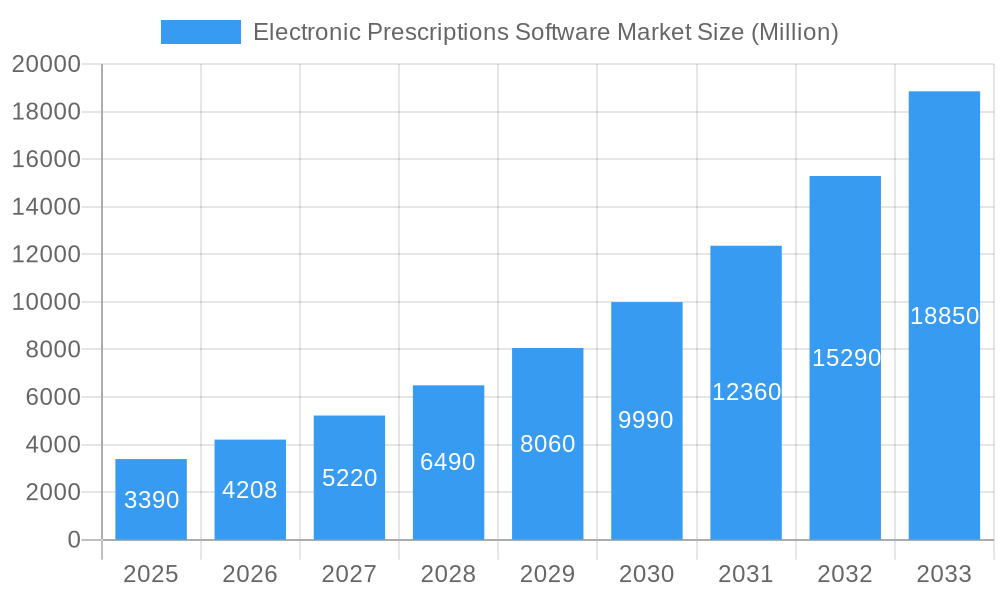
The Electronic Prescriptions Software market is experiencing robust growth, projected to reach \$3.39 billion in 2025 and exhibiting a remarkable Compound Annual Growth Rate (CAGR) of 24.19% from 2025 to 2033. This expansion is fueled by several key drivers. The increasing adoption of electronic health records (EHRs) within healthcare systems is creating a synergistic effect, demanding seamless integration with e-prescribing solutions. Government regulations promoting interoperability and patient safety are also accelerating market uptake. Furthermore, the rising prevalence of chronic diseases necessitates efficient medication management, bolstering the demand for e-prescribing systems. The shift towards value-based care models further emphasizes the need for accurate and readily accessible prescription information, further enhancing the market's trajectory. Growth is also being driven by the technological advancements within the sector, particularly in areas such as cloud-based solutions and enhanced security features that address concerns around data privacy and compliance.

Electronic Prescriptions Software Market Market Size (In Billion)

Market segmentation reveals a diverse landscape. The hardware component, though crucial, is likely to show slower growth compared to the software and services segments, driven by ongoing software development and the need for ongoing technical support and maintenance. Integrated e-prescribing systems are expected to capture a larger market share than standalone systems due to their enhanced efficiency and integration capabilities within existing healthcare IT infrastructure. Cloud-based delivery models are gaining traction due to their scalability and cost-effectiveness, surpassing web-based and on-premise solutions in market share over the forecast period. Among end-users, hospitals and large clinics are currently leading the adoption, but smaller clinics are rapidly adopting these systems as cost and ease of use improve. Geographical analysis indicates strong growth across North America and Europe, driven by advanced healthcare infrastructure and regulatory frameworks, with Asia-Pacific emerging as a significant growth market in the coming years. Competitive analysis highlights key players like eMDs, Oracle (Cerner), eClinicalWorks, and others, actively engaged in innovation, acquisitions, and partnerships to maintain their market position.
Electronic Prescriptions Software Market Company Market Share
This comprehensive report provides an in-depth analysis of the Electronic Prescriptions Software market, offering actionable insights for stakeholders across the healthcare IT landscape. The study period spans from 2019 to 2033, with 2025 serving as the base and estimated year. The report meticulously examines market dynamics, segmentation, competitive landscape, and future growth prospects, enabling informed decision-making for businesses and investors. The market is valued at xx Million in 2025 and is projected to reach xx Million by 2033, exhibiting a CAGR of xx% during the forecast period (2025-2033).
Electronic Prescriptions Software Market Concentration & Innovation
This section analyzes the market concentration, identifying key players and their market share. It explores the drivers of innovation, including technological advancements and regulatory changes. The impact of regulatory frameworks, the availability of substitute products, evolving end-user trends (e.g., preference for cloud-based solutions), and the influence of mergers and acquisitions (M&A) activities are also examined.
- Market Concentration: The Electronic Prescriptions Software market is moderately concentrated, with key players like eMDs Inc, Oracle (Cerner Corporation), eClinicalWorks, Surescripts, Relayhealth Corporation, Allscripts Healthcare Solutions Inc (Veradigm), NextGen Healthcare Inc, DrFirst, and Athenahealth Inc holding significant market share. Precise market share figures for each player are detailed in the full report, including analysis of their strategic positioning and competitive advantages.
- Innovation Drivers: The market is driven by advancements in cloud computing, AI-powered clinical decision support systems, and the increasing integration of e-prescribing with other healthcare IT platforms (e.g., electronic health records). Regulatory mandates promoting interoperability and patient data privacy also stimulate innovation.
- M&A Activity: The report analyzes recent M&A activity within the sector, such as the August 2021 acquisition of Doxper by Meddo, assessing their impact on market consolidation and competitive dynamics. The value of these deals and their anticipated effects on market growth are discussed in detail, alongside an evaluation of future M&A potential based on market trends. The report provides a breakdown of deal values (in Millions) where available.
Electronic Prescriptions Software Market Industry Trends & Insights
This section delves into the key trends shaping the Electronic Prescriptions Software market. It examines the market's growth drivers, technological disruptions, evolving consumer preferences (e.g., demand for user-friendly interfaces and enhanced security features), and the complex interplay of competitive dynamics. The analysis will cover:
- Growth Drivers: Rising adoption of electronic health records (EHRs), government initiatives promoting interoperability, increasing demand for improved patient safety, and the need for streamlined healthcare workflows are driving market growth. The report quantifies the impact of these drivers on market expansion.
- Technological Disruptions: The introduction of cloud-based solutions, artificial intelligence, and machine learning is transforming the market. The analysis assesses how these advancements are reshaping the competitive landscape and driving innovation.
- Consumer Preferences: The report examines evolving healthcare provider and patient expectations, including the need for intuitive interfaces, robust security measures, and seamless integration with other healthcare systems. This section quantifies the market penetration of different e-prescribing systems.
- Competitive Dynamics: The report analyzes the competitive landscape, highlighting competitive strategies employed by key players, including pricing strategies, product differentiation, and market expansion initiatives.
Dominant Markets & Segments in Electronic Prescriptions Software Market
This section identifies the leading regions, countries, and market segments within the Electronic Prescriptions Software market. The analysis considers Component (Hardware, Software, Services), Type of System (Stand-alone, Integrated), Delivery Mode (Cloud, Web, On-Premise), and End Users (Hospitals, Clinics).
- Key Drivers:
- Economic Policies: Government regulations and incentives supporting digital healthcare transformation.
- Infrastructure: Availability of high-speed internet access and robust IT infrastructure.
- Healthcare IT investment: Spending on healthcare information technology systems.
- Dominance Analysis: The report analyzes the factors contributing to the dominance of specific regions, countries, and segments, providing detailed explanations and supporting data. For instance, specific regions may exhibit higher adoption rates due to favorable regulatory landscapes or higher levels of healthcare IT investments.
Electronic Prescriptions Software Market Product Developments
This section explores recent product innovations, outlining their applications and competitive advantages. Technological advancements, such as enhanced security features, integration with other healthcare platforms, and AI-driven functionalities, are highlighted. The market fit of these innovations is assessed based on their ability to meet current market needs and anticipated future demands. The analysis includes the impact of the launch of FDB Vela in March 2022, for example.
Report Scope & Segmentation Analysis
This report segments the Electronic Prescriptions Software market by:
- Component: Hardware, Software, Services (with individual market size and growth projections for each). Competitive dynamics within each segment are analyzed.
- Type of System: Stand-alone E-prescribing System, Integrated E-prescribing System (with individual market size and growth projections for each). Competitive dynamics within each segment are analyzed.
- Delivery Mode: Cloud Based, Web Based, On-Premise (with individual market size and growth projections for each). Competitive dynamics within each segment are analyzed.
- End Users: Hospitals, Clinics (with individual market size and growth projections for each). Competitive dynamics within each segment are analyzed.
Key Drivers of Electronic Prescriptions Software Market Growth
Several factors are driving the growth of the Electronic Prescriptions Software market:
- Technological advancements: Cloud computing, AI, and machine learning are enhancing functionality and accessibility.
- Government regulations: Mandates for interoperability and electronic health records are boosting adoption.
- Cost savings: E-prescribing reduces administrative burdens and improves efficiency in healthcare practices.
Challenges in the Electronic Prescriptions Software Market Sector
The Electronic Prescriptions Software market faces several challenges:
- Regulatory hurdles: Compliance with various data privacy and security regulations can be complex and costly.
- Interoperability issues: Integrating e-prescribing systems with diverse healthcare IT platforms can present technical difficulties.
- Competitive pressures: The market is becoming increasingly competitive, with numerous vendors vying for market share. The effect of these pressures on pricing and profit margins is discussed in detail.
Emerging Opportunities in Electronic Prescriptions Software Market
The Electronic Prescriptions Software market presents several promising opportunities:
- Expansion into underserved markets: Growing adoption in developing countries with increasing internet penetration.
- Integration with telehealth platforms: The rise of telehealth presents opportunities for seamless integration.
- Development of specialized e-prescribing solutions: Creating tailored solutions for specific healthcare settings (e.g., long-term care).
Leading Players in the Electronic Prescriptions Software Market Market
Key Developments in Electronic Prescriptions Software Market Industry
- March 2022: FDB (First Databank, Inc.) launched FDB Vela, a cloud-native e-prescribing network, enhancing medication prescription information flow.
- August 2021: Meddo acquired Doxper, expanding its patient base and clinic network in India.
Strategic Outlook for Electronic Prescriptions Software Market Market
The Electronic Prescriptions Software market is poised for significant growth, driven by increasing digitalization in healthcare, technological advancements, and favorable regulatory environments. The market’s future potential lies in the development of innovative solutions that address emerging needs, such as improved interoperability, enhanced security, and personalized patient care. Further expansion into new markets and strategic partnerships will play a crucial role in shaping the future of the industry.
Electronic Prescriptions Software Market Segmentation
-
1. Component
- 1.1. Hardware
- 1.2. Software
- 1.3. Services
-
2. Type of System
- 2.1. Stand-alone E-prescribing System
- 2.2. Integrated E-prescribing System
-
3. Delivery Mode
- 3.1. Cloud Based
- 3.2. Web Based
- 3.3. On-Premise
-
4. End Users
- 4.1. Hospitals
- 4.2. Clinics
Electronic Prescriptions Software Market Segmentation By Geography
-
1. North America
- 1.1. United States
- 1.2. Canada
- 1.3. Mexico
-
2. Europe
- 2.1. Germany
- 2.2. United Kingdom
- 2.3. France
- 2.4. Italy
- 2.5. Spain
- 2.6. Rest of Europe
-
3. Asia Pacific
- 3.1. China
- 3.2. Japan
- 3.3. India
- 3.4. Australia
- 3.5. South Korea
- 3.6. Rest of Asia Pacific
-
4. Middle East and Africa
- 4.1. GCC
- 4.2. South Africa
- 4.3. Rest of Middle East and Africa
-
5. South America
- 5.1. Brazil
- 5.2. Argentina
- 5.3. Rest of South America

Electronic Prescriptions Software Market Regional Market Share
Geographic Coverage of Electronic Prescriptions Software Market
Electronic Prescriptions Software Market REPORT HIGHLIGHTS
| Aspects | Details |
|---|---|
| Study Period | 2020-2034 |
| Base Year | 2025 |
| Estimated Year | 2026 |
| Forecast Period | 2026-2034 |
| Historical Period | 2020-2025 |
| Growth Rate | CAGR of 24.19% from 2020-2034 |
| Segmentation |
|
Table of Contents
- 1. Introduction
- 1.1. Research Scope
- 1.2. Market Segmentation
- 1.3. Research Methodology
- 1.4. Definitions and Assumptions
- 2. Executive Summary
- 2.1. Introduction
- 3. Market Dynamics
- 3.1. Introduction
- 3.2. Market Drivers
- 3.2.1. Minimisation of Prescription Errors; Rising Demand for E-prescription System; Better Quality of Healthcare and Cost Reduction
- 3.3. Market Restrains
- 3.3.1. Security and Workflow Issues; Lack of Skilled Personnel to Handle the Systems
- 3.4. Market Trends
- 3.4.1. Stand-alone E-prescribing System Segment is Expected to Witness Growth Over the Forecast Period
- 4. Market Factor Analysis
- 4.1. Porters Five Forces
- 4.2. Supply/Value Chain
- 4.3. PESTEL analysis
- 4.4. Market Entropy
- 4.5. Patent/Trademark Analysis
- 5. Global Electronic Prescriptions Software Market Analysis, Insights and Forecast, 2020-2032
- 5.1. Market Analysis, Insights and Forecast - by Component
- 5.1.1. Hardware
- 5.1.2. Software
- 5.1.3. Services
- 5.2. Market Analysis, Insights and Forecast - by Type of System
- 5.2.1. Stand-alone E-prescribing System
- 5.2.2. Integrated E-prescribing System
- 5.3. Market Analysis, Insights and Forecast - by Delivery Mode
- 5.3.1. Cloud Based
- 5.3.2. Web Based
- 5.3.3. On-Premise
- 5.4. Market Analysis, Insights and Forecast - by End Users
- 5.4.1. Hospitals
- 5.4.2. Clinics
- 5.5. Market Analysis, Insights and Forecast - by Region
- 5.5.1. North America
- 5.5.2. Europe
- 5.5.3. Asia Pacific
- 5.5.4. Middle East and Africa
- 5.5.5. South America
- 5.1. Market Analysis, Insights and Forecast - by Component
- 6. North America Electronic Prescriptions Software Market Analysis, Insights and Forecast, 2020-2032
- 6.1. Market Analysis, Insights and Forecast - by Component
- 6.1.1. Hardware
- 6.1.2. Software
- 6.1.3. Services
- 6.2. Market Analysis, Insights and Forecast - by Type of System
- 6.2.1. Stand-alone E-prescribing System
- 6.2.2. Integrated E-prescribing System
- 6.3. Market Analysis, Insights and Forecast - by Delivery Mode
- 6.3.1. Cloud Based
- 6.3.2. Web Based
- 6.3.3. On-Premise
- 6.4. Market Analysis, Insights and Forecast - by End Users
- 6.4.1. Hospitals
- 6.4.2. Clinics
- 6.1. Market Analysis, Insights and Forecast - by Component
- 7. Europe Electronic Prescriptions Software Market Analysis, Insights and Forecast, 2020-2032
- 7.1. Market Analysis, Insights and Forecast - by Component
- 7.1.1. Hardware
- 7.1.2. Software
- 7.1.3. Services
- 7.2. Market Analysis, Insights and Forecast - by Type of System
- 7.2.1. Stand-alone E-prescribing System
- 7.2.2. Integrated E-prescribing System
- 7.3. Market Analysis, Insights and Forecast - by Delivery Mode
- 7.3.1. Cloud Based
- 7.3.2. Web Based
- 7.3.3. On-Premise
- 7.4. Market Analysis, Insights and Forecast - by End Users
- 7.4.1. Hospitals
- 7.4.2. Clinics
- 7.1. Market Analysis, Insights and Forecast - by Component
- 8. Asia Pacific Electronic Prescriptions Software Market Analysis, Insights and Forecast, 2020-2032
- 8.1. Market Analysis, Insights and Forecast - by Component
- 8.1.1. Hardware
- 8.1.2. Software
- 8.1.3. Services
- 8.2. Market Analysis, Insights and Forecast - by Type of System
- 8.2.1. Stand-alone E-prescribing System
- 8.2.2. Integrated E-prescribing System
- 8.3. Market Analysis, Insights and Forecast - by Delivery Mode
- 8.3.1. Cloud Based
- 8.3.2. Web Based
- 8.3.3. On-Premise
- 8.4. Market Analysis, Insights and Forecast - by End Users
- 8.4.1. Hospitals
- 8.4.2. Clinics
- 8.1. Market Analysis, Insights and Forecast - by Component
- 9. Middle East and Africa Electronic Prescriptions Software Market Analysis, Insights and Forecast, 2020-2032
- 9.1. Market Analysis, Insights and Forecast - by Component
- 9.1.1. Hardware
- 9.1.2. Software
- 9.1.3. Services
- 9.2. Market Analysis, Insights and Forecast - by Type of System
- 9.2.1. Stand-alone E-prescribing System
- 9.2.2. Integrated E-prescribing System
- 9.3. Market Analysis, Insights and Forecast - by Delivery Mode
- 9.3.1. Cloud Based
- 9.3.2. Web Based
- 9.3.3. On-Premise
- 9.4. Market Analysis, Insights and Forecast - by End Users
- 9.4.1. Hospitals
- 9.4.2. Clinics
- 9.1. Market Analysis, Insights and Forecast - by Component
- 10. South America Electronic Prescriptions Software Market Analysis, Insights and Forecast, 2020-2032
- 10.1. Market Analysis, Insights and Forecast - by Component
- 10.1.1. Hardware
- 10.1.2. Software
- 10.1.3. Services
- 10.2. Market Analysis, Insights and Forecast - by Type of System
- 10.2.1. Stand-alone E-prescribing System
- 10.2.2. Integrated E-prescribing System
- 10.3. Market Analysis, Insights and Forecast - by Delivery Mode
- 10.3.1. Cloud Based
- 10.3.2. Web Based
- 10.3.3. On-Premise
- 10.4. Market Analysis, Insights and Forecast - by End Users
- 10.4.1. Hospitals
- 10.4.2. Clinics
- 10.1. Market Analysis, Insights and Forecast - by Component
- 11. Competitive Analysis
- 11.1. Global Market Share Analysis 2025
- 11.2. Company Profiles
- 11.2.1 eMDs Inc
- 11.2.1.1. Overview
- 11.2.1.2. Products
- 11.2.1.3. SWOT Analysis
- 11.2.1.4. Recent Developments
- 11.2.1.5. Financials (Based on Availability)
- 11.2.2 Oracle (Cerner Corporation)
- 11.2.2.1. Overview
- 11.2.2.2. Products
- 11.2.2.3. SWOT Analysis
- 11.2.2.4. Recent Developments
- 11.2.2.5. Financials (Based on Availability)
- 11.2.3 eClinicalWorks
- 11.2.3.1. Overview
- 11.2.3.2. Products
- 11.2.3.3. SWOT Analysis
- 11.2.3.4. Recent Developments
- 11.2.3.5. Financials (Based on Availability)
- 11.2.4 Surescripts
- 11.2.4.1. Overview
- 11.2.4.2. Products
- 11.2.4.3. SWOT Analysis
- 11.2.4.4. Recent Developments
- 11.2.4.5. Financials (Based on Availability)
- 11.2.5 Relayhealth Corporation
- 11.2.5.1. Overview
- 11.2.5.2. Products
- 11.2.5.3. SWOT Analysis
- 11.2.5.4. Recent Developments
- 11.2.5.5. Financials (Based on Availability)
- 11.2.6 Allscripts Healthcare Solutions Inc (Veradigm)
- 11.2.6.1. Overview
- 11.2.6.2. Products
- 11.2.6.3. SWOT Analysis
- 11.2.6.4. Recent Developments
- 11.2.6.5. Financials (Based on Availability)
- 11.2.7 NextGen Healthcare Inc
- 11.2.7.1. Overview
- 11.2.7.2. Products
- 11.2.7.3. SWOT Analysis
- 11.2.7.4. Recent Developments
- 11.2.7.5. Financials (Based on Availability)
- 11.2.8 DrFirst
- 11.2.8.1. Overview
- 11.2.8.2. Products
- 11.2.8.3. SWOT Analysis
- 11.2.8.4. Recent Developments
- 11.2.8.5. Financials (Based on Availability)
- 11.2.9 Athenahealth Inc
- 11.2.9.1. Overview
- 11.2.9.2. Products
- 11.2.9.3. SWOT Analysis
- 11.2.9.4. Recent Developments
- 11.2.9.5. Financials (Based on Availability)
- 11.2.1 eMDs Inc
List of Figures
- Figure 1: Global Electronic Prescriptions Software Market Revenue Breakdown (Million, %) by Region 2025 & 2033
- Figure 2: Global Electronic Prescriptions Software Market Volume Breakdown (K Unit, %) by Region 2025 & 2033
- Figure 3: North America Electronic Prescriptions Software Market Revenue (Million), by Component 2025 & 2033
- Figure 4: North America Electronic Prescriptions Software Market Volume (K Unit), by Component 2025 & 2033
- Figure 5: North America Electronic Prescriptions Software Market Revenue Share (%), by Component 2025 & 2033
- Figure 6: North America Electronic Prescriptions Software Market Volume Share (%), by Component 2025 & 2033
- Figure 7: North America Electronic Prescriptions Software Market Revenue (Million), by Type of System 2025 & 2033
- Figure 8: North America Electronic Prescriptions Software Market Volume (K Unit), by Type of System 2025 & 2033
- Figure 9: North America Electronic Prescriptions Software Market Revenue Share (%), by Type of System 2025 & 2033
- Figure 10: North America Electronic Prescriptions Software Market Volume Share (%), by Type of System 2025 & 2033
- Figure 11: North America Electronic Prescriptions Software Market Revenue (Million), by Delivery Mode 2025 & 2033
- Figure 12: North America Electronic Prescriptions Software Market Volume (K Unit), by Delivery Mode 2025 & 2033
- Figure 13: North America Electronic Prescriptions Software Market Revenue Share (%), by Delivery Mode 2025 & 2033
- Figure 14: North America Electronic Prescriptions Software Market Volume Share (%), by Delivery Mode 2025 & 2033
- Figure 15: North America Electronic Prescriptions Software Market Revenue (Million), by End Users 2025 & 2033
- Figure 16: North America Electronic Prescriptions Software Market Volume (K Unit), by End Users 2025 & 2033
- Figure 17: North America Electronic Prescriptions Software Market Revenue Share (%), by End Users 2025 & 2033
- Figure 18: North America Electronic Prescriptions Software Market Volume Share (%), by End Users 2025 & 2033
- Figure 19: North America Electronic Prescriptions Software Market Revenue (Million), by Country 2025 & 2033
- Figure 20: North America Electronic Prescriptions Software Market Volume (K Unit), by Country 2025 & 2033
- Figure 21: North America Electronic Prescriptions Software Market Revenue Share (%), by Country 2025 & 2033
- Figure 22: North America Electronic Prescriptions Software Market Volume Share (%), by Country 2025 & 2033
- Figure 23: Europe Electronic Prescriptions Software Market Revenue (Million), by Component 2025 & 2033
- Figure 24: Europe Electronic Prescriptions Software Market Volume (K Unit), by Component 2025 & 2033
- Figure 25: Europe Electronic Prescriptions Software Market Revenue Share (%), by Component 2025 & 2033
- Figure 26: Europe Electronic Prescriptions Software Market Volume Share (%), by Component 2025 & 2033
- Figure 27: Europe Electronic Prescriptions Software Market Revenue (Million), by Type of System 2025 & 2033
- Figure 28: Europe Electronic Prescriptions Software Market Volume (K Unit), by Type of System 2025 & 2033
- Figure 29: Europe Electronic Prescriptions Software Market Revenue Share (%), by Type of System 2025 & 2033
- Figure 30: Europe Electronic Prescriptions Software Market Volume Share (%), by Type of System 2025 & 2033
- Figure 31: Europe Electronic Prescriptions Software Market Revenue (Million), by Delivery Mode 2025 & 2033
- Figure 32: Europe Electronic Prescriptions Software Market Volume (K Unit), by Delivery Mode 2025 & 2033
- Figure 33: Europe Electronic Prescriptions Software Market Revenue Share (%), by Delivery Mode 2025 & 2033
- Figure 34: Europe Electronic Prescriptions Software Market Volume Share (%), by Delivery Mode 2025 & 2033
- Figure 35: Europe Electronic Prescriptions Software Market Revenue (Million), by End Users 2025 & 2033
- Figure 36: Europe Electronic Prescriptions Software Market Volume (K Unit), by End Users 2025 & 2033
- Figure 37: Europe Electronic Prescriptions Software Market Revenue Share (%), by End Users 2025 & 2033
- Figure 38: Europe Electronic Prescriptions Software Market Volume Share (%), by End Users 2025 & 2033
- Figure 39: Europe Electronic Prescriptions Software Market Revenue (Million), by Country 2025 & 2033
- Figure 40: Europe Electronic Prescriptions Software Market Volume (K Unit), by Country 2025 & 2033
- Figure 41: Europe Electronic Prescriptions Software Market Revenue Share (%), by Country 2025 & 2033
- Figure 42: Europe Electronic Prescriptions Software Market Volume Share (%), by Country 2025 & 2033
- Figure 43: Asia Pacific Electronic Prescriptions Software Market Revenue (Million), by Component 2025 & 2033
- Figure 44: Asia Pacific Electronic Prescriptions Software Market Volume (K Unit), by Component 2025 & 2033
- Figure 45: Asia Pacific Electronic Prescriptions Software Market Revenue Share (%), by Component 2025 & 2033
- Figure 46: Asia Pacific Electronic Prescriptions Software Market Volume Share (%), by Component 2025 & 2033
- Figure 47: Asia Pacific Electronic Prescriptions Software Market Revenue (Million), by Type of System 2025 & 2033
- Figure 48: Asia Pacific Electronic Prescriptions Software Market Volume (K Unit), by Type of System 2025 & 2033
- Figure 49: Asia Pacific Electronic Prescriptions Software Market Revenue Share (%), by Type of System 2025 & 2033
- Figure 50: Asia Pacific Electronic Prescriptions Software Market Volume Share (%), by Type of System 2025 & 2033
- Figure 51: Asia Pacific Electronic Prescriptions Software Market Revenue (Million), by Delivery Mode 2025 & 2033
- Figure 52: Asia Pacific Electronic Prescriptions Software Market Volume (K Unit), by Delivery Mode 2025 & 2033
- Figure 53: Asia Pacific Electronic Prescriptions Software Market Revenue Share (%), by Delivery Mode 2025 & 2033
- Figure 54: Asia Pacific Electronic Prescriptions Software Market Volume Share (%), by Delivery Mode 2025 & 2033
- Figure 55: Asia Pacific Electronic Prescriptions Software Market Revenue (Million), by End Users 2025 & 2033
- Figure 56: Asia Pacific Electronic Prescriptions Software Market Volume (K Unit), by End Users 2025 & 2033
- Figure 57: Asia Pacific Electronic Prescriptions Software Market Revenue Share (%), by End Users 2025 & 2033
- Figure 58: Asia Pacific Electronic Prescriptions Software Market Volume Share (%), by End Users 2025 & 2033
- Figure 59: Asia Pacific Electronic Prescriptions Software Market Revenue (Million), by Country 2025 & 2033
- Figure 60: Asia Pacific Electronic Prescriptions Software Market Volume (K Unit), by Country 2025 & 2033
- Figure 61: Asia Pacific Electronic Prescriptions Software Market Revenue Share (%), by Country 2025 & 2033
- Figure 62: Asia Pacific Electronic Prescriptions Software Market Volume Share (%), by Country 2025 & 2033
- Figure 63: Middle East and Africa Electronic Prescriptions Software Market Revenue (Million), by Component 2025 & 2033
- Figure 64: Middle East and Africa Electronic Prescriptions Software Market Volume (K Unit), by Component 2025 & 2033
- Figure 65: Middle East and Africa Electronic Prescriptions Software Market Revenue Share (%), by Component 2025 & 2033
- Figure 66: Middle East and Africa Electronic Prescriptions Software Market Volume Share (%), by Component 2025 & 2033
- Figure 67: Middle East and Africa Electronic Prescriptions Software Market Revenue (Million), by Type of System 2025 & 2033
- Figure 68: Middle East and Africa Electronic Prescriptions Software Market Volume (K Unit), by Type of System 2025 & 2033
- Figure 69: Middle East and Africa Electronic Prescriptions Software Market Revenue Share (%), by Type of System 2025 & 2033
- Figure 70: Middle East and Africa Electronic Prescriptions Software Market Volume Share (%), by Type of System 2025 & 2033
- Figure 71: Middle East and Africa Electronic Prescriptions Software Market Revenue (Million), by Delivery Mode 2025 & 2033
- Figure 72: Middle East and Africa Electronic Prescriptions Software Market Volume (K Unit), by Delivery Mode 2025 & 2033
- Figure 73: Middle East and Africa Electronic Prescriptions Software Market Revenue Share (%), by Delivery Mode 2025 & 2033
- Figure 74: Middle East and Africa Electronic Prescriptions Software Market Volume Share (%), by Delivery Mode 2025 & 2033
- Figure 75: Middle East and Africa Electronic Prescriptions Software Market Revenue (Million), by End Users 2025 & 2033
- Figure 76: Middle East and Africa Electronic Prescriptions Software Market Volume (K Unit), by End Users 2025 & 2033
- Figure 77: Middle East and Africa Electronic Prescriptions Software Market Revenue Share (%), by End Users 2025 & 2033
- Figure 78: Middle East and Africa Electronic Prescriptions Software Market Volume Share (%), by End Users 2025 & 2033
- Figure 79: Middle East and Africa Electronic Prescriptions Software Market Revenue (Million), by Country 2025 & 2033
- Figure 80: Middle East and Africa Electronic Prescriptions Software Market Volume (K Unit), by Country 2025 & 2033
- Figure 81: Middle East and Africa Electronic Prescriptions Software Market Revenue Share (%), by Country 2025 & 2033
- Figure 82: Middle East and Africa Electronic Prescriptions Software Market Volume Share (%), by Country 2025 & 2033
- Figure 83: South America Electronic Prescriptions Software Market Revenue (Million), by Component 2025 & 2033
- Figure 84: South America Electronic Prescriptions Software Market Volume (K Unit), by Component 2025 & 2033
- Figure 85: South America Electronic Prescriptions Software Market Revenue Share (%), by Component 2025 & 2033
- Figure 86: South America Electronic Prescriptions Software Market Volume Share (%), by Component 2025 & 2033
- Figure 87: South America Electronic Prescriptions Software Market Revenue (Million), by Type of System 2025 & 2033
- Figure 88: South America Electronic Prescriptions Software Market Volume (K Unit), by Type of System 2025 & 2033
- Figure 89: South America Electronic Prescriptions Software Market Revenue Share (%), by Type of System 2025 & 2033
- Figure 90: South America Electronic Prescriptions Software Market Volume Share (%), by Type of System 2025 & 2033
- Figure 91: South America Electronic Prescriptions Software Market Revenue (Million), by Delivery Mode 2025 & 2033
- Figure 92: South America Electronic Prescriptions Software Market Volume (K Unit), by Delivery Mode 2025 & 2033
- Figure 93: South America Electronic Prescriptions Software Market Revenue Share (%), by Delivery Mode 2025 & 2033
- Figure 94: South America Electronic Prescriptions Software Market Volume Share (%), by Delivery Mode 2025 & 2033
- Figure 95: South America Electronic Prescriptions Software Market Revenue (Million), by End Users 2025 & 2033
- Figure 96: South America Electronic Prescriptions Software Market Volume (K Unit), by End Users 2025 & 2033
- Figure 97: South America Electronic Prescriptions Software Market Revenue Share (%), by End Users 2025 & 2033
- Figure 98: South America Electronic Prescriptions Software Market Volume Share (%), by End Users 2025 & 2033
- Figure 99: South America Electronic Prescriptions Software Market Revenue (Million), by Country 2025 & 2033
- Figure 100: South America Electronic Prescriptions Software Market Volume (K Unit), by Country 2025 & 2033
- Figure 101: South America Electronic Prescriptions Software Market Revenue Share (%), by Country 2025 & 2033
- Figure 102: South America Electronic Prescriptions Software Market Volume Share (%), by Country 2025 & 2033
List of Tables
- Table 1: Global Electronic Prescriptions Software Market Revenue Million Forecast, by Component 2020 & 2033
- Table 2: Global Electronic Prescriptions Software Market Volume K Unit Forecast, by Component 2020 & 2033
- Table 3: Global Electronic Prescriptions Software Market Revenue Million Forecast, by Type of System 2020 & 2033
- Table 4: Global Electronic Prescriptions Software Market Volume K Unit Forecast, by Type of System 2020 & 2033
- Table 5: Global Electronic Prescriptions Software Market Revenue Million Forecast, by Delivery Mode 2020 & 2033
- Table 6: Global Electronic Prescriptions Software Market Volume K Unit Forecast, by Delivery Mode 2020 & 2033
- Table 7: Global Electronic Prescriptions Software Market Revenue Million Forecast, by End Users 2020 & 2033
- Table 8: Global Electronic Prescriptions Software Market Volume K Unit Forecast, by End Users 2020 & 2033
- Table 9: Global Electronic Prescriptions Software Market Revenue Million Forecast, by Region 2020 & 2033
- Table 10: Global Electronic Prescriptions Software Market Volume K Unit Forecast, by Region 2020 & 2033
- Table 11: Global Electronic Prescriptions Software Market Revenue Million Forecast, by Component 2020 & 2033
- Table 12: Global Electronic Prescriptions Software Market Volume K Unit Forecast, by Component 2020 & 2033
- Table 13: Global Electronic Prescriptions Software Market Revenue Million Forecast, by Type of System 2020 & 2033
- Table 14: Global Electronic Prescriptions Software Market Volume K Unit Forecast, by Type of System 2020 & 2033
- Table 15: Global Electronic Prescriptions Software Market Revenue Million Forecast, by Delivery Mode 2020 & 2033
- Table 16: Global Electronic Prescriptions Software Market Volume K Unit Forecast, by Delivery Mode 2020 & 2033
- Table 17: Global Electronic Prescriptions Software Market Revenue Million Forecast, by End Users 2020 & 2033
- Table 18: Global Electronic Prescriptions Software Market Volume K Unit Forecast, by End Users 2020 & 2033
- Table 19: Global Electronic Prescriptions Software Market Revenue Million Forecast, by Country 2020 & 2033
- Table 20: Global Electronic Prescriptions Software Market Volume K Unit Forecast, by Country 2020 & 2033
- Table 21: United States Electronic Prescriptions Software Market Revenue (Million) Forecast, by Application 2020 & 2033
- Table 22: United States Electronic Prescriptions Software Market Volume (K Unit) Forecast, by Application 2020 & 2033
- Table 23: Canada Electronic Prescriptions Software Market Revenue (Million) Forecast, by Application 2020 & 2033
- Table 24: Canada Electronic Prescriptions Software Market Volume (K Unit) Forecast, by Application 2020 & 2033
- Table 25: Mexico Electronic Prescriptions Software Market Revenue (Million) Forecast, by Application 2020 & 2033
- Table 26: Mexico Electronic Prescriptions Software Market Volume (K Unit) Forecast, by Application 2020 & 2033
- Table 27: Global Electronic Prescriptions Software Market Revenue Million Forecast, by Component 2020 & 2033
- Table 28: Global Electronic Prescriptions Software Market Volume K Unit Forecast, by Component 2020 & 2033
- Table 29: Global Electronic Prescriptions Software Market Revenue Million Forecast, by Type of System 2020 & 2033
- Table 30: Global Electronic Prescriptions Software Market Volume K Unit Forecast, by Type of System 2020 & 2033
- Table 31: Global Electronic Prescriptions Software Market Revenue Million Forecast, by Delivery Mode 2020 & 2033
- Table 32: Global Electronic Prescriptions Software Market Volume K Unit Forecast, by Delivery Mode 2020 & 2033
- Table 33: Global Electronic Prescriptions Software Market Revenue Million Forecast, by End Users 2020 & 2033
- Table 34: Global Electronic Prescriptions Software Market Volume K Unit Forecast, by End Users 2020 & 2033
- Table 35: Global Electronic Prescriptions Software Market Revenue Million Forecast, by Country 2020 & 2033
- Table 36: Global Electronic Prescriptions Software Market Volume K Unit Forecast, by Country 2020 & 2033
- Table 37: Germany Electronic Prescriptions Software Market Revenue (Million) Forecast, by Application 2020 & 2033
- Table 38: Germany Electronic Prescriptions Software Market Volume (K Unit) Forecast, by Application 2020 & 2033
- Table 39: United Kingdom Electronic Prescriptions Software Market Revenue (Million) Forecast, by Application 2020 & 2033
- Table 40: United Kingdom Electronic Prescriptions Software Market Volume (K Unit) Forecast, by Application 2020 & 2033
- Table 41: France Electronic Prescriptions Software Market Revenue (Million) Forecast, by Application 2020 & 2033
- Table 42: France Electronic Prescriptions Software Market Volume (K Unit) Forecast, by Application 2020 & 2033
- Table 43: Italy Electronic Prescriptions Software Market Revenue (Million) Forecast, by Application 2020 & 2033
- Table 44: Italy Electronic Prescriptions Software Market Volume (K Unit) Forecast, by Application 2020 & 2033
- Table 45: Spain Electronic Prescriptions Software Market Revenue (Million) Forecast, by Application 2020 & 2033
- Table 46: Spain Electronic Prescriptions Software Market Volume (K Unit) Forecast, by Application 2020 & 2033
- Table 47: Rest of Europe Electronic Prescriptions Software Market Revenue (Million) Forecast, by Application 2020 & 2033
- Table 48: Rest of Europe Electronic Prescriptions Software Market Volume (K Unit) Forecast, by Application 2020 & 2033
- Table 49: Global Electronic Prescriptions Software Market Revenue Million Forecast, by Component 2020 & 2033
- Table 50: Global Electronic Prescriptions Software Market Volume K Unit Forecast, by Component 2020 & 2033
- Table 51: Global Electronic Prescriptions Software Market Revenue Million Forecast, by Type of System 2020 & 2033
- Table 52: Global Electronic Prescriptions Software Market Volume K Unit Forecast, by Type of System 2020 & 2033
- Table 53: Global Electronic Prescriptions Software Market Revenue Million Forecast, by Delivery Mode 2020 & 2033
- Table 54: Global Electronic Prescriptions Software Market Volume K Unit Forecast, by Delivery Mode 2020 & 2033
- Table 55: Global Electronic Prescriptions Software Market Revenue Million Forecast, by End Users 2020 & 2033
- Table 56: Global Electronic Prescriptions Software Market Volume K Unit Forecast, by End Users 2020 & 2033
- Table 57: Global Electronic Prescriptions Software Market Revenue Million Forecast, by Country 2020 & 2033
- Table 58: Global Electronic Prescriptions Software Market Volume K Unit Forecast, by Country 2020 & 2033
- Table 59: China Electronic Prescriptions Software Market Revenue (Million) Forecast, by Application 2020 & 2033
- Table 60: China Electronic Prescriptions Software Market Volume (K Unit) Forecast, by Application 2020 & 2033
- Table 61: Japan Electronic Prescriptions Software Market Revenue (Million) Forecast, by Application 2020 & 2033
- Table 62: Japan Electronic Prescriptions Software Market Volume (K Unit) Forecast, by Application 2020 & 2033
- Table 63: India Electronic Prescriptions Software Market Revenue (Million) Forecast, by Application 2020 & 2033
- Table 64: India Electronic Prescriptions Software Market Volume (K Unit) Forecast, by Application 2020 & 2033
- Table 65: Australia Electronic Prescriptions Software Market Revenue (Million) Forecast, by Application 2020 & 2033
- Table 66: Australia Electronic Prescriptions Software Market Volume (K Unit) Forecast, by Application 2020 & 2033
- Table 67: South Korea Electronic Prescriptions Software Market Revenue (Million) Forecast, by Application 2020 & 2033
- Table 68: South Korea Electronic Prescriptions Software Market Volume (K Unit) Forecast, by Application 2020 & 2033
- Table 69: Rest of Asia Pacific Electronic Prescriptions Software Market Revenue (Million) Forecast, by Application 2020 & 2033
- Table 70: Rest of Asia Pacific Electronic Prescriptions Software Market Volume (K Unit) Forecast, by Application 2020 & 2033
- Table 71: Global Electronic Prescriptions Software Market Revenue Million Forecast, by Component 2020 & 2033
- Table 72: Global Electronic Prescriptions Software Market Volume K Unit Forecast, by Component 2020 & 2033
- Table 73: Global Electronic Prescriptions Software Market Revenue Million Forecast, by Type of System 2020 & 2033
- Table 74: Global Electronic Prescriptions Software Market Volume K Unit Forecast, by Type of System 2020 & 2033
- Table 75: Global Electronic Prescriptions Software Market Revenue Million Forecast, by Delivery Mode 2020 & 2033
- Table 76: Global Electronic Prescriptions Software Market Volume K Unit Forecast, by Delivery Mode 2020 & 2033
- Table 77: Global Electronic Prescriptions Software Market Revenue Million Forecast, by End Users 2020 & 2033
- Table 78: Global Electronic Prescriptions Software Market Volume K Unit Forecast, by End Users 2020 & 2033
- Table 79: Global Electronic Prescriptions Software Market Revenue Million Forecast, by Country 2020 & 2033
- Table 80: Global Electronic Prescriptions Software Market Volume K Unit Forecast, by Country 2020 & 2033
- Table 81: GCC Electronic Prescriptions Software Market Revenue (Million) Forecast, by Application 2020 & 2033
- Table 82: GCC Electronic Prescriptions Software Market Volume (K Unit) Forecast, by Application 2020 & 2033
- Table 83: South Africa Electronic Prescriptions Software Market Revenue (Million) Forecast, by Application 2020 & 2033
- Table 84: South Africa Electronic Prescriptions Software Market Volume (K Unit) Forecast, by Application 2020 & 2033
- Table 85: Rest of Middle East and Africa Electronic Prescriptions Software Market Revenue (Million) Forecast, by Application 2020 & 2033
- Table 86: Rest of Middle East and Africa Electronic Prescriptions Software Market Volume (K Unit) Forecast, by Application 2020 & 2033
- Table 87: Global Electronic Prescriptions Software Market Revenue Million Forecast, by Component 2020 & 2033
- Table 88: Global Electronic Prescriptions Software Market Volume K Unit Forecast, by Component 2020 & 2033
- Table 89: Global Electronic Prescriptions Software Market Revenue Million Forecast, by Type of System 2020 & 2033
- Table 90: Global Electronic Prescriptions Software Market Volume K Unit Forecast, by Type of System 2020 & 2033
- Table 91: Global Electronic Prescriptions Software Market Revenue Million Forecast, by Delivery Mode 2020 & 2033
- Table 92: Global Electronic Prescriptions Software Market Volume K Unit Forecast, by Delivery Mode 2020 & 2033
- Table 93: Global Electronic Prescriptions Software Market Revenue Million Forecast, by End Users 2020 & 2033
- Table 94: Global Electronic Prescriptions Software Market Volume K Unit Forecast, by End Users 2020 & 2033
- Table 95: Global Electronic Prescriptions Software Market Revenue Million Forecast, by Country 2020 & 2033
- Table 96: Global Electronic Prescriptions Software Market Volume K Unit Forecast, by Country 2020 & 2033
- Table 97: Brazil Electronic Prescriptions Software Market Revenue (Million) Forecast, by Application 2020 & 2033
- Table 98: Brazil Electronic Prescriptions Software Market Volume (K Unit) Forecast, by Application 2020 & 2033
- Table 99: Argentina Electronic Prescriptions Software Market Revenue (Million) Forecast, by Application 2020 & 2033
- Table 100: Argentina Electronic Prescriptions Software Market Volume (K Unit) Forecast, by Application 2020 & 2033
- Table 101: Rest of South America Electronic Prescriptions Software Market Revenue (Million) Forecast, by Application 2020 & 2033
- Table 102: Rest of South America Electronic Prescriptions Software Market Volume (K Unit) Forecast, by Application 2020 & 2033
Frequently Asked Questions
1. What is the projected Compound Annual Growth Rate (CAGR) of the Electronic Prescriptions Software Market?
The projected CAGR is approximately 24.19%.
2. Which companies are prominent players in the Electronic Prescriptions Software Market?
Key companies in the market include eMDs Inc, Oracle (Cerner Corporation), eClinicalWorks, Surescripts, Relayhealth Corporation, Allscripts Healthcare Solutions Inc (Veradigm), NextGen Healthcare Inc, DrFirst, Athenahealth Inc.
3. What are the main segments of the Electronic Prescriptions Software Market?
The market segments include Component, Type of System, Delivery Mode, End Users.
4. Can you provide details about the market size?
The market size is estimated to be USD 3.39 Million as of 2022.
5. What are some drivers contributing to market growth?
Minimisation of Prescription Errors; Rising Demand for E-prescription System; Better Quality of Healthcare and Cost Reduction.
6. What are the notable trends driving market growth?
Stand-alone E-prescribing System Segment is Expected to Witness Growth Over the Forecast Period.
7. Are there any restraints impacting market growth?
Security and Workflow Issues; Lack of Skilled Personnel to Handle the Systems.
8. Can you provide examples of recent developments in the market?
In March 2022, FDB (First Databank, Inc.), launched FDB Vela, a new, cloud-native e-prescribing network that enables the seamless flow of critical medication prescription information, benefits verification, and clinical decision support between prescribers, payers, pharmacies, and other constituents.
9. What pricing options are available for accessing the report?
Pricing options include single-user, multi-user, and enterprise licenses priced at USD 4750, USD 5250, and USD 8750 respectively.
10. Is the market size provided in terms of value or volume?
The market size is provided in terms of value, measured in Million and volume, measured in K Unit.
11. Are there any specific market keywords associated with the report?
Yes, the market keyword associated with the report is "Electronic Prescriptions Software Market," which aids in identifying and referencing the specific market segment covered.
12. How do I determine which pricing option suits my needs best?
The pricing options vary based on user requirements and access needs. Individual users may opt for single-user licenses, while businesses requiring broader access may choose multi-user or enterprise licenses for cost-effective access to the report.
13. Are there any additional resources or data provided in the Electronic Prescriptions Software Market report?
While the report offers comprehensive insights, it's advisable to review the specific contents or supplementary materials provided to ascertain if additional resources or data are available.
14. How can I stay updated on further developments or reports in the Electronic Prescriptions Software Market?
To stay informed about further developments, trends, and reports in the Electronic Prescriptions Software Market, consider subscribing to industry newsletters, following relevant companies and organizations, or regularly checking reputable industry news sources and publications.
Methodology
Step 1 - Identification of Relevant Samples Size from Population Database


Step 2 - Approaches for Defining Global Market Size (Value, Volume* & Price*)

Note*: In applicable scenarios
Step 3 - Data Sources
Primary Research
- Web Analytics
- Survey Reports
- Research Institute
- Latest Research Reports
- Opinion Leaders
Secondary Research
- Annual Reports
- White Paper
- Latest Press Release
- Industry Association
- Paid Database
- Investor Presentations

Step 4 - Data Triangulation
Involves using different sources of information in order to increase the validity of a study
These sources are likely to be stakeholders in a program - participants, other researchers, program staff, other community members, and so on.
Then we put all data in single framework & apply various statistical tools to find out the dynamic on the market.
During the analysis stage, feedback from the stakeholder groups would be compared to determine areas of agreement as well as areas of divergence