
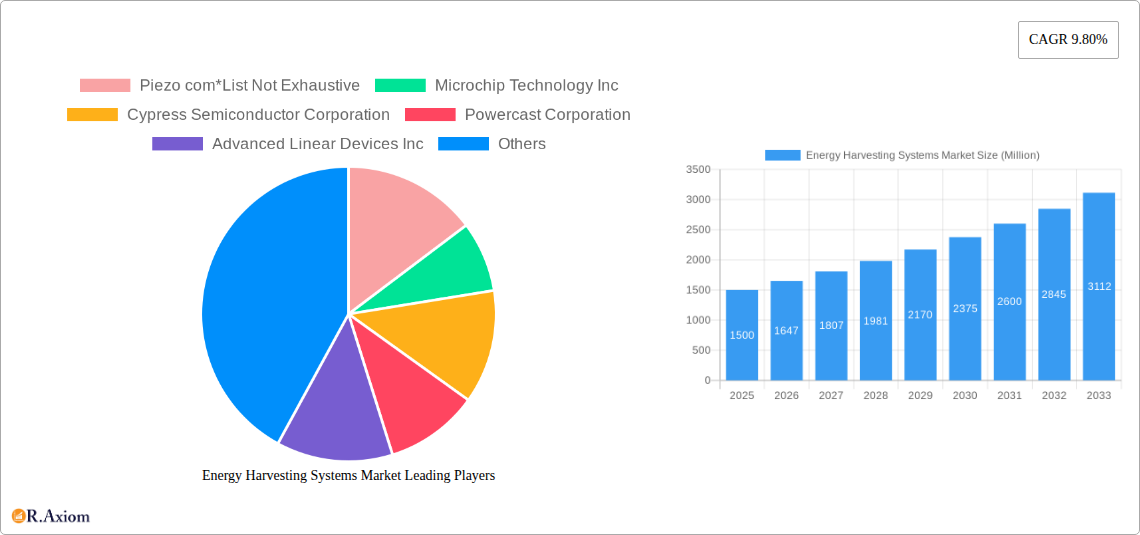
Key Insights
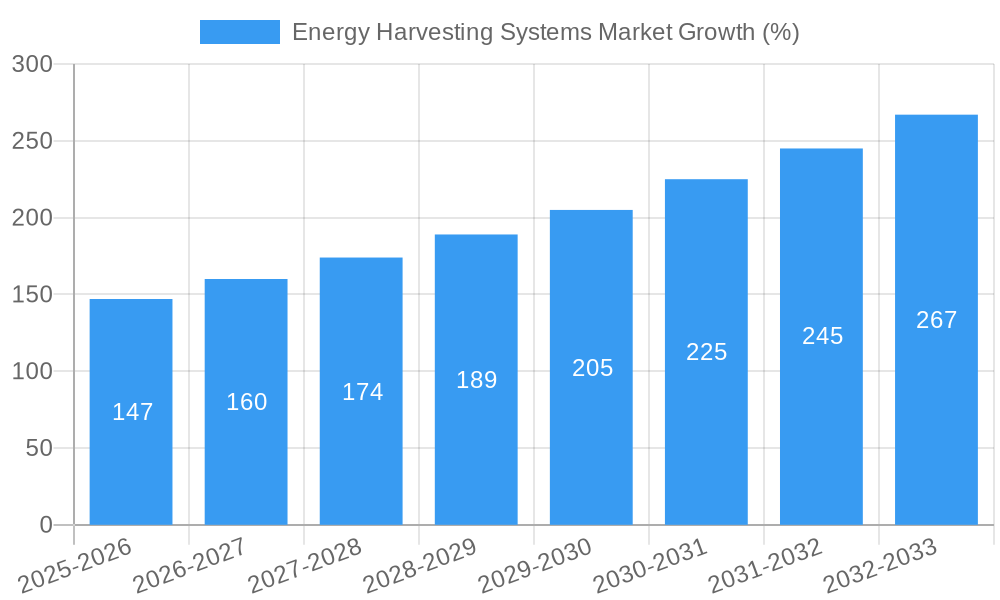
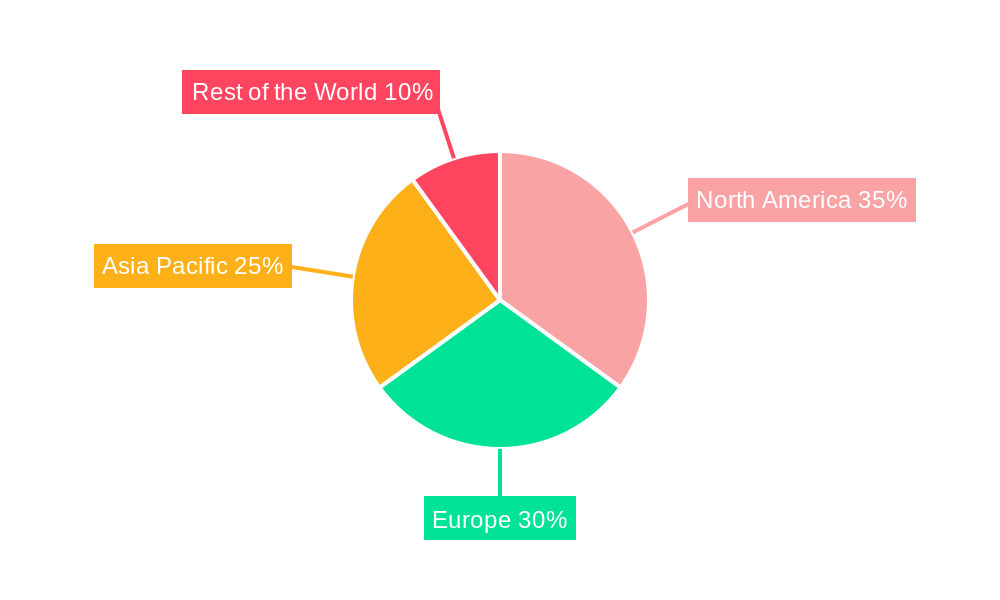
The Energy Harvesting Systems market is experiencing robust growth, projected to reach a substantial size driven by increasing demand for sustainable and self-powered devices across various sectors. The market's 9.80% CAGR from 2019 to 2033 indicates a significant upward trajectory, fueled by several key factors. The rising adoption of IoT devices, coupled with the growing need for energy independence in remote sensing and monitoring applications, is a major driver. Technological advancements in energy harvesting techniques, particularly in improving efficiency and power output of Light, Vibration, Thermal, and RF energy harvesting methods, are further propelling market expansion. Consumer electronics, building and home automation, and industrial applications are leading segments, with the automotive sector showing promising growth potential. While initial investment costs and limitations in energy density remain as restraints, ongoing research and development efforts are continuously addressing these challenges, leading to improved cost-effectiveness and higher power output in the coming years. The market is segmented by technology (Light, Vibration, Thermal, RF) and application (Consumer Electronics, Building & Home Automation, Industrial, Transportation, Other). North America and Europe currently hold significant market shares due to established infrastructure and technological advancements, but the Asia Pacific region is expected to witness substantial growth fueled by rapid industrialization and increasing adoption of smart technologies. This growth will be further augmented by government initiatives promoting renewable energy solutions and reducing carbon footprint.
The competitive landscape is characterized by a mix of established players and emerging companies specializing in different energy harvesting technologies. Major players such as Piezo Kinetics, Microchip Technology Inc., Cypress Semiconductor Corporation, and Texas Instruments are actively involved in developing and commercializing advanced solutions, fostering innovation and competition. The forecast period (2025-2033) promises continued expansion, driven by the factors outlined above. While challenges persist, the long-term outlook for the Energy Harvesting Systems market remains positive, offering significant opportunities for growth and investment across the value chain. This expanding market is poised to play a vital role in enabling the next generation of self-powered, sustainable technologies.
Energy Harvesting Systems Market: A Comprehensive Report (2019-2033)
This in-depth report provides a comprehensive analysis of the Energy Harvesting Systems market, covering historical data (2019-2024), the current state (2025), and future projections (2025-2033). It delves into market dynamics, competitive landscapes, technological advancements, and emerging opportunities, offering actionable insights for stakeholders across the industry. The report utilizes a robust methodology, incorporating both qualitative and quantitative data to provide a clear and concise picture of this rapidly evolving market. The total market size is predicted to reach xx Million by 2033, exhibiting a CAGR of xx% during the forecast period.
Energy Harvesting Systems Market Market Concentration & Innovation
The Energy Harvesting Systems market exhibits a moderately concentrated landscape, with several key players holding significant market share. However, the market is also characterized by a high degree of innovation, driven by advancements in materials science, microelectronics, and energy conversion technologies. This leads to a dynamic competitive environment where smaller, specialized firms can also thrive. The market share of the top five players is estimated to be around xx%, leaving ample opportunity for new entrants and expansion for existing players. M&A activity has been relatively moderate in recent years, with deal values averaging around xx Million per transaction. However, the increasing strategic importance of energy harvesting technologies is expected to fuel future consolidation.
- Market Concentration: Moderately concentrated, with top 5 players holding approximately xx% market share.
- Innovation Drivers: Advancements in materials science, microelectronics, and energy conversion.
- Regulatory Frameworks: Varying regulations across different regions impacting market growth and adoption.
- Product Substitutes: Traditional power sources (batteries) remain primary substitutes, but energy harvesting offers advantages in specific applications.
- End-User Trends: Increasing demand for energy-efficient and self-powered devices across various sectors.
- M&A Activities: Moderate activity in recent years, with average deal values around xx Million.
Energy Harvesting Systems Market Industry Trends & Insights
The Energy Harvesting Systems market is experiencing robust growth, fueled by several key factors. The increasing demand for portable and wireless devices, coupled with growing concerns about environmental sustainability and energy efficiency, is driving the adoption of energy harvesting technologies. Technological advancements, such as the development of more efficient energy conversion materials and improved power management ICs, are further accelerating market growth. Consumer preferences are shifting towards sustainable and eco-friendly products, creating significant demand for energy harvesting solutions. The competitive landscape is dynamic, with established players and new entrants vying for market share, leading to continuous product innovation and price competition. The market is expected to maintain a healthy CAGR of xx% over the forecast period, with significant market penetration across various applications.
Dominant Markets & Segments in Energy Harvesting Systems Market
The Energy Harvesting Systems market is witnessing significant growth across various segments and regions. While the global market is expanding, certain regions and applications demonstrate faster growth rates.
By Technology:
- RF Energy Harvesting: This segment is experiencing rapid growth due to the increasing demand for wireless power transfer solutions in consumer electronics and IoT devices. Key drivers include the proliferation of smart devices and the desire for battery-free operation.
- Vibration Energy Harvesting: This segment is driven by the growing adoption of energy harvesting in industrial and transportation applications, where vibrations are abundant.
- Light Energy Harvesting: Growth in this sector is fueled by the increasing demand for solar-powered devices in consumer electronics and building automation.
- Thermal Energy Harvesting: This technology is gaining traction in applications where waste heat is readily available, such as industrial processes and automotive systems.
By Application:
- Consumer Electronics: This segment is the largest and fastest-growing, driven by the rising demand for self-powered wearables and IoT devices.
- Building and Home Automation: Growth is driven by the increasing demand for energy-efficient building management systems and smart home appliances.
- Industrial: This segment is experiencing significant growth, driven by the adoption of energy harvesting in industrial automation and monitoring systems.
- Transportation: Energy harvesting is gaining traction in transportation applications, such as powering sensors and communication systems in vehicles.
Dominant Regions: North America and Europe currently hold the largest market shares, primarily due to higher adoption rates and technological advancements. However, Asia-Pacific is expected to demonstrate the highest growth rate over the forecast period, driven by rapid industrialization and economic growth.
Energy Harvesting Systems Market Product Developments
Recent product innovations have focused on improving energy conversion efficiency, miniaturization, and cost reduction. The development of advanced materials and improved power management integrated circuits (PMICs) has led to smaller, more efficient, and cost-effective energy harvesting solutions. Companies are also focusing on integrating energy harvesting capabilities into existing products and developing new applications for these technologies. For example, the launch of ultra-compact PMICs for wearables represents a significant advancement, improving the functionality and aesthetics of energy harvesting devices.
Report Scope & Segmentation Analysis
This report provides a comprehensive analysis of the Energy Harvesting Systems market, segmented by technology (Light Energy Harvesting, Vibration Energy Harvesting, Thermal Energy Harvesting, RF Energy Harvesting) and application (Consumer Electronics, Building and Home Automation, Industrial, Transportation, Other Applications). Each segment is analyzed in detail, providing market size, growth projections, and competitive dynamics. The growth projections are based on various factors, including technological advancements, regulatory changes, and market trends. Competitive dynamics vary across segments, with some experiencing intense competition and others characterized by niche players.
Key Drivers of Energy Harvesting Systems Market Growth
The growth of the Energy Harvesting Systems market is primarily driven by:
- Increasing demand for portable and wireless devices: The rising popularity of wearables, IoT devices, and other portable electronics is creating a need for self-powered solutions.
- Growing concerns about environmental sustainability: The desire to reduce reliance on batteries and improve energy efficiency is promoting the adoption of energy harvesting.
- Technological advancements: Advancements in materials science, microelectronics, and energy conversion technologies are leading to more efficient and cost-effective solutions.
- Government support and regulations: Various governments are promoting the adoption of renewable energy technologies through subsidies and incentives, indirectly benefiting the energy harvesting market.
Challenges in the Energy Harvesting Systems Market Sector
The Energy Harvesting Systems market faces several challenges:
- Low energy density: Energy harvesting technologies often have lower energy density compared to traditional batteries, limiting their applications.
- Cost of components: The cost of some energy harvesting components can be high, making it less competitive in certain markets.
- Environmental factors: The performance of some energy harvesting systems can be affected by environmental conditions like temperature and light levels. This can impact reliability and output power.
- Integration complexities: Integrating energy harvesting systems into existing products can be complex and require specialized expertise.
Emerging Opportunities in Energy Harvesting Systems Market
Several emerging opportunities are expected to drive growth in the Energy Harvesting Systems market:
- Growth of the Internet of Things (IoT): The proliferation of IoT devices will create a huge demand for low-power, self-powered sensors and actuators.
- Advancements in flexible and wearable electronics: Energy harvesting technologies are increasingly being incorporated into flexible and wearable devices.
- Development of energy harvesting solutions for infrastructure: Energy harvesting can be used to power sensors and monitoring systems in infrastructure applications, reducing maintenance costs and improving safety.
- Increased focus on sustainability and energy efficiency: Government regulations and consumer preferences are driving the adoption of sustainable energy technologies, including energy harvesting.
Leading Players in the Energy Harvesting Systems Market Market
- Piezo Systems
- Microchip Technology Inc
- Cypress Semiconductor Corporation
- Powercast Corporation
- Advanced Linear Devices Inc
- STMicroelectronics NV
- E-Peas SA
- Texas Instruments Incorporated
- Enocean GmbH
- Analog Devices Inc
- ABB Limited
Key Developments in Energy Harvesting Systems Market Industry
- March 2022: Powercast Corporation announced shipping 10 Million wireless RF Powerharvester PCC110 chips in two years, highlighting the growing demand for wireless power-over-distance solutions.
- January 2022: E-Peas SA launched an ultra-compact power management solution for Cartier's solar-powered watch, showcasing miniaturization advancements.
- January 2022: Advanced Linear Devices, Inc. announced a nano-powder precision P-Channel EPAD MOSFET array for low-power applications, improving energy harvesting efficiency in various sectors.
Strategic Outlook for Energy Harvesting Systems Market Market
The future of the Energy Harvesting Systems market appears bright, driven by continuous technological advancements, increasing environmental awareness, and expanding applications across various sectors. The market is poised for significant growth, particularly in emerging economies. Continued innovation in energy conversion technologies, coupled with a growing demand for sustainable energy solutions, will fuel further expansion in the coming years. Strategic partnerships and collaborations between technology providers and end-users will play a critical role in accelerating market adoption and realizing the full potential of energy harvesting.
Energy Harvesting Systems Market Segmentation
-
1. Technology
- 1.1. Light Energy Harvesting
- 1.2. Vibration Energy Harvesting
- 1.3. Thermal Energy Harvesting
- 1.4. RF Energy Harvesting
-
2. Application
- 2.1. Consumer Electronics
- 2.2. Building and Home Automation
- 2.3. Industrial
- 2.4. Transportation
- 2.5. Other Applications
Energy Harvesting Systems Market Segmentation By Geography
- 1. North America
- 2. Europe
- 3. Asia Pacific
- 4. Rest of the World
Energy Harvesting Systems Market REPORT HIGHLIGHTS
| Aspects | Details |
|---|---|
| Study Period | 2019-2033 |
| Base Year | 2024 |
| Estimated Year | 2025 |
| Forecast Period | 2025-2033 |
| Historical Period | 2019-2024 |
| Growth Rate | CAGR of 9.80% from 2019-2033 |
| Segmentation |
|
Table of Contents
- 1. Introduction
- 1.1. Research Scope
- 1.2. Market Segmentation
- 1.3. Research Methodology
- 1.4. Definitions and Assumptions
- 2. Executive Summary
- 2.1. Introduction
- 3. Market Dynamics
- 3.1. Introduction
- 3.2. Market Drivers
- 3.2.1. Growth of Smart Cities; Technology Developments in Manufacturing Industries
- 3.3. Market Restrains
- 3.3.1. Increasing Complexity of Design
- 3.4. Market Trends
- 3.4.1. Consumer Electronics to Hold Significant Market Share
- 4. Market Factor Analysis
- 4.1. Porters Five Forces
- 4.2. Supply/Value Chain
- 4.3. PESTEL analysis
- 4.4. Market Entropy
- 4.5. Patent/Trademark Analysis
- 5. Global Energy Harvesting Systems Market Analysis, Insights and Forecast, 2019-2031
- 5.1. Market Analysis, Insights and Forecast - by Technology
- 5.1.1. Light Energy Harvesting
- 5.1.2. Vibration Energy Harvesting
- 5.1.3. Thermal Energy Harvesting
- 5.1.4. RF Energy Harvesting
- 5.2. Market Analysis, Insights and Forecast - by Application
- 5.2.1. Consumer Electronics
- 5.2.2. Building and Home Automation
- 5.2.3. Industrial
- 5.2.4. Transportation
- 5.2.5. Other Applications
- 5.3. Market Analysis, Insights and Forecast - by Region
- 5.3.1. North America
- 5.3.2. Europe
- 5.3.3. Asia Pacific
- 5.3.4. Rest of the World
- 5.1. Market Analysis, Insights and Forecast - by Technology
- 6. North America Energy Harvesting Systems Market Analysis, Insights and Forecast, 2019-2031
- 6.1. Market Analysis, Insights and Forecast - by Technology
- 6.1.1. Light Energy Harvesting
- 6.1.2. Vibration Energy Harvesting
- 6.1.3. Thermal Energy Harvesting
- 6.1.4. RF Energy Harvesting
- 6.2. Market Analysis, Insights and Forecast - by Application
- 6.2.1. Consumer Electronics
- 6.2.2. Building and Home Automation
- 6.2.3. Industrial
- 6.2.4. Transportation
- 6.2.5. Other Applications
- 6.1. Market Analysis, Insights and Forecast - by Technology
- 7. Europe Energy Harvesting Systems Market Analysis, Insights and Forecast, 2019-2031
- 7.1. Market Analysis, Insights and Forecast - by Technology
- 7.1.1. Light Energy Harvesting
- 7.1.2. Vibration Energy Harvesting
- 7.1.3. Thermal Energy Harvesting
- 7.1.4. RF Energy Harvesting
- 7.2. Market Analysis, Insights and Forecast - by Application
- 7.2.1. Consumer Electronics
- 7.2.2. Building and Home Automation
- 7.2.3. Industrial
- 7.2.4. Transportation
- 7.2.5. Other Applications
- 7.1. Market Analysis, Insights and Forecast - by Technology
- 8. Asia Pacific Energy Harvesting Systems Market Analysis, Insights and Forecast, 2019-2031
- 8.1. Market Analysis, Insights and Forecast - by Technology
- 8.1.1. Light Energy Harvesting
- 8.1.2. Vibration Energy Harvesting
- 8.1.3. Thermal Energy Harvesting
- 8.1.4. RF Energy Harvesting
- 8.2. Market Analysis, Insights and Forecast - by Application
- 8.2.1. Consumer Electronics
- 8.2.2. Building and Home Automation
- 8.2.3. Industrial
- 8.2.4. Transportation
- 8.2.5. Other Applications
- 8.1. Market Analysis, Insights and Forecast - by Technology
- 9. Rest of the World Energy Harvesting Systems Market Analysis, Insights and Forecast, 2019-2031
- 9.1. Market Analysis, Insights and Forecast - by Technology
- 9.1.1. Light Energy Harvesting
- 9.1.2. Vibration Energy Harvesting
- 9.1.3. Thermal Energy Harvesting
- 9.1.4. RF Energy Harvesting
- 9.2. Market Analysis, Insights and Forecast - by Application
- 9.2.1. Consumer Electronics
- 9.2.2. Building and Home Automation
- 9.2.3. Industrial
- 9.2.4. Transportation
- 9.2.5. Other Applications
- 9.1. Market Analysis, Insights and Forecast - by Technology
- 10. North America Energy Harvesting Systems Market Analysis, Insights and Forecast, 2019-2031
- 10.1. Market Analysis, Insights and Forecast - By Country/Sub-region
- 10.1.1.
- 11. Europe Energy Harvesting Systems Market Analysis, Insights and Forecast, 2019-2031
- 11.1. Market Analysis, Insights and Forecast - By Country/Sub-region
- 11.1.1.
- 12. Asia Pacific Energy Harvesting Systems Market Analysis, Insights and Forecast, 2019-2031
- 12.1. Market Analysis, Insights and Forecast - By Country/Sub-region
- 12.1.1.
- 13. Rest of the World Energy Harvesting Systems Market Analysis, Insights and Forecast, 2019-2031
- 13.1. Market Analysis, Insights and Forecast - By Country/Sub-region
- 13.1.1.
- 14. Competitive Analysis
- 14.1. Global Market Share Analysis 2024
- 14.2. Company Profiles
- 14.2.1 Piezo com*List Not Exhaustive
- 14.2.1.1. Overview
- 14.2.1.2. Products
- 14.2.1.3. SWOT Analysis
- 14.2.1.4. Recent Developments
- 14.2.1.5. Financials (Based on Availability)
- 14.2.2 Microchip Technology Inc
- 14.2.2.1. Overview
- 14.2.2.2. Products
- 14.2.2.3. SWOT Analysis
- 14.2.2.4. Recent Developments
- 14.2.2.5. Financials (Based on Availability)
- 14.2.3 Cypress Semiconductor Corporation
- 14.2.3.1. Overview
- 14.2.3.2. Products
- 14.2.3.3. SWOT Analysis
- 14.2.3.4. Recent Developments
- 14.2.3.5. Financials (Based on Availability)
- 14.2.4 Powercast Corporation
- 14.2.4.1. Overview
- 14.2.4.2. Products
- 14.2.4.3. SWOT Analysis
- 14.2.4.4. Recent Developments
- 14.2.4.5. Financials (Based on Availability)
- 14.2.5 Advanced Linear Devices Inc
- 14.2.5.1. Overview
- 14.2.5.2. Products
- 14.2.5.3. SWOT Analysis
- 14.2.5.4. Recent Developments
- 14.2.5.5. Financials (Based on Availability)
- 14.2.6 STMicroelectronics NV
- 14.2.6.1. Overview
- 14.2.6.2. Products
- 14.2.6.3. SWOT Analysis
- 14.2.6.4. Recent Developments
- 14.2.6.5. Financials (Based on Availability)
- 14.2.7 E-Peas SA
- 14.2.7.1. Overview
- 14.2.7.2. Products
- 14.2.7.3. SWOT Analysis
- 14.2.7.4. Recent Developments
- 14.2.7.5. Financials (Based on Availability)
- 14.2.8 Texas Instruments Incorporated
- 14.2.8.1. Overview
- 14.2.8.2. Products
- 14.2.8.3. SWOT Analysis
- 14.2.8.4. Recent Developments
- 14.2.8.5. Financials (Based on Availability)
- 14.2.9 EnoCean GmbH
- 14.2.9.1. Overview
- 14.2.9.2. Products
- 14.2.9.3. SWOT Analysis
- 14.2.9.4. Recent Developments
- 14.2.9.5. Financials (Based on Availability)
- 14.2.10 Analog Devices Inc
- 14.2.10.1. Overview
- 14.2.10.2. Products
- 14.2.10.3. SWOT Analysis
- 14.2.10.4. Recent Developments
- 14.2.10.5. Financials (Based on Availability)
- 14.2.11 ABB Limited
- 14.2.11.1. Overview
- 14.2.11.2. Products
- 14.2.11.3. SWOT Analysis
- 14.2.11.4. Recent Developments
- 14.2.11.5. Financials (Based on Availability)
- 14.2.1 Piezo com*List Not Exhaustive
List of Figures
- Figure 1: Global Energy Harvesting Systems Market Revenue Breakdown (Million, %) by Region 2024 & 2032
- Figure 2: North America Energy Harvesting Systems Market Revenue (Million), by Country 2024 & 2032
- Figure 3: North America Energy Harvesting Systems Market Revenue Share (%), by Country 2024 & 2032
- Figure 4: Europe Energy Harvesting Systems Market Revenue (Million), by Country 2024 & 2032
- Figure 5: Europe Energy Harvesting Systems Market Revenue Share (%), by Country 2024 & 2032
- Figure 6: Asia Pacific Energy Harvesting Systems Market Revenue (Million), by Country 2024 & 2032
- Figure 7: Asia Pacific Energy Harvesting Systems Market Revenue Share (%), by Country 2024 & 2032
- Figure 8: Rest of the World Energy Harvesting Systems Market Revenue (Million), by Country 2024 & 2032
- Figure 9: Rest of the World Energy Harvesting Systems Market Revenue Share (%), by Country 2024 & 2032
- Figure 10: North America Energy Harvesting Systems Market Revenue (Million), by Technology 2024 & 2032
- Figure 11: North America Energy Harvesting Systems Market Revenue Share (%), by Technology 2024 & 2032
- Figure 12: North America Energy Harvesting Systems Market Revenue (Million), by Application 2024 & 2032
- Figure 13: North America Energy Harvesting Systems Market Revenue Share (%), by Application 2024 & 2032
- Figure 14: North America Energy Harvesting Systems Market Revenue (Million), by Country 2024 & 2032
- Figure 15: North America Energy Harvesting Systems Market Revenue Share (%), by Country 2024 & 2032
- Figure 16: Europe Energy Harvesting Systems Market Revenue (Million), by Technology 2024 & 2032
- Figure 17: Europe Energy Harvesting Systems Market Revenue Share (%), by Technology 2024 & 2032
- Figure 18: Europe Energy Harvesting Systems Market Revenue (Million), by Application 2024 & 2032
- Figure 19: Europe Energy Harvesting Systems Market Revenue Share (%), by Application 2024 & 2032
- Figure 20: Europe Energy Harvesting Systems Market Revenue (Million), by Country 2024 & 2032
- Figure 21: Europe Energy Harvesting Systems Market Revenue Share (%), by Country 2024 & 2032
- Figure 22: Asia Pacific Energy Harvesting Systems Market Revenue (Million), by Technology 2024 & 2032
- Figure 23: Asia Pacific Energy Harvesting Systems Market Revenue Share (%), by Technology 2024 & 2032
- Figure 24: Asia Pacific Energy Harvesting Systems Market Revenue (Million), by Application 2024 & 2032
- Figure 25: Asia Pacific Energy Harvesting Systems Market Revenue Share (%), by Application 2024 & 2032
- Figure 26: Asia Pacific Energy Harvesting Systems Market Revenue (Million), by Country 2024 & 2032
- Figure 27: Asia Pacific Energy Harvesting Systems Market Revenue Share (%), by Country 2024 & 2032
- Figure 28: Rest of the World Energy Harvesting Systems Market Revenue (Million), by Technology 2024 & 2032
- Figure 29: Rest of the World Energy Harvesting Systems Market Revenue Share (%), by Technology 2024 & 2032
- Figure 30: Rest of the World Energy Harvesting Systems Market Revenue (Million), by Application 2024 & 2032
- Figure 31: Rest of the World Energy Harvesting Systems Market Revenue Share (%), by Application 2024 & 2032
- Figure 32: Rest of the World Energy Harvesting Systems Market Revenue (Million), by Country 2024 & 2032
- Figure 33: Rest of the World Energy Harvesting Systems Market Revenue Share (%), by Country 2024 & 2032
List of Tables
- Table 1: Global Energy Harvesting Systems Market Revenue Million Forecast, by Region 2019 & 2032
- Table 2: Global Energy Harvesting Systems Market Revenue Million Forecast, by Technology 2019 & 2032
- Table 3: Global Energy Harvesting Systems Market Revenue Million Forecast, by Application 2019 & 2032
- Table 4: Global Energy Harvesting Systems Market Revenue Million Forecast, by Region 2019 & 2032
- Table 5: Global Energy Harvesting Systems Market Revenue Million Forecast, by Country 2019 & 2032
- Table 6: Energy Harvesting Systems Market Revenue (Million) Forecast, by Application 2019 & 2032
- Table 7: Global Energy Harvesting Systems Market Revenue Million Forecast, by Country 2019 & 2032
- Table 8: Energy Harvesting Systems Market Revenue (Million) Forecast, by Application 2019 & 2032
- Table 9: Global Energy Harvesting Systems Market Revenue Million Forecast, by Country 2019 & 2032
- Table 10: Energy Harvesting Systems Market Revenue (Million) Forecast, by Application 2019 & 2032
- Table 11: Global Energy Harvesting Systems Market Revenue Million Forecast, by Country 2019 & 2032
- Table 12: Energy Harvesting Systems Market Revenue (Million) Forecast, by Application 2019 & 2032
- Table 13: Global Energy Harvesting Systems Market Revenue Million Forecast, by Technology 2019 & 2032
- Table 14: Global Energy Harvesting Systems Market Revenue Million Forecast, by Application 2019 & 2032
- Table 15: Global Energy Harvesting Systems Market Revenue Million Forecast, by Country 2019 & 2032
- Table 16: Global Energy Harvesting Systems Market Revenue Million Forecast, by Technology 2019 & 2032
- Table 17: Global Energy Harvesting Systems Market Revenue Million Forecast, by Application 2019 & 2032
- Table 18: Global Energy Harvesting Systems Market Revenue Million Forecast, by Country 2019 & 2032
- Table 19: Global Energy Harvesting Systems Market Revenue Million Forecast, by Technology 2019 & 2032
- Table 20: Global Energy Harvesting Systems Market Revenue Million Forecast, by Application 2019 & 2032
- Table 21: Global Energy Harvesting Systems Market Revenue Million Forecast, by Country 2019 & 2032
- Table 22: Global Energy Harvesting Systems Market Revenue Million Forecast, by Technology 2019 & 2032
- Table 23: Global Energy Harvesting Systems Market Revenue Million Forecast, by Application 2019 & 2032
- Table 24: Global Energy Harvesting Systems Market Revenue Million Forecast, by Country 2019 & 2032
Frequently Asked Questions
1. What is the projected Compound Annual Growth Rate (CAGR) of the Energy Harvesting Systems Market?
The projected CAGR is approximately 9.80%.
2. Which companies are prominent players in the Energy Harvesting Systems Market?
Key companies in the market include Piezo com*List Not Exhaustive, Microchip Technology Inc, Cypress Semiconductor Corporation, Powercast Corporation, Advanced Linear Devices Inc, STMicroelectronics NV, E-Peas SA, Texas Instruments Incorporated, EnoCean GmbH, Analog Devices Inc, ABB Limited.
3. What are the main segments of the Energy Harvesting Systems Market?
The market segments include Technology, Application.
4. Can you provide details about the market size?
The market size is estimated to be USD XX Million as of 2022.
5. What are some drivers contributing to market growth?
Growth of Smart Cities; Technology Developments in Manufacturing Industries.
6. What are the notable trends driving market growth?
Consumer Electronics to Hold Significant Market Share.
7. Are there any restraints impacting market growth?
Increasing Complexity of Design.
8. Can you provide examples of recent developments in the market?
March 2022: Powercast Corporation announced that it had shipped 10 million wireless RF Powerharvester PCC110 chips in the previous two years. The company credits this achievement to the rising demand for wireless power-over-distance solutions that liberate gadgets from cables, batteries, and positioning constraints, such as the direct contact with a charging surface mandated by the Qi wireless charging standard. With the help of Powercast's technology, untethered devices can be powered remotely (up to 80 feet away), which reduces or eliminates the need for batteries and connections while boosting functionality and efficiency and allowing for more flexible device placement.
9. What pricing options are available for accessing the report?
Pricing options include single-user, multi-user, and enterprise licenses priced at USD 4750, USD 5250, and USD 8750 respectively.
10. Is the market size provided in terms of value or volume?
The market size is provided in terms of value, measured in Million.
11. Are there any specific market keywords associated with the report?
Yes, the market keyword associated with the report is "Energy Harvesting Systems Market," which aids in identifying and referencing the specific market segment covered.
12. How do I determine which pricing option suits my needs best?
The pricing options vary based on user requirements and access needs. Individual users may opt for single-user licenses, while businesses requiring broader access may choose multi-user or enterprise licenses for cost-effective access to the report.
13. Are there any additional resources or data provided in the Energy Harvesting Systems Market report?
While the report offers comprehensive insights, it's advisable to review the specific contents or supplementary materials provided to ascertain if additional resources or data are available.
14. How can I stay updated on further developments or reports in the Energy Harvesting Systems Market?
To stay informed about further developments, trends, and reports in the Energy Harvesting Systems Market, consider subscribing to industry newsletters, following relevant companies and organizations, or regularly checking reputable industry news sources and publications.
Methodology
Step 1 - Identification of Relevant Samples Size from Population Database


Step 2 - Approaches for Defining Global Market Size (Value, Volume* & Price*)

Note*: In applicable scenarios
Step 3 - Data Sources
Primary Research
- Web Analytics
- Survey Reports
- Research Institute
- Latest Research Reports
- Opinion Leaders
Secondary Research
- Annual Reports
- White Paper
- Latest Press Release
- Industry Association
- Paid Database
- Investor Presentations

Step 4 - Data Triangulation
Involves using different sources of information in order to increase the validity of a study
These sources are likely to be stakeholders in a program - participants, other researchers, program staff, other community members, and so on.
Then we put all data in single framework & apply various statistical tools to find out the dynamic on the market.
During the analysis stage, feedback from the stakeholder groups would be compared to determine areas of agreement as well as areas of divergence


