
Key Insights
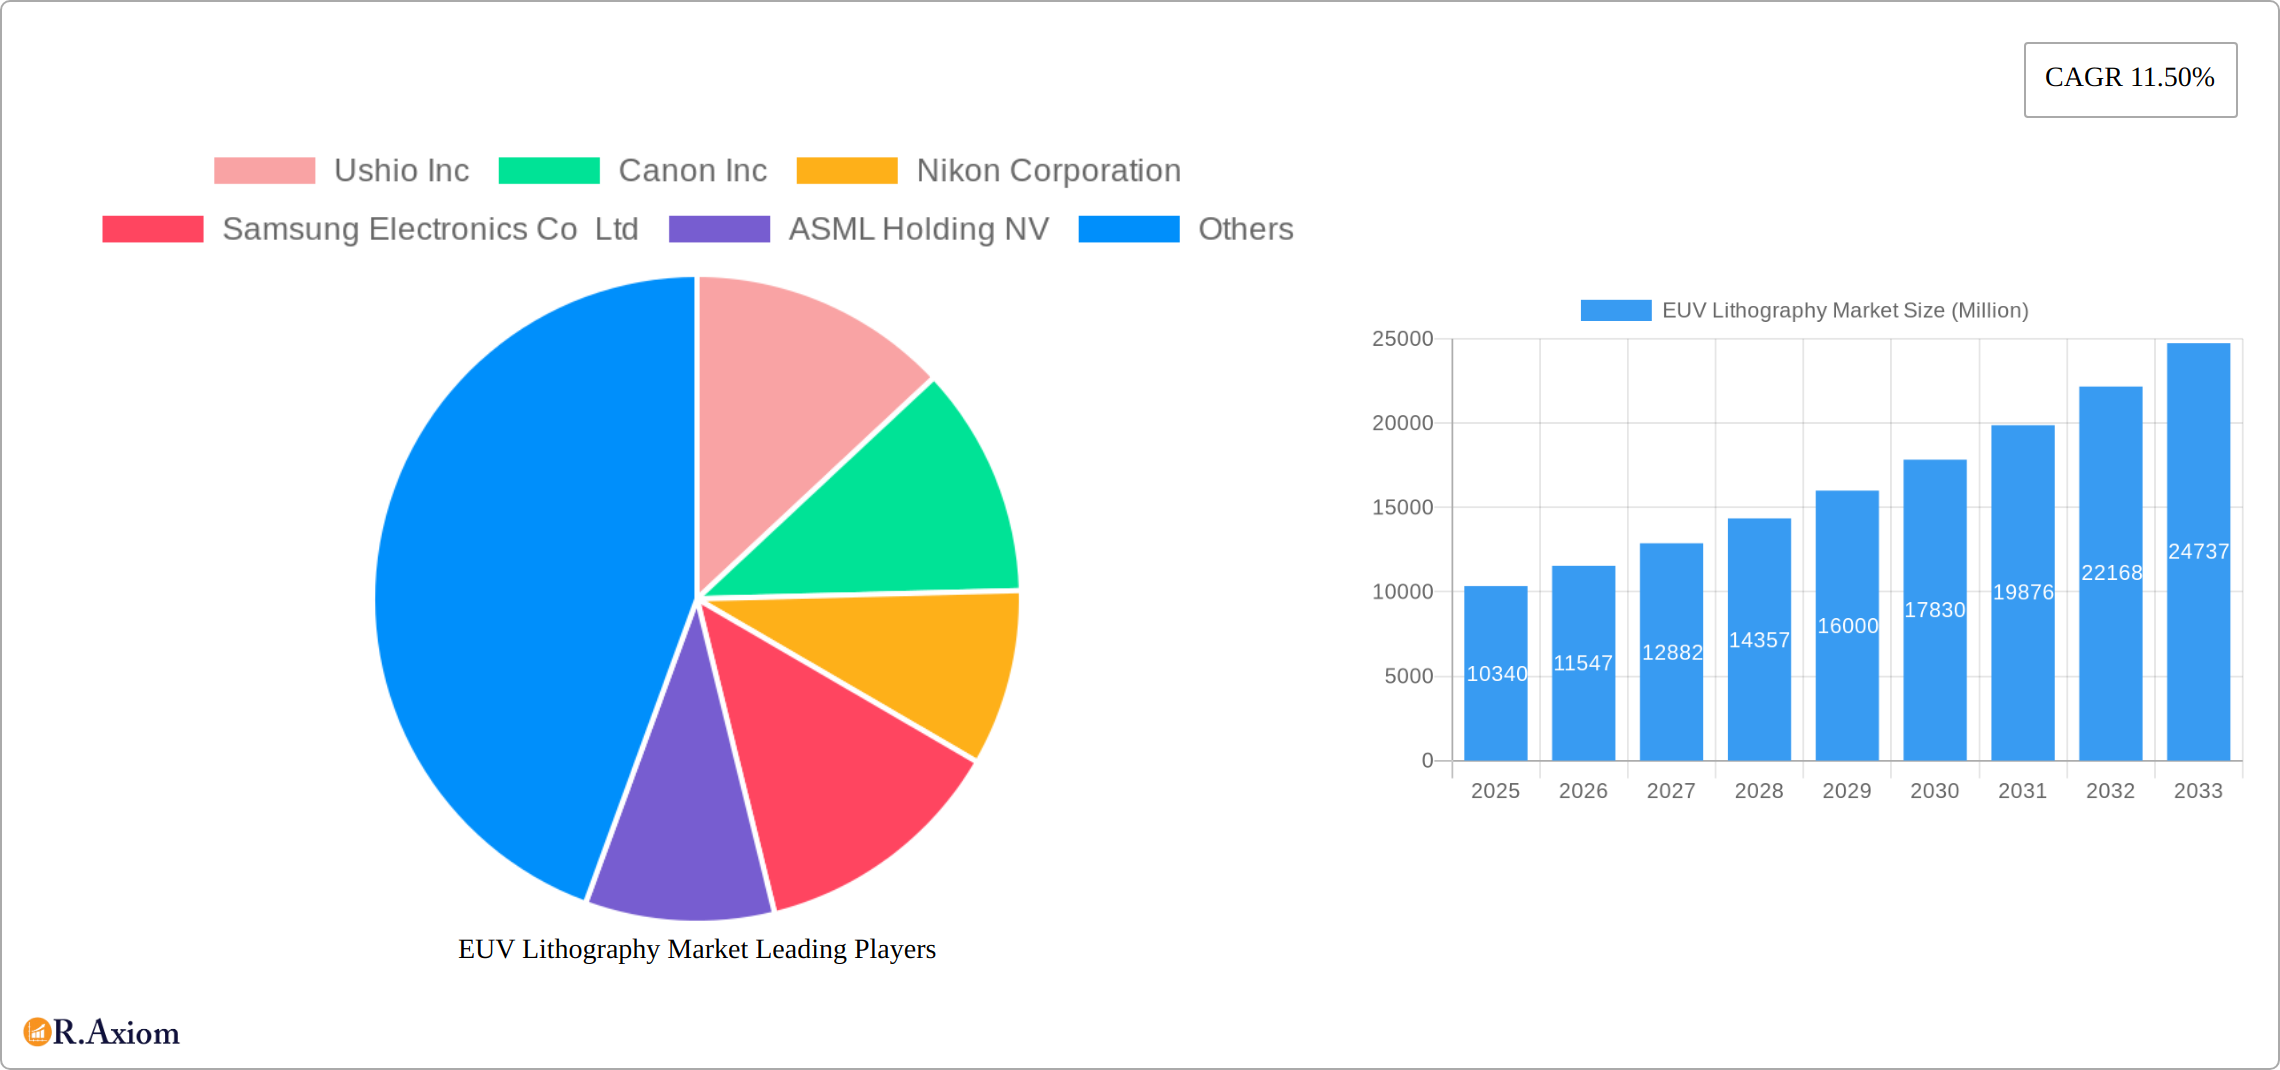
The EUV lithography market, valued at $10.34 billion in 2025, is projected to experience robust growth, driven by the increasing demand for advanced semiconductor manufacturing capabilities. The compound annual growth rate (CAGR) of 11.50% from 2025 to 2033 indicates a significant expansion of the market over the forecast period. This growth is fueled by several key factors. The relentless pursuit of miniaturization in the semiconductor industry necessitates the adoption of EUV lithography for producing smaller, faster, and more energy-efficient chips. Increased investments in research and development by leading players such as ASML, Canon, and Nikon are further driving innovation and technological advancements within the EUV lithography sector. The rising adoption of 5G technology and the burgeoning demand for high-performance computing (HPC) applications are also significant contributors to the market's expansion. While challenges remain, such as the high cost of EUV lithography systems and the complexity of the technology, the long-term prospects for the market remain exceptionally positive.
The market segmentation reveals significant opportunities across various product types (light sources, mirrors, masks) and customer types (foundries and IDMs). Foundries, such as TSMC and Samsung, are major consumers of EUV lithography systems due to their high-volume manufacturing requirements. Meanwhile, IDMs, like Intel, invest heavily in EUV technology to maintain technological leadership and control over their manufacturing processes. Geographic distribution shows a strong presence in North America, Europe, and Asia-Pacific, with Asia-Pacific expected to lead in terms of growth driven by substantial investments in semiconductor manufacturing capacity from countries like China, South Korea, and Taiwan. Competition among key players, including Ushio, Canon, Nikon, and ASML, is fierce, leading to continuous innovation and improvements in EUV technology, further accelerating market growth. Overall, the EUV lithography market presents a compelling investment opportunity with significant growth potential throughout the forecast period.
This comprehensive report provides an in-depth analysis of the EUV Lithography market, covering market size, growth drivers, challenges, key players, and future opportunities. The study period spans from 2019 to 2033, with 2025 as the base and estimated year. The forecast period is 2025-2033, and the historical period is 2019-2024. This report is essential for industry stakeholders, investors, and anyone seeking to understand the dynamics of this rapidly evolving market.
EUV Lithography Market Concentration & Innovation
The EUV lithography market exhibits a moderately concentrated structure, dominated by a few key players like ASML Holding NV, with a significant market share of xx%. However, the market is witnessing increased competition from companies such as Canon Inc., Nikon Corporation, and Samsung Electronics Co Ltd, driving innovation.
Market Concentration Metrics:
- ASML Holding NV: xx% market share
- Canon Inc.: xx% market share
- Nikon Corporation: xx% market share
- Samsung Electronics Co Ltd: xx% market share
Innovation Drivers:
- Demand for advanced semiconductor manufacturing technologies.
- Miniaturization of electronic devices and increasing device performance.
- Government initiatives promoting technological advancements in semiconductor manufacturing.
Regulatory Frameworks:
- International trade regulations impacting the import/export of EUV lithography equipment.
- Environmental regulations related to the manufacturing and disposal of EUV lithography materials.
Product Substitutes & Limitations:
While EUV lithography currently holds a dominant position for high-end applications, alternative technologies like directed self-assembly and nanoimprint lithography are emerging, posing potential long-term challenges. However, these alternatives currently face limitations in terms of resolution and throughput.
End-User Trends:
- Increasing demand from leading integrated device manufacturers (IDMs) and foundries.
- Focus on enhancing production yield and reducing manufacturing costs.
M&A Activities: The market has seen a relatively low level of M&A activity in recent years with a total deal value of approximately xx Million in the period 2019-2024. Future M&A activity is anticipated to center around strategic partnerships and acquisitions of smaller technology companies.
EUV Lithography Market Industry Trends & Insights
The EUV lithography market is experiencing robust growth, driven by the insatiable demand for high-performance, energy-efficient electronic devices fueling the digital revolution. While precise CAGR figures require client-specific data, the market demonstrated significant expansion during the historical period (2019-2024) and is projected to maintain a strong growth trajectory throughout the forecast period (2025-2033). This expansion is fueled by several key factors, including the widespread adoption of 5G and AI technologies, both of which necessitate advanced semiconductor manufacturing capabilities exceeding the limitations of previous lithographic techniques. The market penetration of EUV lithography in the semiconductor industry is steadily increasing, with projections indicating substantial market share by 2033. Technological advancements, particularly the development and deployment of High-NA EUV lithography systems, are significantly accelerating market growth. However, the market landscape is not without its challenges. Intense competitive dynamics among key players and persistent technological hurdles related to mask fabrication and source power optimization remain significant factors influencing market growth and require ongoing innovation and investment.
Dominant Markets & Segments in EUV Lithography Market
Geographically, the EUV lithography market is heavily concentrated in Asia, particularly Taiwan and South Korea. This regional dominance is primarily attributed to the presence of leading semiconductor manufacturers such as TSMC and Samsung. These regions benefit from substantial government investment and support for the semiconductor industry, coupled with advanced infrastructure and a highly skilled workforce, creating an ideal ecosystem for EUV lithography adoption and expansion. Within the market segmentation, the Foundry segment is projected to maintain its leading position due to the exceptionally high-volume manufacturing needs across diverse applications. This segment's scale and demand for cutting-edge technology are significant drivers of market growth.
Product Type Segmentation:
- Light Sources: This critical segment is poised for substantial growth, driven by the unrelenting demand for higher-power and longer-lifetime light sources. These improvements are essential for enhancing throughput, increasing efficiency, and reducing operational costs within the manufacturing process.
- Mirrors: High-precision mirrors are indispensable components in EUV lithography systems. This segment's growth is intrinsically linked to the overall market expansion, reflecting the critical role mirrors play in the technology's success.
- Masks: The mask segment is paramount for precise pattern transfer in semiconductor fabrication. Continuous advancements in mask technology, including materials science and manufacturing processes, are key drivers of growth in this area.
Type Segmentation:
- Foundry: This segment will likely experience substantial growth due to the massive volume of chip manufacturing requirements across a broad spectrum of industries and applications. Foundries are at the forefront of adopting and scaling EUV technologies.
- Integrated Device Manufacturers (IDMs): IDMs are increasingly integrating EUV lithography into their manufacturing processes to maintain their competitive edge in the production of advanced chips, reinforcing their position in the high-end semiconductor market.
Key Drivers for Dominant Regions/Segments:
- Asia (Taiwan & South Korea): The dominance of these regions stems from a confluence of factors: strong government support specifically targeted at the semiconductor industry, highly developed infrastructure designed to support advanced manufacturing, a readily available pool of skilled labor, and the significant presence of global semiconductor manufacturing giants.
- Foundry segment: The high-volume nature of chip production within the foundry segment, coupled with economies of scale and a diversified customer base, ensures sustained and robust growth within this sector.
EUV Lithography Market Product Developments
Recent product innovations focus on enhancing resolution, throughput, and cost-effectiveness. High-NA EUV systems are a key development, promising significant improvements in resolution and enabling the production of smaller and more powerful chips. This is crucial for meeting the increasing demand for advanced semiconductor devices. The integration of AI and machine learning in EUV lithography systems is another significant trend, further improving productivity and yield.
Report Scope & Segmentation Analysis
This report segments the EUV lithography market by product type (light sources, mirrors, masks) and type (foundry, IDMs). Each segment is analyzed in terms of its market size, growth projections, and competitive dynamics. The light sources segment is projected to grow at a CAGR of xx%, while the mirrors segment is projected to grow at a CAGR of xx%. The masks segment is expected to grow at a CAGR of xx%. The foundry segment is expected to dominate, growing at a CAGR of xx%, with the IDM segment exhibiting a slightly lower CAGR of xx%.
Key Drivers of EUV Lithography Market Growth
The EUV lithography market is driven by several key factors: the increasing demand for smaller and more powerful semiconductor chips fueled by the growth of 5G, AI, and high-performance computing. Advancements in EUV technology are improving resolution and throughput, enabling the production of more complex and efficient chips. Government support for semiconductor industries in key regions also acts as a significant driver.
Challenges in the EUV Lithography Market Sector
The EUV lithography market faces challenges including the high cost of equipment and materials, making entry into the market difficult for smaller players. The complexity of the technology requires highly skilled personnel, and the long lead times for equipment manufacturing also represent a significant challenge. Supply chain disruptions and geopolitical uncertainties further contribute to the challenges within this sector.
Emerging Opportunities in EUV Lithography Market
Significant emerging opportunities are presented by the development and adoption of next-generation EUV lithography systems, particularly High-NA systems. Furthermore, the expansion of EUV lithography into new applications such as advanced packaging and 3D chip stacking presents substantial growth potential. The integration of AI and machine learning in EUV processes is expected to significantly enhance process optimization, throughput, and overall efficiency. Finally, the exploration of novel materials and innovative processes for mask fabrication offers a pathway to overcome current limitations and further improve the resolution and capabilities of EUV lithography.
Leading Players in the EUV Lithography Market Market
- Ushio Inc
- Canon Inc
- Nikon Corporation
- Samsung Electronics Co Ltd
- ASML Holding NV
- NTT Advanced Technology Corporation
- Toppan Photomasks Inc
- Taiwan Semiconductor Manufacturing Company Limited
- Intel Corporation
Key Developments in EUV Lithography Market Industry
- October 2021: Samsung Electronics' mass production of 14nm DRAM using EUV lithography highlighted the technology's capacity to produce advanced memory chips at scale, signifying a significant milestone in the industry.
- January 2022: Intel's commitment to employing ASML's High-NA Twinscan EXE scanners for high-volume manufacturing (HVM) in 2025 for its 18A (1.8nm) production process underscores the importance of next-generation EUV technology, even for companies initially trailing competitors in its adoption.
- Add more recent key developments here. Include details such as company announcements, product launches, partnerships, and mergers and acquisitions relevant to the EUV lithography market.
Strategic Outlook for EUV Lithography Market Market
The EUV lithography market is poised for substantial and sustained growth, driven by a confluence of factors: rapid technological advancements, the ever-increasing demand for sophisticated semiconductor devices, and proactive government support in key regions. Continued innovation in High-NA EUV systems, coupled with the development and implementation of new materials and optimized manufacturing processes, will further unlock the market's substantial growth potential. Companies capable of effectively navigating the inherent technological challenges and optimizing their manufacturing processes are ideally positioned to capitalize on this significant market opportunity and secure a leading position within the industry.
EUV Lithography Market Segmentation
-
1. Product Type
- 1.1. Light Sources
- 1.2. Mirrors
- 1.3. Masks
-
2. Type
- 2.1. Foundry
- 2.2. Integrated Device Manufacturers (IDMs)
-
3. Geography
- 3.1. South Korea
- 3.2. Taiwan
- 3.3. Others
EUV Lithography Market Segmentation By Geography
- 1. South Korea
- 2. Taiwan
- 3. Others

EUV Lithography Market REPORT HIGHLIGHTS
| Aspects | Details |
|---|---|
| Study Period | 2019-2033 |
| Base Year | 2024 |
| Estimated Year | 2025 |
| Forecast Period | 2025-2033 |
| Historical Period | 2019-2024 |
| Growth Rate | CAGR of 11.50% from 2019-2033 |
| Segmentation |
|
Table of Contents
- 1. Introduction
- 1.1. Research Scope
- 1.2. Market Segmentation
- 1.3. Research Methodology
- 1.4. Definitions and Assumptions
- 2. Executive Summary
- 2.1. Introduction
- 3. Market Dynamics
- 3.1. Introduction
- 3.2. Market Drivers
- 3.2.1. The technology resulting in a faster output of microchips compared to others; Chip makers reducing the manufacturing process for better efficiency
- 3.3. Market Restrains
- 3.3.1. High cost involved in replacing the existing Deep UV with EUV lasers; Monopoly existing within the market
- 3.4. Market Trends
- 3.4.1. Foundry is Expected to Hold Major Share
- 4. Market Factor Analysis
- 4.1. Porters Five Forces
- 4.2. Supply/Value Chain
- 4.3. PESTEL analysis
- 4.4. Market Entropy
- 4.5. Patent/Trademark Analysis
- 5. Global EUV Lithography Market Analysis, Insights and Forecast, 2019-2031
- 5.1. Market Analysis, Insights and Forecast - by Product Type
- 5.1.1. Light Sources
- 5.1.2. Mirrors
- 5.1.3. Masks
- 5.2. Market Analysis, Insights and Forecast - by Type
- 5.2.1. Foundry
- 5.2.2. Integrated Device Manufacturers (IDMs)
- 5.3. Market Analysis, Insights and Forecast - by Geography
- 5.3.1. South Korea
- 5.3.2. Taiwan
- 5.3.3. Others
- 5.4. Market Analysis, Insights and Forecast - by Region
- 5.4.1. South Korea
- 5.4.2. Taiwan
- 5.4.3. Others
- 5.1. Market Analysis, Insights and Forecast - by Product Type
- 6. South Korea EUV Lithography Market Analysis, Insights and Forecast, 2019-2031
- 6.1. Market Analysis, Insights and Forecast - by Product Type
- 6.1.1. Light Sources
- 6.1.2. Mirrors
- 6.1.3. Masks
- 6.2. Market Analysis, Insights and Forecast - by Type
- 6.2.1. Foundry
- 6.2.2. Integrated Device Manufacturers (IDMs)
- 6.3. Market Analysis, Insights and Forecast - by Geography
- 6.3.1. South Korea
- 6.3.2. Taiwan
- 6.3.3. Others
- 6.1. Market Analysis, Insights and Forecast - by Product Type
- 7. Taiwan EUV Lithography Market Analysis, Insights and Forecast, 2019-2031
- 7.1. Market Analysis, Insights and Forecast - by Product Type
- 7.1.1. Light Sources
- 7.1.2. Mirrors
- 7.1.3. Masks
- 7.2. Market Analysis, Insights and Forecast - by Type
- 7.2.1. Foundry
- 7.2.2. Integrated Device Manufacturers (IDMs)
- 7.3. Market Analysis, Insights and Forecast - by Geography
- 7.3.1. South Korea
- 7.3.2. Taiwan
- 7.3.3. Others
- 7.1. Market Analysis, Insights and Forecast - by Product Type
- 8. Others EUV Lithography Market Analysis, Insights and Forecast, 2019-2031
- 8.1. Market Analysis, Insights and Forecast - by Product Type
- 8.1.1. Light Sources
- 8.1.2. Mirrors
- 8.1.3. Masks
- 8.2. Market Analysis, Insights and Forecast - by Type
- 8.2.1. Foundry
- 8.2.2. Integrated Device Manufacturers (IDMs)
- 8.3. Market Analysis, Insights and Forecast - by Geography
- 8.3.1. South Korea
- 8.3.2. Taiwan
- 8.3.3. Others
- 8.1. Market Analysis, Insights and Forecast - by Product Type
- 9. North America EUV Lithography Market Analysis, Insights and Forecast, 2019-2031
- 9.1. Market Analysis, Insights and Forecast - By Country/Sub-region
- 9.1.1 United States
- 9.1.2 Canada
- 9.1.3 Mexico
- 10. Europe EUV Lithography Market Analysis, Insights and Forecast, 2019-2031
- 10.1. Market Analysis, Insights and Forecast - By Country/Sub-region
- 10.1.1 Germany
- 10.1.2 United Kingdom
- 10.1.3 France
- 10.1.4 Spain
- 10.1.5 Italy
- 10.1.6 Spain
- 10.1.7 Belgium
- 10.1.8 Netherland
- 10.1.9 Nordics
- 10.1.10 Rest of Europe
- 11. Asia Pacific EUV Lithography Market Analysis, Insights and Forecast, 2019-2031
- 11.1. Market Analysis, Insights and Forecast - By Country/Sub-region
- 11.1.1 China
- 11.1.2 Japan
- 11.1.3 India
- 11.1.4 South Korea
- 11.1.5 Southeast Asia
- 11.1.6 Australia
- 11.1.7 Indonesia
- 11.1.8 Phillipes
- 11.1.9 Singapore
- 11.1.10 Thailandc
- 11.1.11 Rest of Asia Pacific
- 12. South America EUV Lithography Market Analysis, Insights and Forecast, 2019-2031
- 12.1. Market Analysis, Insights and Forecast - By Country/Sub-region
- 12.1.1 Brazil
- 12.1.2 Argentina
- 12.1.3 Peru
- 12.1.4 Chile
- 12.1.5 Colombia
- 12.1.6 Ecuador
- 12.1.7 Venezuela
- 12.1.8 Rest of South America
- 13. North America EUV Lithography Market Analysis, Insights and Forecast, 2019-2031
- 13.1. Market Analysis, Insights and Forecast - By Country/Sub-region
- 13.1.1 United States
- 13.1.2 Canada
- 13.1.3 Mexico
- 14. MEA EUV Lithography Market Analysis, Insights and Forecast, 2019-2031
- 14.1. Market Analysis, Insights and Forecast - By Country/Sub-region
- 14.1.1 United Arab Emirates
- 14.1.2 Saudi Arabia
- 14.1.3 South Africa
- 14.1.4 Rest of Middle East and Africa
- 15. Competitive Analysis
- 15.1. Global Market Share Analysis 2024
- 15.2. Company Profiles
- 15.2.1 Ushio Inc
- 15.2.1.1. Overview
- 15.2.1.2. Products
- 15.2.1.3. SWOT Analysis
- 15.2.1.4. Recent Developments
- 15.2.1.5. Financials (Based on Availability)
- 15.2.2 Canon Inc
- 15.2.2.1. Overview
- 15.2.2.2. Products
- 15.2.2.3. SWOT Analysis
- 15.2.2.4. Recent Developments
- 15.2.2.5. Financials (Based on Availability)
- 15.2.3 Nikon Corporation
- 15.2.3.1. Overview
- 15.2.3.2. Products
- 15.2.3.3. SWOT Analysis
- 15.2.3.4. Recent Developments
- 15.2.3.5. Financials (Based on Availability)
- 15.2.4 Samsung Electronics Co Ltd
- 15.2.4.1. Overview
- 15.2.4.2. Products
- 15.2.4.3. SWOT Analysis
- 15.2.4.4. Recent Developments
- 15.2.4.5. Financials (Based on Availability)
- 15.2.5 ASML Holding NV
- 15.2.5.1. Overview
- 15.2.5.2. Products
- 15.2.5.3. SWOT Analysis
- 15.2.5.4. Recent Developments
- 15.2.5.5. Financials (Based on Availability)
- 15.2.6 NTT Advanced Technology Corporation
- 15.2.6.1. Overview
- 15.2.6.2. Products
- 15.2.6.3. SWOT Analysis
- 15.2.6.4. Recent Developments
- 15.2.6.5. Financials (Based on Availability)
- 15.2.7 Toppan Photomasks Inc
- 15.2.7.1. Overview
- 15.2.7.2. Products
- 15.2.7.3. SWOT Analysis
- 15.2.7.4. Recent Developments
- 15.2.7.5. Financials (Based on Availability)
- 15.2.8 Taiwan Semiconductor Manufacturing Company Limited
- 15.2.8.1. Overview
- 15.2.8.2. Products
- 15.2.8.3. SWOT Analysis
- 15.2.8.4. Recent Developments
- 15.2.8.5. Financials (Based on Availability)
- 15.2.9 Intel Corporation
- 15.2.9.1. Overview
- 15.2.9.2. Products
- 15.2.9.3. SWOT Analysis
- 15.2.9.4. Recent Developments
- 15.2.9.5. Financials (Based on Availability)
- 15.2.1 Ushio Inc
List of Figures
- Figure 1: Global EUV Lithography Market Revenue Breakdown (Million, %) by Region 2024 & 2032
- Figure 2: Global EUV Lithography Market Volume Breakdown (K Unit, %) by Region 2024 & 2032
- Figure 3: North America EUV Lithography Market Revenue (Million), by Country 2024 & 2032
- Figure 4: North America EUV Lithography Market Volume (K Unit), by Country 2024 & 2032
- Figure 5: North America EUV Lithography Market Revenue Share (%), by Country 2024 & 2032
- Figure 6: North America EUV Lithography Market Volume Share (%), by Country 2024 & 2032
- Figure 7: Europe EUV Lithography Market Revenue (Million), by Country 2024 & 2032
- Figure 8: Europe EUV Lithography Market Volume (K Unit), by Country 2024 & 2032
- Figure 9: Europe EUV Lithography Market Revenue Share (%), by Country 2024 & 2032
- Figure 10: Europe EUV Lithography Market Volume Share (%), by Country 2024 & 2032
- Figure 11: Asia Pacific EUV Lithography Market Revenue (Million), by Country 2024 & 2032
- Figure 12: Asia Pacific EUV Lithography Market Volume (K Unit), by Country 2024 & 2032
- Figure 13: Asia Pacific EUV Lithography Market Revenue Share (%), by Country 2024 & 2032
- Figure 14: Asia Pacific EUV Lithography Market Volume Share (%), by Country 2024 & 2032
- Figure 15: South America EUV Lithography Market Revenue (Million), by Country 2024 & 2032
- Figure 16: South America EUV Lithography Market Volume (K Unit), by Country 2024 & 2032
- Figure 17: South America EUV Lithography Market Revenue Share (%), by Country 2024 & 2032
- Figure 18: South America EUV Lithography Market Volume Share (%), by Country 2024 & 2032
- Figure 19: North America EUV Lithography Market Revenue (Million), by Country 2024 & 2032
- Figure 20: North America EUV Lithography Market Volume (K Unit), by Country 2024 & 2032
- Figure 21: North America EUV Lithography Market Revenue Share (%), by Country 2024 & 2032
- Figure 22: North America EUV Lithography Market Volume Share (%), by Country 2024 & 2032
- Figure 23: MEA EUV Lithography Market Revenue (Million), by Country 2024 & 2032
- Figure 24: MEA EUV Lithography Market Volume (K Unit), by Country 2024 & 2032
- Figure 25: MEA EUV Lithography Market Revenue Share (%), by Country 2024 & 2032
- Figure 26: MEA EUV Lithography Market Volume Share (%), by Country 2024 & 2032
- Figure 27: South Korea EUV Lithography Market Revenue (Million), by Product Type 2024 & 2032
- Figure 28: South Korea EUV Lithography Market Volume (K Unit), by Product Type 2024 & 2032
- Figure 29: South Korea EUV Lithography Market Revenue Share (%), by Product Type 2024 & 2032
- Figure 30: South Korea EUV Lithography Market Volume Share (%), by Product Type 2024 & 2032
- Figure 31: South Korea EUV Lithography Market Revenue (Million), by Type 2024 & 2032
- Figure 32: South Korea EUV Lithography Market Volume (K Unit), by Type 2024 & 2032
- Figure 33: South Korea EUV Lithography Market Revenue Share (%), by Type 2024 & 2032
- Figure 34: South Korea EUV Lithography Market Volume Share (%), by Type 2024 & 2032
- Figure 35: South Korea EUV Lithography Market Revenue (Million), by Geography 2024 & 2032
- Figure 36: South Korea EUV Lithography Market Volume (K Unit), by Geography 2024 & 2032
- Figure 37: South Korea EUV Lithography Market Revenue Share (%), by Geography 2024 & 2032
- Figure 38: South Korea EUV Lithography Market Volume Share (%), by Geography 2024 & 2032
- Figure 39: South Korea EUV Lithography Market Revenue (Million), by Country 2024 & 2032
- Figure 40: South Korea EUV Lithography Market Volume (K Unit), by Country 2024 & 2032
- Figure 41: South Korea EUV Lithography Market Revenue Share (%), by Country 2024 & 2032
- Figure 42: South Korea EUV Lithography Market Volume Share (%), by Country 2024 & 2032
- Figure 43: Taiwan EUV Lithography Market Revenue (Million), by Product Type 2024 & 2032
- Figure 44: Taiwan EUV Lithography Market Volume (K Unit), by Product Type 2024 & 2032
- Figure 45: Taiwan EUV Lithography Market Revenue Share (%), by Product Type 2024 & 2032
- Figure 46: Taiwan EUV Lithography Market Volume Share (%), by Product Type 2024 & 2032
- Figure 47: Taiwan EUV Lithography Market Revenue (Million), by Type 2024 & 2032
- Figure 48: Taiwan EUV Lithography Market Volume (K Unit), by Type 2024 & 2032
- Figure 49: Taiwan EUV Lithography Market Revenue Share (%), by Type 2024 & 2032
- Figure 50: Taiwan EUV Lithography Market Volume Share (%), by Type 2024 & 2032
- Figure 51: Taiwan EUV Lithography Market Revenue (Million), by Geography 2024 & 2032
- Figure 52: Taiwan EUV Lithography Market Volume (K Unit), by Geography 2024 & 2032
- Figure 53: Taiwan EUV Lithography Market Revenue Share (%), by Geography 2024 & 2032
- Figure 54: Taiwan EUV Lithography Market Volume Share (%), by Geography 2024 & 2032
- Figure 55: Taiwan EUV Lithography Market Revenue (Million), by Country 2024 & 2032
- Figure 56: Taiwan EUV Lithography Market Volume (K Unit), by Country 2024 & 2032
- Figure 57: Taiwan EUV Lithography Market Revenue Share (%), by Country 2024 & 2032
- Figure 58: Taiwan EUV Lithography Market Volume Share (%), by Country 2024 & 2032
- Figure 59: Others EUV Lithography Market Revenue (Million), by Product Type 2024 & 2032
- Figure 60: Others EUV Lithography Market Volume (K Unit), by Product Type 2024 & 2032
- Figure 61: Others EUV Lithography Market Revenue Share (%), by Product Type 2024 & 2032
- Figure 62: Others EUV Lithography Market Volume Share (%), by Product Type 2024 & 2032
- Figure 63: Others EUV Lithography Market Revenue (Million), by Type 2024 & 2032
- Figure 64: Others EUV Lithography Market Volume (K Unit), by Type 2024 & 2032
- Figure 65: Others EUV Lithography Market Revenue Share (%), by Type 2024 & 2032
- Figure 66: Others EUV Lithography Market Volume Share (%), by Type 2024 & 2032
- Figure 67: Others EUV Lithography Market Revenue (Million), by Geography 2024 & 2032
- Figure 68: Others EUV Lithography Market Volume (K Unit), by Geography 2024 & 2032
- Figure 69: Others EUV Lithography Market Revenue Share (%), by Geography 2024 & 2032
- Figure 70: Others EUV Lithography Market Volume Share (%), by Geography 2024 & 2032
- Figure 71: Others EUV Lithography Market Revenue (Million), by Country 2024 & 2032
- Figure 72: Others EUV Lithography Market Volume (K Unit), by Country 2024 & 2032
- Figure 73: Others EUV Lithography Market Revenue Share (%), by Country 2024 & 2032
- Figure 74: Others EUV Lithography Market Volume Share (%), by Country 2024 & 2032
List of Tables
- Table 1: Global EUV Lithography Market Revenue Million Forecast, by Region 2019 & 2032
- Table 2: Global EUV Lithography Market Volume K Unit Forecast, by Region 2019 & 2032
- Table 3: Global EUV Lithography Market Revenue Million Forecast, by Product Type 2019 & 2032
- Table 4: Global EUV Lithography Market Volume K Unit Forecast, by Product Type 2019 & 2032
- Table 5: Global EUV Lithography Market Revenue Million Forecast, by Type 2019 & 2032
- Table 6: Global EUV Lithography Market Volume K Unit Forecast, by Type 2019 & 2032
- Table 7: Global EUV Lithography Market Revenue Million Forecast, by Geography 2019 & 2032
- Table 8: Global EUV Lithography Market Volume K Unit Forecast, by Geography 2019 & 2032
- Table 9: Global EUV Lithography Market Revenue Million Forecast, by Region 2019 & 2032
- Table 10: Global EUV Lithography Market Volume K Unit Forecast, by Region 2019 & 2032
- Table 11: Global EUV Lithography Market Revenue Million Forecast, by Country 2019 & 2032
- Table 12: Global EUV Lithography Market Volume K Unit Forecast, by Country 2019 & 2032
- Table 13: United States EUV Lithography Market Revenue (Million) Forecast, by Application 2019 & 2032
- Table 14: United States EUV Lithography Market Volume (K Unit) Forecast, by Application 2019 & 2032
- Table 15: Canada EUV Lithography Market Revenue (Million) Forecast, by Application 2019 & 2032
- Table 16: Canada EUV Lithography Market Volume (K Unit) Forecast, by Application 2019 & 2032
- Table 17: Mexico EUV Lithography Market Revenue (Million) Forecast, by Application 2019 & 2032
- Table 18: Mexico EUV Lithography Market Volume (K Unit) Forecast, by Application 2019 & 2032
- Table 19: Global EUV Lithography Market Revenue Million Forecast, by Country 2019 & 2032
- Table 20: Global EUV Lithography Market Volume K Unit Forecast, by Country 2019 & 2032
- Table 21: Germany EUV Lithography Market Revenue (Million) Forecast, by Application 2019 & 2032
- Table 22: Germany EUV Lithography Market Volume (K Unit) Forecast, by Application 2019 & 2032
- Table 23: United Kingdom EUV Lithography Market Revenue (Million) Forecast, by Application 2019 & 2032
- Table 24: United Kingdom EUV Lithography Market Volume (K Unit) Forecast, by Application 2019 & 2032
- Table 25: France EUV Lithography Market Revenue (Million) Forecast, by Application 2019 & 2032
- Table 26: France EUV Lithography Market Volume (K Unit) Forecast, by Application 2019 & 2032
- Table 27: Spain EUV Lithography Market Revenue (Million) Forecast, by Application 2019 & 2032
- Table 28: Spain EUV Lithography Market Volume (K Unit) Forecast, by Application 2019 & 2032
- Table 29: Italy EUV Lithography Market Revenue (Million) Forecast, by Application 2019 & 2032
- Table 30: Italy EUV Lithography Market Volume (K Unit) Forecast, by Application 2019 & 2032
- Table 31: Spain EUV Lithography Market Revenue (Million) Forecast, by Application 2019 & 2032
- Table 32: Spain EUV Lithography Market Volume (K Unit) Forecast, by Application 2019 & 2032
- Table 33: Belgium EUV Lithography Market Revenue (Million) Forecast, by Application 2019 & 2032
- Table 34: Belgium EUV Lithography Market Volume (K Unit) Forecast, by Application 2019 & 2032
- Table 35: Netherland EUV Lithography Market Revenue (Million) Forecast, by Application 2019 & 2032
- Table 36: Netherland EUV Lithography Market Volume (K Unit) Forecast, by Application 2019 & 2032
- Table 37: Nordics EUV Lithography Market Revenue (Million) Forecast, by Application 2019 & 2032
- Table 38: Nordics EUV Lithography Market Volume (K Unit) Forecast, by Application 2019 & 2032
- Table 39: Rest of Europe EUV Lithography Market Revenue (Million) Forecast, by Application 2019 & 2032
- Table 40: Rest of Europe EUV Lithography Market Volume (K Unit) Forecast, by Application 2019 & 2032
- Table 41: Global EUV Lithography Market Revenue Million Forecast, by Country 2019 & 2032
- Table 42: Global EUV Lithography Market Volume K Unit Forecast, by Country 2019 & 2032
- Table 43: China EUV Lithography Market Revenue (Million) Forecast, by Application 2019 & 2032
- Table 44: China EUV Lithography Market Volume (K Unit) Forecast, by Application 2019 & 2032
- Table 45: Japan EUV Lithography Market Revenue (Million) Forecast, by Application 2019 & 2032
- Table 46: Japan EUV Lithography Market Volume (K Unit) Forecast, by Application 2019 & 2032
- Table 47: India EUV Lithography Market Revenue (Million) Forecast, by Application 2019 & 2032
- Table 48: India EUV Lithography Market Volume (K Unit) Forecast, by Application 2019 & 2032
- Table 49: South Korea EUV Lithography Market Revenue (Million) Forecast, by Application 2019 & 2032
- Table 50: South Korea EUV Lithography Market Volume (K Unit) Forecast, by Application 2019 & 2032
- Table 51: Southeast Asia EUV Lithography Market Revenue (Million) Forecast, by Application 2019 & 2032
- Table 52: Southeast Asia EUV Lithography Market Volume (K Unit) Forecast, by Application 2019 & 2032
- Table 53: Australia EUV Lithography Market Revenue (Million) Forecast, by Application 2019 & 2032
- Table 54: Australia EUV Lithography Market Volume (K Unit) Forecast, by Application 2019 & 2032
- Table 55: Indonesia EUV Lithography Market Revenue (Million) Forecast, by Application 2019 & 2032
- Table 56: Indonesia EUV Lithography Market Volume (K Unit) Forecast, by Application 2019 & 2032
- Table 57: Phillipes EUV Lithography Market Revenue (Million) Forecast, by Application 2019 & 2032
- Table 58: Phillipes EUV Lithography Market Volume (K Unit) Forecast, by Application 2019 & 2032
- Table 59: Singapore EUV Lithography Market Revenue (Million) Forecast, by Application 2019 & 2032
- Table 60: Singapore EUV Lithography Market Volume (K Unit) Forecast, by Application 2019 & 2032
- Table 61: Thailandc EUV Lithography Market Revenue (Million) Forecast, by Application 2019 & 2032
- Table 62: Thailandc EUV Lithography Market Volume (K Unit) Forecast, by Application 2019 & 2032
- Table 63: Rest of Asia Pacific EUV Lithography Market Revenue (Million) Forecast, by Application 2019 & 2032
- Table 64: Rest of Asia Pacific EUV Lithography Market Volume (K Unit) Forecast, by Application 2019 & 2032
- Table 65: Global EUV Lithography Market Revenue Million Forecast, by Country 2019 & 2032
- Table 66: Global EUV Lithography Market Volume K Unit Forecast, by Country 2019 & 2032
- Table 67: Brazil EUV Lithography Market Revenue (Million) Forecast, by Application 2019 & 2032
- Table 68: Brazil EUV Lithography Market Volume (K Unit) Forecast, by Application 2019 & 2032
- Table 69: Argentina EUV Lithography Market Revenue (Million) Forecast, by Application 2019 & 2032
- Table 70: Argentina EUV Lithography Market Volume (K Unit) Forecast, by Application 2019 & 2032
- Table 71: Peru EUV Lithography Market Revenue (Million) Forecast, by Application 2019 & 2032
- Table 72: Peru EUV Lithography Market Volume (K Unit) Forecast, by Application 2019 & 2032
- Table 73: Chile EUV Lithography Market Revenue (Million) Forecast, by Application 2019 & 2032
- Table 74: Chile EUV Lithography Market Volume (K Unit) Forecast, by Application 2019 & 2032
- Table 75: Colombia EUV Lithography Market Revenue (Million) Forecast, by Application 2019 & 2032
- Table 76: Colombia EUV Lithography Market Volume (K Unit) Forecast, by Application 2019 & 2032
- Table 77: Ecuador EUV Lithography Market Revenue (Million) Forecast, by Application 2019 & 2032
- Table 78: Ecuador EUV Lithography Market Volume (K Unit) Forecast, by Application 2019 & 2032
- Table 79: Venezuela EUV Lithography Market Revenue (Million) Forecast, by Application 2019 & 2032
- Table 80: Venezuela EUV Lithography Market Volume (K Unit) Forecast, by Application 2019 & 2032
- Table 81: Rest of South America EUV Lithography Market Revenue (Million) Forecast, by Application 2019 & 2032
- Table 82: Rest of South America EUV Lithography Market Volume (K Unit) Forecast, by Application 2019 & 2032
- Table 83: Global EUV Lithography Market Revenue Million Forecast, by Country 2019 & 2032
- Table 84: Global EUV Lithography Market Volume K Unit Forecast, by Country 2019 & 2032
- Table 85: United States EUV Lithography Market Revenue (Million) Forecast, by Application 2019 & 2032
- Table 86: United States EUV Lithography Market Volume (K Unit) Forecast, by Application 2019 & 2032
- Table 87: Canada EUV Lithography Market Revenue (Million) Forecast, by Application 2019 & 2032
- Table 88: Canada EUV Lithography Market Volume (K Unit) Forecast, by Application 2019 & 2032
- Table 89: Mexico EUV Lithography Market Revenue (Million) Forecast, by Application 2019 & 2032
- Table 90: Mexico EUV Lithography Market Volume (K Unit) Forecast, by Application 2019 & 2032
- Table 91: Global EUV Lithography Market Revenue Million Forecast, by Country 2019 & 2032
- Table 92: Global EUV Lithography Market Volume K Unit Forecast, by Country 2019 & 2032
- Table 93: United Arab Emirates EUV Lithography Market Revenue (Million) Forecast, by Application 2019 & 2032
- Table 94: United Arab Emirates EUV Lithography Market Volume (K Unit) Forecast, by Application 2019 & 2032
- Table 95: Saudi Arabia EUV Lithography Market Revenue (Million) Forecast, by Application 2019 & 2032
- Table 96: Saudi Arabia EUV Lithography Market Volume (K Unit) Forecast, by Application 2019 & 2032
- Table 97: South Africa EUV Lithography Market Revenue (Million) Forecast, by Application 2019 & 2032
- Table 98: South Africa EUV Lithography Market Volume (K Unit) Forecast, by Application 2019 & 2032
- Table 99: Rest of Middle East and Africa EUV Lithography Market Revenue (Million) Forecast, by Application 2019 & 2032
- Table 100: Rest of Middle East and Africa EUV Lithography Market Volume (K Unit) Forecast, by Application 2019 & 2032
- Table 101: Global EUV Lithography Market Revenue Million Forecast, by Product Type 2019 & 2032
- Table 102: Global EUV Lithography Market Volume K Unit Forecast, by Product Type 2019 & 2032
- Table 103: Global EUV Lithography Market Revenue Million Forecast, by Type 2019 & 2032
- Table 104: Global EUV Lithography Market Volume K Unit Forecast, by Type 2019 & 2032
- Table 105: Global EUV Lithography Market Revenue Million Forecast, by Geography 2019 & 2032
- Table 106: Global EUV Lithography Market Volume K Unit Forecast, by Geography 2019 & 2032
- Table 107: Global EUV Lithography Market Revenue Million Forecast, by Country 2019 & 2032
- Table 108: Global EUV Lithography Market Volume K Unit Forecast, by Country 2019 & 2032
- Table 109: Global EUV Lithography Market Revenue Million Forecast, by Product Type 2019 & 2032
- Table 110: Global EUV Lithography Market Volume K Unit Forecast, by Product Type 2019 & 2032
- Table 111: Global EUV Lithography Market Revenue Million Forecast, by Type 2019 & 2032
- Table 112: Global EUV Lithography Market Volume K Unit Forecast, by Type 2019 & 2032
- Table 113: Global EUV Lithography Market Revenue Million Forecast, by Geography 2019 & 2032
- Table 114: Global EUV Lithography Market Volume K Unit Forecast, by Geography 2019 & 2032
- Table 115: Global EUV Lithography Market Revenue Million Forecast, by Country 2019 & 2032
- Table 116: Global EUV Lithography Market Volume K Unit Forecast, by Country 2019 & 2032
- Table 117: Global EUV Lithography Market Revenue Million Forecast, by Product Type 2019 & 2032
- Table 118: Global EUV Lithography Market Volume K Unit Forecast, by Product Type 2019 & 2032
- Table 119: Global EUV Lithography Market Revenue Million Forecast, by Type 2019 & 2032
- Table 120: Global EUV Lithography Market Volume K Unit Forecast, by Type 2019 & 2032
- Table 121: Global EUV Lithography Market Revenue Million Forecast, by Geography 2019 & 2032
- Table 122: Global EUV Lithography Market Volume K Unit Forecast, by Geography 2019 & 2032
- Table 123: Global EUV Lithography Market Revenue Million Forecast, by Country 2019 & 2032
- Table 124: Global EUV Lithography Market Volume K Unit Forecast, by Country 2019 & 2032
Frequently Asked Questions
1. What is the projected Compound Annual Growth Rate (CAGR) of the EUV Lithography Market?
The projected CAGR is approximately 11.50%.
2. Which companies are prominent players in the EUV Lithography Market?
Key companies in the market include Ushio Inc, Canon Inc, Nikon Corporation, Samsung Electronics Co Ltd, ASML Holding NV, NTT Advanced Technology Corporation, Toppan Photomasks Inc, Taiwan Semiconductor Manufacturing Company Limited, Intel Corporation.
3. What are the main segments of the EUV Lithography Market?
The market segments include Product Type, Type, Geography.
4. Can you provide details about the market size?
The market size is estimated to be USD 10.34 Million as of 2022.
5. What are some drivers contributing to market growth?
The technology resulting in a faster output of microchips compared to others; Chip makers reducing the manufacturing process for better efficiency.
6. What are the notable trends driving market growth?
Foundry is Expected to Hold Major Share.
7. Are there any restraints impacting market growth?
High cost involved in replacing the existing Deep UV with EUV lasers; Monopoly existing within the market.
8. Can you provide examples of recent developments in the market?
January 2022: Intel has stated that it will begin employing ASML's High-NA Twinscan EXE scanners for high-volume manufacturing (HVM) in 2025, when the firm hopes to begin using its 18A (1.8 nm) production technique. With the first generation of extreme ultraviolet (EUV) lithography technology, Intel is obviously behind rivals TSMC and Samsung, but it intends to be the first to deploy the next-generation EUV tools.
9. What pricing options are available for accessing the report?
Pricing options include single-user, multi-user, and enterprise licenses priced at USD 4750, USD 5250, and USD 8750 respectively.
10. Is the market size provided in terms of value or volume?
The market size is provided in terms of value, measured in Million and volume, measured in K Unit.
11. Are there any specific market keywords associated with the report?
Yes, the market keyword associated with the report is "EUV Lithography Market," which aids in identifying and referencing the specific market segment covered.
12. How do I determine which pricing option suits my needs best?
The pricing options vary based on user requirements and access needs. Individual users may opt for single-user licenses, while businesses requiring broader access may choose multi-user or enterprise licenses for cost-effective access to the report.
13. Are there any additional resources or data provided in the EUV Lithography Market report?
While the report offers comprehensive insights, it's advisable to review the specific contents or supplementary materials provided to ascertain if additional resources or data are available.
14. How can I stay updated on further developments or reports in the EUV Lithography Market?
To stay informed about further developments, trends, and reports in the EUV Lithography Market, consider subscribing to industry newsletters, following relevant companies and organizations, or regularly checking reputable industry news sources and publications.
Methodology
Step 1 - Identification of Relevant Samples Size from Population Database


Step 2 - Approaches for Defining Global Market Size (Value, Volume* & Price*)

Note*: In applicable scenarios
Step 3 - Data Sources
Primary Research
- Web Analytics
- Survey Reports
- Research Institute
- Latest Research Reports
- Opinion Leaders
Secondary Research
- Annual Reports
- White Paper
- Latest Press Release
- Industry Association
- Paid Database
- Investor Presentations

Step 4 - Data Triangulation
Involves using different sources of information in order to increase the validity of a study
These sources are likely to be stakeholders in a program - participants, other researchers, program staff, other community members, and so on.
Then we put all data in single framework & apply various statistical tools to find out the dynamic on the market.
During the analysis stage, feedback from the stakeholder groups would be compared to determine areas of agreement as well as areas of divergence


