


Key Insights
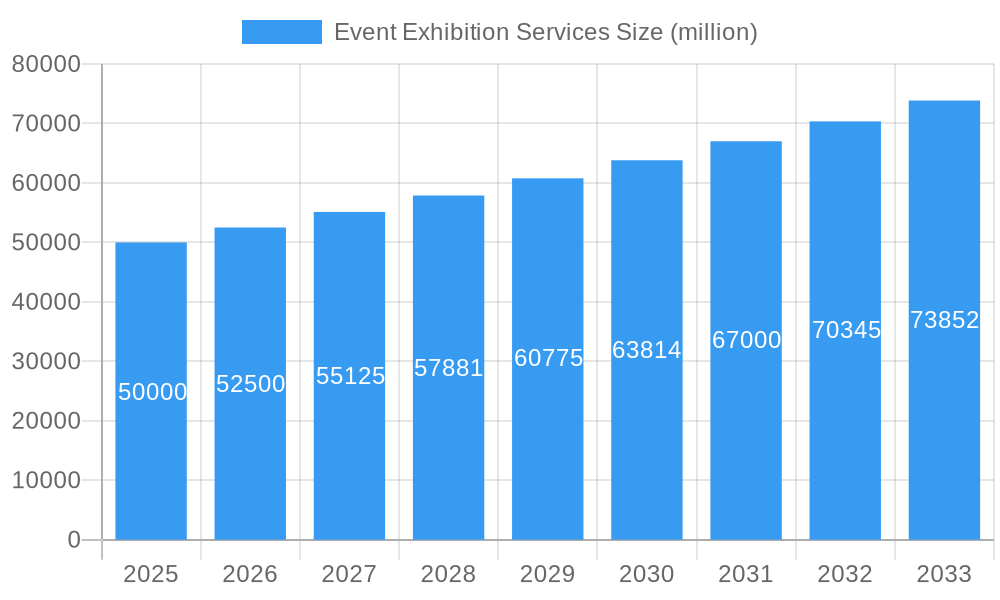
The global event exhibition services market is a dynamic and rapidly evolving sector, characterized by significant growth driven by the increasing frequency of trade shows, conferences, and corporate events. The market's expansion is fueled by the rising need for businesses to connect with potential clients, partners, and investors, leading to a heightened demand for professional event management and exhibition services. Technological advancements, such as virtual and hybrid event platforms, are transforming the industry, offering new avenues for engagement and expanding the reach of exhibitions. Furthermore, the increasing adoption of data analytics and marketing automation tools is allowing event organizers to personalize the attendee experience and measure the success of their events more effectively. Despite potential challenges like economic fluctuations and the lingering effects of past pandemics impacting in-person events, the long-term outlook for the event exhibition services market remains positive, driven by the enduring need for face-to-face networking and brand building opportunities. We estimate the 2025 market size to be around $50 billion, based on industry reports and considering recent growth patterns. A healthy CAGR of 5-7% is projected through 2033, reflecting the continued adoption of innovative technologies and the resilience of the event industry.
Event Exhibition Services Market Size (In Billion)

Key players like Rocket, EESL, PEM, and others are strategically investing in technology and expanding their service offerings to maintain a competitive edge. The segmentation within the market is diverse, encompassing various service categories such as design and build, AV and technology integration, event planning and management, and marketing and promotion. Regional growth varies, with North America and Europe currently holding significant market share, while emerging economies in Asia and the Pacific are poised for rapid expansion. While economic uncertainties could pose challenges, the strategic adaptation by industry players and the inherent demand for in-person events will continue to drive growth in the coming years. The focus on sustainability and digital integration will continue to shape market trends.
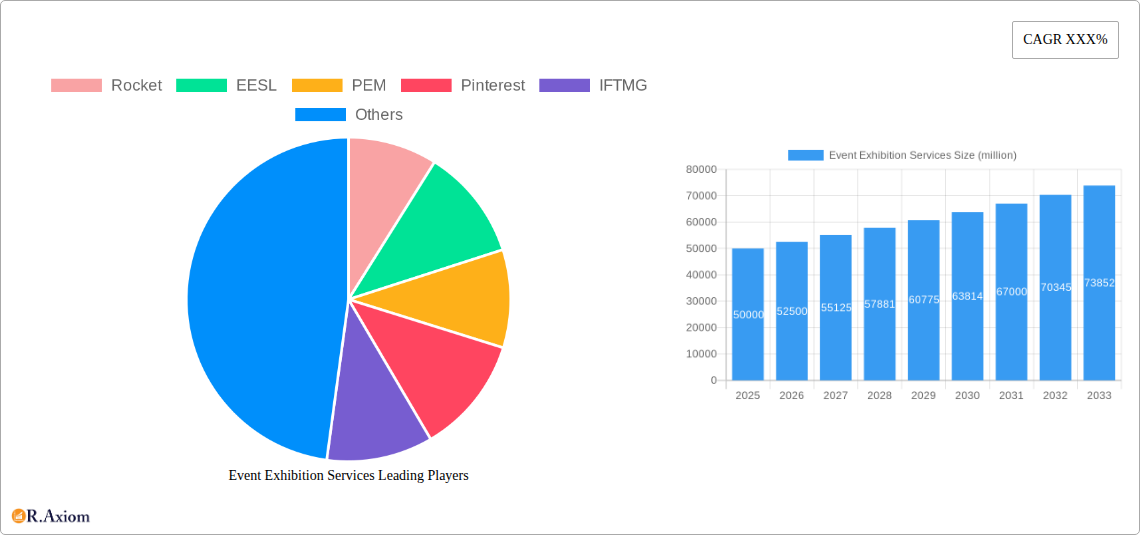
Event Exhibition Services Company Market Share
This in-depth report provides a comprehensive analysis of the global Event Exhibition Services market, offering invaluable insights for industry stakeholders, investors, and businesses seeking to navigate this dynamic landscape. The study period covers 2019-2033, with 2025 serving as the base and estimated year. The report leverages rigorous research methodologies to forecast market trends from 2025-2033, analyzing historical data from 2019-2024. The report's value exceeds $xx million.
Event Exhibition Services Market Concentration & Innovation
This section analyzes market concentration, innovation drivers, regulatory frameworks, product substitutes, end-user trends, and M&A activities within the event exhibition services sector.
The market exhibits moderate concentration, with the top five players – GES, Freeman, Encore, Edlen, and Shepard – collectively holding an estimated 35% market share in 2025. Smaller players, such as Rocket, EESL, PEM, Pinterest, IFTMG, Exporoad, ExpoExhibitionStands, SWEDISH DESIGNS, Lion, Conex, Alliance, Whitespace, PRX, and ES, contribute to the remaining market share, fostering competition and innovation.
- Market Share (2025 Estimate): Top 5 players: 35%; Remaining players: 65%
- M&A Activity (2019-2024): A total of xx million dollars were invested in M&A deals, with the average deal size being xx million. Notable transactions included the acquisition of [insert example if available, otherwise "Company A by Company B"] for xx million.
- Innovation Drivers: Technological advancements in event technology (e.g., virtual and hybrid events), sustainable event practices, and evolving customer expectations are key innovation drivers.
- Regulatory Landscape: Regulations concerning event safety, accessibility, and environmental impact influence market dynamics. Variations in these regulations across different regions create both challenges and opportunities.
- Product Substitutes: The rise of virtual and online event platforms poses a significant challenge, acting as a partial substitute for traditional physical events.
Event Exhibition Services Industry Trends & Insights
The global Event Exhibition Services market is projected to experience significant growth during the forecast period (2025-2033), with a Compound Annual Growth Rate (CAGR) of xx%. This growth is fueled by several key factors.
The increasing preference for experiential marketing and the resurgence of in-person events post-pandemic are driving market expansion. Technological innovations, such as interactive displays, virtual reality experiences, and data analytics, are enhancing event engagement and value. Moreover, a growing focus on sustainability and eco-friendly event practices is shaping industry trends. The competitive landscape is characterized by both established players and emerging companies vying for market share through innovative services and strategic partnerships. Market penetration is expected to increase significantly, particularly in developing economies, as event participation continues to rise. Consumer preferences are shifting towards more personalized, immersive, and digitally integrated event experiences.
Dominant Markets & Segments in Event Exhibition Services
North America currently holds the leading position in the Event Exhibition Services market, driven by strong economic conditions, robust infrastructure, and a high concentration of major corporate events.
- Key Drivers in North America:
- Large corporate spending on events and exhibitions.
- Developed infrastructure supporting large-scale events.
- High concentration of event planning agencies and service providers.
- Favorable regulatory environment.
Europe follows as a significant market, exhibiting consistent growth fueled by government initiatives promoting tourism and cultural events, while Asia-Pacific is expected to experience rapid expansion in the coming years, driven by the growing middle class and increased disposable income. The dominant segment is the corporate events sector, accounting for approximately xx% of the total market value, followed by trade shows and conferences.
Event Exhibition Services Product Developments
Recent product developments focus on integrating cutting-edge technology to enhance event experiences. This includes incorporating virtual reality and augmented reality features, interactive kiosks, data analytics platforms for post-event insights, and sustainable materials for exhibition stands. These innovations aim to cater to evolving consumer preferences for immersive, engaging, and environmentally responsible events. Companies are also investing in sophisticated event management software to streamline operations and improve efficiency.
Report Scope & Segmentation Analysis
This report segments the Event Exhibition Services market based on several key factors:
- By Service Type: Stand design and construction, event logistics, AV services, catering, registration, and others. Each segment exhibits unique growth trajectories and competitive dynamics.
- By Event Type: Corporate events, trade shows, conferences, festivals, and others. Market sizes and growth projections vary considerably across these segments.
- By Region: North America, Europe, Asia-Pacific, Middle East & Africa, and South America. Regional variations in market size, growth rates, and competitive landscapes are thoroughly examined.
Key Drivers of Event Exhibition Services Growth
The growth of the Event Exhibition Services market is propelled by several key factors, including:
- Technological advancements: The integration of technology enhances event experiences and efficiency.
- Economic growth: Increased disposable income in developing economies fuels higher event participation.
- Government initiatives: Policies supporting tourism and events contribute to market expansion.
- Growing demand for experiential marketing: Companies increasingly rely on events to engage with consumers.
Challenges in the Event Exhibition Services Sector
The Event Exhibition Services sector faces several challenges, including:
- Economic fluctuations: Recessions or economic downturns can reduce event budgets.
- Supply chain disruptions: Logistics and materials sourcing can be affected by global events.
- Competition: The market is intensely competitive, with many players vying for market share.
- Sustainability concerns: The environmental impact of large events needs to be addressed. This challenge represents a cost of xx million annually for the industry.
Emerging Opportunities in Event Exhibition Services
The sector offers several emerging opportunities:
- Growth of hybrid and virtual events: Combines the benefits of both online and offline formats.
- Increased demand for data analytics: Event data can provide actionable insights for future planning.
- Expansion into developing economies: Untapped potential exists in emerging markets.
- Focus on sustainable practices: Eco-friendly events are becoming increasingly important.
Key Developments in Event Exhibition Services Industry
- 2022 Q4: GES launched a new sustainability initiative, aiming to reduce its environmental footprint by xx%.
- 2023 Q1: Freeman acquired a technology company specializing in virtual event platforms for xx million.
- 2023 Q3: A major trade show in [location] was canceled due to unforeseen circumstances resulting in xx million in losses.
- 2024 Q2: Several companies invested in developing new sustainable materials for exhibition stands.
Strategic Outlook for Event Exhibition Services Market
The future of the Event Exhibition Services market appears bright, with continued growth driven by technological innovation, economic expansion, and the enduring importance of in-person events. Opportunities exist in developing innovative event formats, leveraging data analytics for better decision-making, and addressing sustainability concerns. The integration of virtual and physical elements, personalized experiences, and data-driven insights will shape the industry’s evolution.
Event Exhibition Services Segmentation
-
1. Application
- 1.1. Technology Industry
- 1.2. Manufacturing Industry
- 1.3. Healthcare Industry
- 1.4. Restaurant & Food Industry
- 1.5. Others
-
2. Type
- 2.1. Temporary Exhibition
- 2.2. Fixed Exhibition
Event Exhibition Services Segmentation By Geography
-
1. North America
- 1.1. United States
- 1.2. Canada
- 1.3. Mexico
-
2. South America
- 2.1. Brazil
- 2.2. Argentina
- 2.3. Rest of South America
-
3. Europe
- 3.1. United Kingdom
- 3.2. Germany
- 3.3. France
- 3.4. Italy
- 3.5. Spain
- 3.6. Russia
- 3.7. Benelux
- 3.8. Nordics
- 3.9. Rest of Europe
-
4. Middle East & Africa
- 4.1. Turkey
- 4.2. Israel
- 4.3. GCC
- 4.4. North Africa
- 4.5. South Africa
- 4.6. Rest of Middle East & Africa
-
5. Asia Pacific
- 5.1. China
- 5.2. India
- 5.3. Japan
- 5.4. South Korea
- 5.5. ASEAN
- 5.6. Oceania
- 5.7. Rest of Asia Pacific

Event Exhibition Services Regional Market Share
Geographic Coverage of Event Exhibition Services
Event Exhibition Services REPORT HIGHLIGHTS
| Aspects | Details |
|---|---|
| Study Period | 2020-2034 |
| Base Year | 2025 |
| Estimated Year | 2026 |
| Forecast Period | 2026-2034 |
| Historical Period | 2020-2025 |
| Growth Rate | CAGR of XXX% from 2020-2034 |
| Segmentation |
|
Table of Contents
- 1. Introduction
- 1.1. Research Scope
- 1.2. Market Segmentation
- 1.3. Research Methodology
- 1.4. Definitions and Assumptions
- 2. Executive Summary
- 2.1. Introduction
- 3. Market Dynamics
- 3.1. Introduction
- 3.2. Market Drivers
- 3.3. Market Restrains
- 3.4. Market Trends
- 4. Market Factor Analysis
- 4.1. Porters Five Forces
- 4.2. Supply/Value Chain
- 4.3. PESTEL analysis
- 4.4. Market Entropy
- 4.5. Patent/Trademark Analysis
- 5. Global Event Exhibition Services Analysis, Insights and Forecast, 2020-2032
- 5.1. Market Analysis, Insights and Forecast - by Application
- 5.1.1. Technology Industry
- 5.1.2. Manufacturing Industry
- 5.1.3. Healthcare Industry
- 5.1.4. Restaurant & Food Industry
- 5.1.5. Others
- 5.2. Market Analysis, Insights and Forecast - by Type
- 5.2.1. Temporary Exhibition
- 5.2.2. Fixed Exhibition
- 5.3. Market Analysis, Insights and Forecast - by Region
- 5.3.1. North America
- 5.3.2. South America
- 5.3.3. Europe
- 5.3.4. Middle East & Africa
- 5.3.5. Asia Pacific
- 5.1. Market Analysis, Insights and Forecast - by Application
- 6. North America Event Exhibition Services Analysis, Insights and Forecast, 2020-2032
- 6.1. Market Analysis, Insights and Forecast - by Application
- 6.1.1. Technology Industry
- 6.1.2. Manufacturing Industry
- 6.1.3. Healthcare Industry
- 6.1.4. Restaurant & Food Industry
- 6.1.5. Others
- 6.2. Market Analysis, Insights and Forecast - by Type
- 6.2.1. Temporary Exhibition
- 6.2.2. Fixed Exhibition
- 6.1. Market Analysis, Insights and Forecast - by Application
- 7. South America Event Exhibition Services Analysis, Insights and Forecast, 2020-2032
- 7.1. Market Analysis, Insights and Forecast - by Application
- 7.1.1. Technology Industry
- 7.1.2. Manufacturing Industry
- 7.1.3. Healthcare Industry
- 7.1.4. Restaurant & Food Industry
- 7.1.5. Others
- 7.2. Market Analysis, Insights and Forecast - by Type
- 7.2.1. Temporary Exhibition
- 7.2.2. Fixed Exhibition
- 7.1. Market Analysis, Insights and Forecast - by Application
- 8. Europe Event Exhibition Services Analysis, Insights and Forecast, 2020-2032
- 8.1. Market Analysis, Insights and Forecast - by Application
- 8.1.1. Technology Industry
- 8.1.2. Manufacturing Industry
- 8.1.3. Healthcare Industry
- 8.1.4. Restaurant & Food Industry
- 8.1.5. Others
- 8.2. Market Analysis, Insights and Forecast - by Type
- 8.2.1. Temporary Exhibition
- 8.2.2. Fixed Exhibition
- 8.1. Market Analysis, Insights and Forecast - by Application
- 9. Middle East & Africa Event Exhibition Services Analysis, Insights and Forecast, 2020-2032
- 9.1. Market Analysis, Insights and Forecast - by Application
- 9.1.1. Technology Industry
- 9.1.2. Manufacturing Industry
- 9.1.3. Healthcare Industry
- 9.1.4. Restaurant & Food Industry
- 9.1.5. Others
- 9.2. Market Analysis, Insights and Forecast - by Type
- 9.2.1. Temporary Exhibition
- 9.2.2. Fixed Exhibition
- 9.1. Market Analysis, Insights and Forecast - by Application
- 10. Asia Pacific Event Exhibition Services Analysis, Insights and Forecast, 2020-2032
- 10.1. Market Analysis, Insights and Forecast - by Application
- 10.1.1. Technology Industry
- 10.1.2. Manufacturing Industry
- 10.1.3. Healthcare Industry
- 10.1.4. Restaurant & Food Industry
- 10.1.5. Others
- 10.2. Market Analysis, Insights and Forecast - by Type
- 10.2.1. Temporary Exhibition
- 10.2.2. Fixed Exhibition
- 10.1. Market Analysis, Insights and Forecast - by Application
- 11. Competitive Analysis
- 11.1. Global Market Share Analysis 2025
- 11.2. Company Profiles
- 11.2.1 Rocket
- 11.2.1.1. Overview
- 11.2.1.2. Products
- 11.2.1.3. SWOT Analysis
- 11.2.1.4. Recent Developments
- 11.2.1.5. Financials (Based on Availability)
- 11.2.2 EESL
- 11.2.2.1. Overview
- 11.2.2.2. Products
- 11.2.2.3. SWOT Analysis
- 11.2.2.4. Recent Developments
- 11.2.2.5. Financials (Based on Availability)
- 11.2.3 PEM
- 11.2.3.1. Overview
- 11.2.3.2. Products
- 11.2.3.3. SWOT Analysis
- 11.2.3.4. Recent Developments
- 11.2.3.5. Financials (Based on Availability)
- 11.2.4 Pinterest
- 11.2.4.1. Overview
- 11.2.4.2. Products
- 11.2.4.3. SWOT Analysis
- 11.2.4.4. Recent Developments
- 11.2.4.5. Financials (Based on Availability)
- 11.2.5 IFTMG
- 11.2.5.1. Overview
- 11.2.5.2. Products
- 11.2.5.3. SWOT Analysis
- 11.2.5.4. Recent Developments
- 11.2.5.5. Financials (Based on Availability)
- 11.2.6 Exporoad
- 11.2.6.1. Overview
- 11.2.6.2. Products
- 11.2.6.3. SWOT Analysis
- 11.2.6.4. Recent Developments
- 11.2.6.5. Financials (Based on Availability)
- 11.2.7 ExpoExhibitionStands
- 11.2.7.1. Overview
- 11.2.7.2. Products
- 11.2.7.3. SWOT Analysis
- 11.2.7.4. Recent Developments
- 11.2.7.5. Financials (Based on Availability)
- 11.2.8 SWEDISH DESIGNS
- 11.2.8.1. Overview
- 11.2.8.2. Products
- 11.2.8.3. SWOT Analysis
- 11.2.8.4. Recent Developments
- 11.2.8.5. Financials (Based on Availability)
- 11.2.9 Lion
- 11.2.9.1. Overview
- 11.2.9.2. Products
- 11.2.9.3. SWOT Analysis
- 11.2.9.4. Recent Developments
- 11.2.9.5. Financials (Based on Availability)
- 11.2.10 Shepard
- 11.2.10.1. Overview
- 11.2.10.2. Products
- 11.2.10.3. SWOT Analysis
- 11.2.10.4. Recent Developments
- 11.2.10.5. Financials (Based on Availability)
- 11.2.11 GES
- 11.2.11.1. Overview
- 11.2.11.2. Products
- 11.2.11.3. SWOT Analysis
- 11.2.11.4. Recent Developments
- 11.2.11.5. Financials (Based on Availability)
- 11.2.12 Edlen
- 11.2.12.1. Overview
- 11.2.12.2. Products
- 11.2.12.3. SWOT Analysis
- 11.2.12.4. Recent Developments
- 11.2.12.5. Financials (Based on Availability)
- 11.2.13 Freeman
- 11.2.13.1. Overview
- 11.2.13.2. Products
- 11.2.13.3. SWOT Analysis
- 11.2.13.4. Recent Developments
- 11.2.13.5. Financials (Based on Availability)
- 11.2.14 Conex
- 11.2.14.1. Overview
- 11.2.14.2. Products
- 11.2.14.3. SWOT Analysis
- 11.2.14.4. Recent Developments
- 11.2.14.5. Financials (Based on Availability)
- 11.2.15 Alliance
- 11.2.15.1. Overview
- 11.2.15.2. Products
- 11.2.15.3. SWOT Analysis
- 11.2.15.4. Recent Developments
- 11.2.15.5. Financials (Based on Availability)
- 11.2.16 Whitespace
- 11.2.16.1. Overview
- 11.2.16.2. Products
- 11.2.16.3. SWOT Analysis
- 11.2.16.4. Recent Developments
- 11.2.16.5. Financials (Based on Availability)
- 11.2.17 PRX
- 11.2.17.1. Overview
- 11.2.17.2. Products
- 11.2.17.3. SWOT Analysis
- 11.2.17.4. Recent Developments
- 11.2.17.5. Financials (Based on Availability)
- 11.2.18 ES
- 11.2.18.1. Overview
- 11.2.18.2. Products
- 11.2.18.3. SWOT Analysis
- 11.2.18.4. Recent Developments
- 11.2.18.5. Financials (Based on Availability)
- 11.2.19 Encore
- 11.2.19.1. Overview
- 11.2.19.2. Products
- 11.2.19.3. SWOT Analysis
- 11.2.19.4. Recent Developments
- 11.2.19.5. Financials (Based on Availability)
- 11.2.1 Rocket
List of Figures
- Figure 1: Global Event Exhibition Services Revenue Breakdown (million, %) by Region 2025 & 2033
- Figure 2: North America Event Exhibition Services Revenue (million), by Application 2025 & 2033
- Figure 3: North America Event Exhibition Services Revenue Share (%), by Application 2025 & 2033
- Figure 4: North America Event Exhibition Services Revenue (million), by Type 2025 & 2033
- Figure 5: North America Event Exhibition Services Revenue Share (%), by Type 2025 & 2033
- Figure 6: North America Event Exhibition Services Revenue (million), by Country 2025 & 2033
- Figure 7: North America Event Exhibition Services Revenue Share (%), by Country 2025 & 2033
- Figure 8: South America Event Exhibition Services Revenue (million), by Application 2025 & 2033
- Figure 9: South America Event Exhibition Services Revenue Share (%), by Application 2025 & 2033
- Figure 10: South America Event Exhibition Services Revenue (million), by Type 2025 & 2033
- Figure 11: South America Event Exhibition Services Revenue Share (%), by Type 2025 & 2033
- Figure 12: South America Event Exhibition Services Revenue (million), by Country 2025 & 2033
- Figure 13: South America Event Exhibition Services Revenue Share (%), by Country 2025 & 2033
- Figure 14: Europe Event Exhibition Services Revenue (million), by Application 2025 & 2033
- Figure 15: Europe Event Exhibition Services Revenue Share (%), by Application 2025 & 2033
- Figure 16: Europe Event Exhibition Services Revenue (million), by Type 2025 & 2033
- Figure 17: Europe Event Exhibition Services Revenue Share (%), by Type 2025 & 2033
- Figure 18: Europe Event Exhibition Services Revenue (million), by Country 2025 & 2033
- Figure 19: Europe Event Exhibition Services Revenue Share (%), by Country 2025 & 2033
- Figure 20: Middle East & Africa Event Exhibition Services Revenue (million), by Application 2025 & 2033
- Figure 21: Middle East & Africa Event Exhibition Services Revenue Share (%), by Application 2025 & 2033
- Figure 22: Middle East & Africa Event Exhibition Services Revenue (million), by Type 2025 & 2033
- Figure 23: Middle East & Africa Event Exhibition Services Revenue Share (%), by Type 2025 & 2033
- Figure 24: Middle East & Africa Event Exhibition Services Revenue (million), by Country 2025 & 2033
- Figure 25: Middle East & Africa Event Exhibition Services Revenue Share (%), by Country 2025 & 2033
- Figure 26: Asia Pacific Event Exhibition Services Revenue (million), by Application 2025 & 2033
- Figure 27: Asia Pacific Event Exhibition Services Revenue Share (%), by Application 2025 & 2033
- Figure 28: Asia Pacific Event Exhibition Services Revenue (million), by Type 2025 & 2033
- Figure 29: Asia Pacific Event Exhibition Services Revenue Share (%), by Type 2025 & 2033
- Figure 30: Asia Pacific Event Exhibition Services Revenue (million), by Country 2025 & 2033
- Figure 31: Asia Pacific Event Exhibition Services Revenue Share (%), by Country 2025 & 2033
List of Tables
- Table 1: Global Event Exhibition Services Revenue million Forecast, by Application 2020 & 2033
- Table 2: Global Event Exhibition Services Revenue million Forecast, by Type 2020 & 2033
- Table 3: Global Event Exhibition Services Revenue million Forecast, by Region 2020 & 2033
- Table 4: Global Event Exhibition Services Revenue million Forecast, by Application 2020 & 2033
- Table 5: Global Event Exhibition Services Revenue million Forecast, by Type 2020 & 2033
- Table 6: Global Event Exhibition Services Revenue million Forecast, by Country 2020 & 2033
- Table 7: United States Event Exhibition Services Revenue (million) Forecast, by Application 2020 & 2033
- Table 8: Canada Event Exhibition Services Revenue (million) Forecast, by Application 2020 & 2033
- Table 9: Mexico Event Exhibition Services Revenue (million) Forecast, by Application 2020 & 2033
- Table 10: Global Event Exhibition Services Revenue million Forecast, by Application 2020 & 2033
- Table 11: Global Event Exhibition Services Revenue million Forecast, by Type 2020 & 2033
- Table 12: Global Event Exhibition Services Revenue million Forecast, by Country 2020 & 2033
- Table 13: Brazil Event Exhibition Services Revenue (million) Forecast, by Application 2020 & 2033
- Table 14: Argentina Event Exhibition Services Revenue (million) Forecast, by Application 2020 & 2033
- Table 15: Rest of South America Event Exhibition Services Revenue (million) Forecast, by Application 2020 & 2033
- Table 16: Global Event Exhibition Services Revenue million Forecast, by Application 2020 & 2033
- Table 17: Global Event Exhibition Services Revenue million Forecast, by Type 2020 & 2033
- Table 18: Global Event Exhibition Services Revenue million Forecast, by Country 2020 & 2033
- Table 19: United Kingdom Event Exhibition Services Revenue (million) Forecast, by Application 2020 & 2033
- Table 20: Germany Event Exhibition Services Revenue (million) Forecast, by Application 2020 & 2033
- Table 21: France Event Exhibition Services Revenue (million) Forecast, by Application 2020 & 2033
- Table 22: Italy Event Exhibition Services Revenue (million) Forecast, by Application 2020 & 2033
- Table 23: Spain Event Exhibition Services Revenue (million) Forecast, by Application 2020 & 2033
- Table 24: Russia Event Exhibition Services Revenue (million) Forecast, by Application 2020 & 2033
- Table 25: Benelux Event Exhibition Services Revenue (million) Forecast, by Application 2020 & 2033
- Table 26: Nordics Event Exhibition Services Revenue (million) Forecast, by Application 2020 & 2033
- Table 27: Rest of Europe Event Exhibition Services Revenue (million) Forecast, by Application 2020 & 2033
- Table 28: Global Event Exhibition Services Revenue million Forecast, by Application 2020 & 2033
- Table 29: Global Event Exhibition Services Revenue million Forecast, by Type 2020 & 2033
- Table 30: Global Event Exhibition Services Revenue million Forecast, by Country 2020 & 2033
- Table 31: Turkey Event Exhibition Services Revenue (million) Forecast, by Application 2020 & 2033
- Table 32: Israel Event Exhibition Services Revenue (million) Forecast, by Application 2020 & 2033
- Table 33: GCC Event Exhibition Services Revenue (million) Forecast, by Application 2020 & 2033
- Table 34: North Africa Event Exhibition Services Revenue (million) Forecast, by Application 2020 & 2033
- Table 35: South Africa Event Exhibition Services Revenue (million) Forecast, by Application 2020 & 2033
- Table 36: Rest of Middle East & Africa Event Exhibition Services Revenue (million) Forecast, by Application 2020 & 2033
- Table 37: Global Event Exhibition Services Revenue million Forecast, by Application 2020 & 2033
- Table 38: Global Event Exhibition Services Revenue million Forecast, by Type 2020 & 2033
- Table 39: Global Event Exhibition Services Revenue million Forecast, by Country 2020 & 2033
- Table 40: China Event Exhibition Services Revenue (million) Forecast, by Application 2020 & 2033
- Table 41: India Event Exhibition Services Revenue (million) Forecast, by Application 2020 & 2033
- Table 42: Japan Event Exhibition Services Revenue (million) Forecast, by Application 2020 & 2033
- Table 43: South Korea Event Exhibition Services Revenue (million) Forecast, by Application 2020 & 2033
- Table 44: ASEAN Event Exhibition Services Revenue (million) Forecast, by Application 2020 & 2033
- Table 45: Oceania Event Exhibition Services Revenue (million) Forecast, by Application 2020 & 2033
- Table 46: Rest of Asia Pacific Event Exhibition Services Revenue (million) Forecast, by Application 2020 & 2033
Frequently Asked Questions
1. What is the projected Compound Annual Growth Rate (CAGR) of the Event Exhibition Services?
The projected CAGR is approximately XXX%.
2. Which companies are prominent players in the Event Exhibition Services?
Key companies in the market include Rocket, EESL, PEM, Pinterest, IFTMG, Exporoad, ExpoExhibitionStands, SWEDISH DESIGNS, Lion, Shepard, GES, Edlen, Freeman, Conex, Alliance, Whitespace, PRX, ES, Encore.
3. What are the main segments of the Event Exhibition Services?
The market segments include Application, Type.
4. Can you provide details about the market size?
The market size is estimated to be USD XXX million as of 2022.
5. What are some drivers contributing to market growth?
N/A
6. What are the notable trends driving market growth?
N/A
7. Are there any restraints impacting market growth?
N/A
8. Can you provide examples of recent developments in the market?
N/A
9. What pricing options are available for accessing the report?
Pricing options include single-user, multi-user, and enterprise licenses priced at USD 3950.00, USD 5925.00, and USD 7900.00 respectively.
10. Is the market size provided in terms of value or volume?
The market size is provided in terms of value, measured in million.
11. Are there any specific market keywords associated with the report?
Yes, the market keyword associated with the report is "Event Exhibition Services," which aids in identifying and referencing the specific market segment covered.
12. How do I determine which pricing option suits my needs best?
The pricing options vary based on user requirements and access needs. Individual users may opt for single-user licenses, while businesses requiring broader access may choose multi-user or enterprise licenses for cost-effective access to the report.
13. Are there any additional resources or data provided in the Event Exhibition Services report?
While the report offers comprehensive insights, it's advisable to review the specific contents or supplementary materials provided to ascertain if additional resources or data are available.
14. How can I stay updated on further developments or reports in the Event Exhibition Services?
To stay informed about further developments, trends, and reports in the Event Exhibition Services, consider subscribing to industry newsletters, following relevant companies and organizations, or regularly checking reputable industry news sources and publications.
Methodology
Step 1 - Identification of Relevant Samples Size from Population Database


Step 2 - Approaches for Defining Global Market Size (Value, Volume* & Price*)

Note*: In applicable scenarios
Step 3 - Data Sources
Primary Research
- Web Analytics
- Survey Reports
- Research Institute
- Latest Research Reports
- Opinion Leaders
Secondary Research
- Annual Reports
- White Paper
- Latest Press Release
- Industry Association
- Paid Database
- Investor Presentations

Step 4 - Data Triangulation
Involves using different sources of information in order to increase the validity of a study
These sources are likely to be stakeholders in a program - participants, other researchers, program staff, other community members, and so on.
Then we put all data in single framework & apply various statistical tools to find out the dynamic on the market.
During the analysis stage, feedback from the stakeholder groups would be compared to determine areas of agreement as well as areas of divergence